


Gold Near The Critical Area
Gold prices are paused from a drop from the long-term inflection of $1,680 and consolidates its drop before the FOMC meetings on Friday. The Fed is expected to increases rates by 75 bps. Investors are avoiding any directional bets on the gold before FED announcements on interest rates decisions, which might influence precious metals and US dollar values.
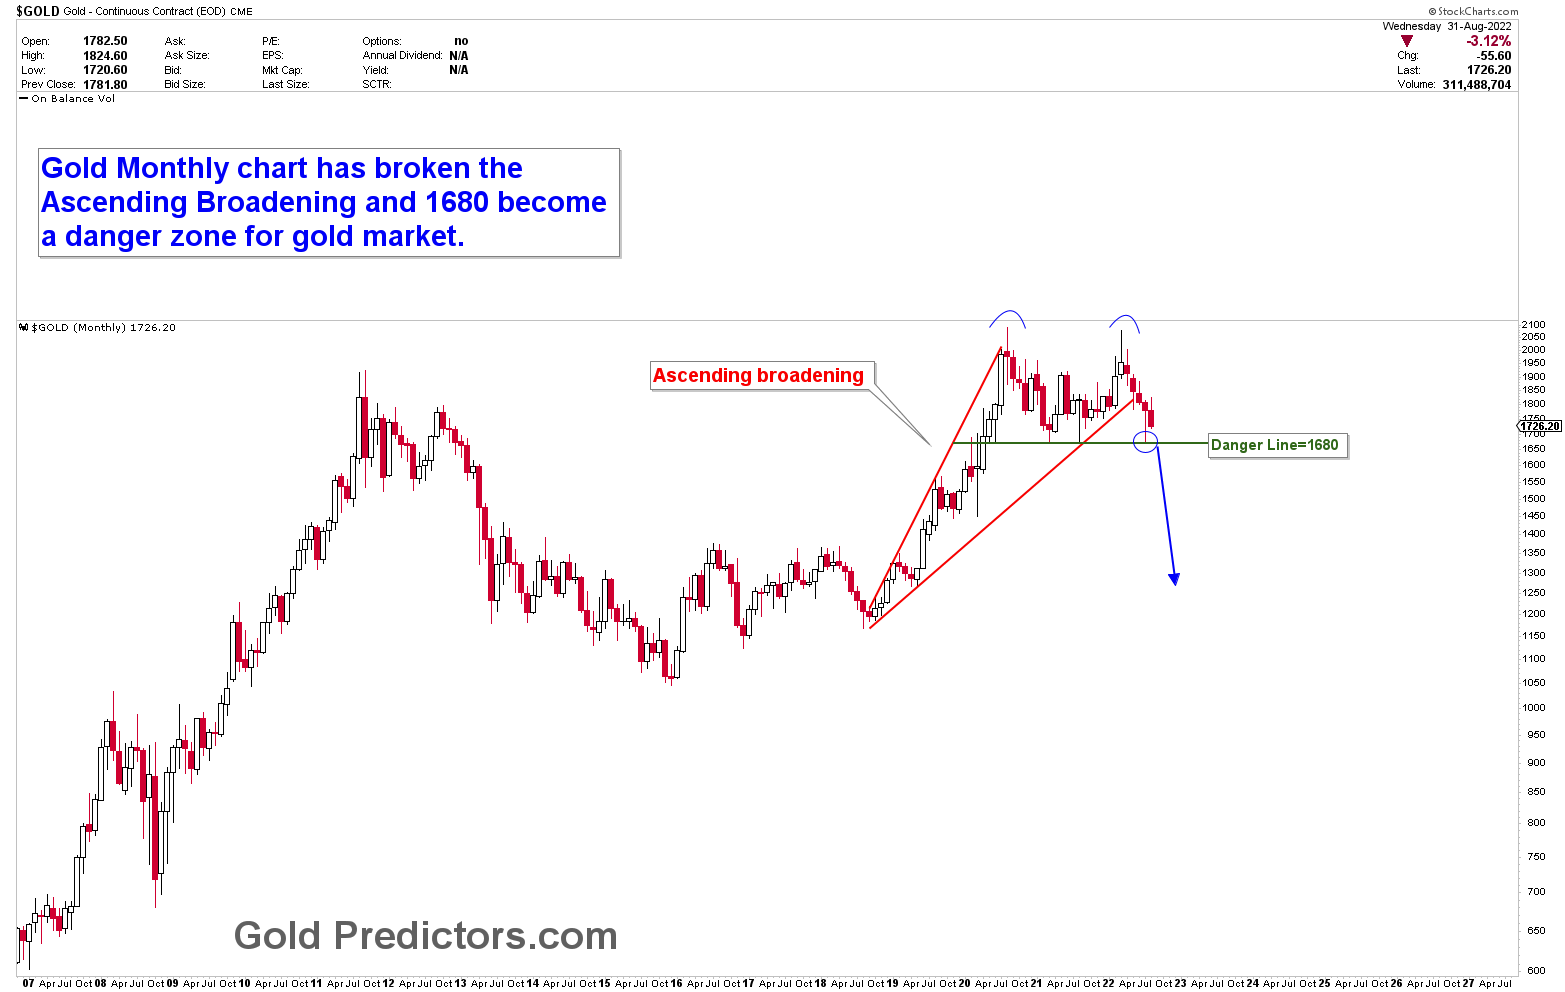
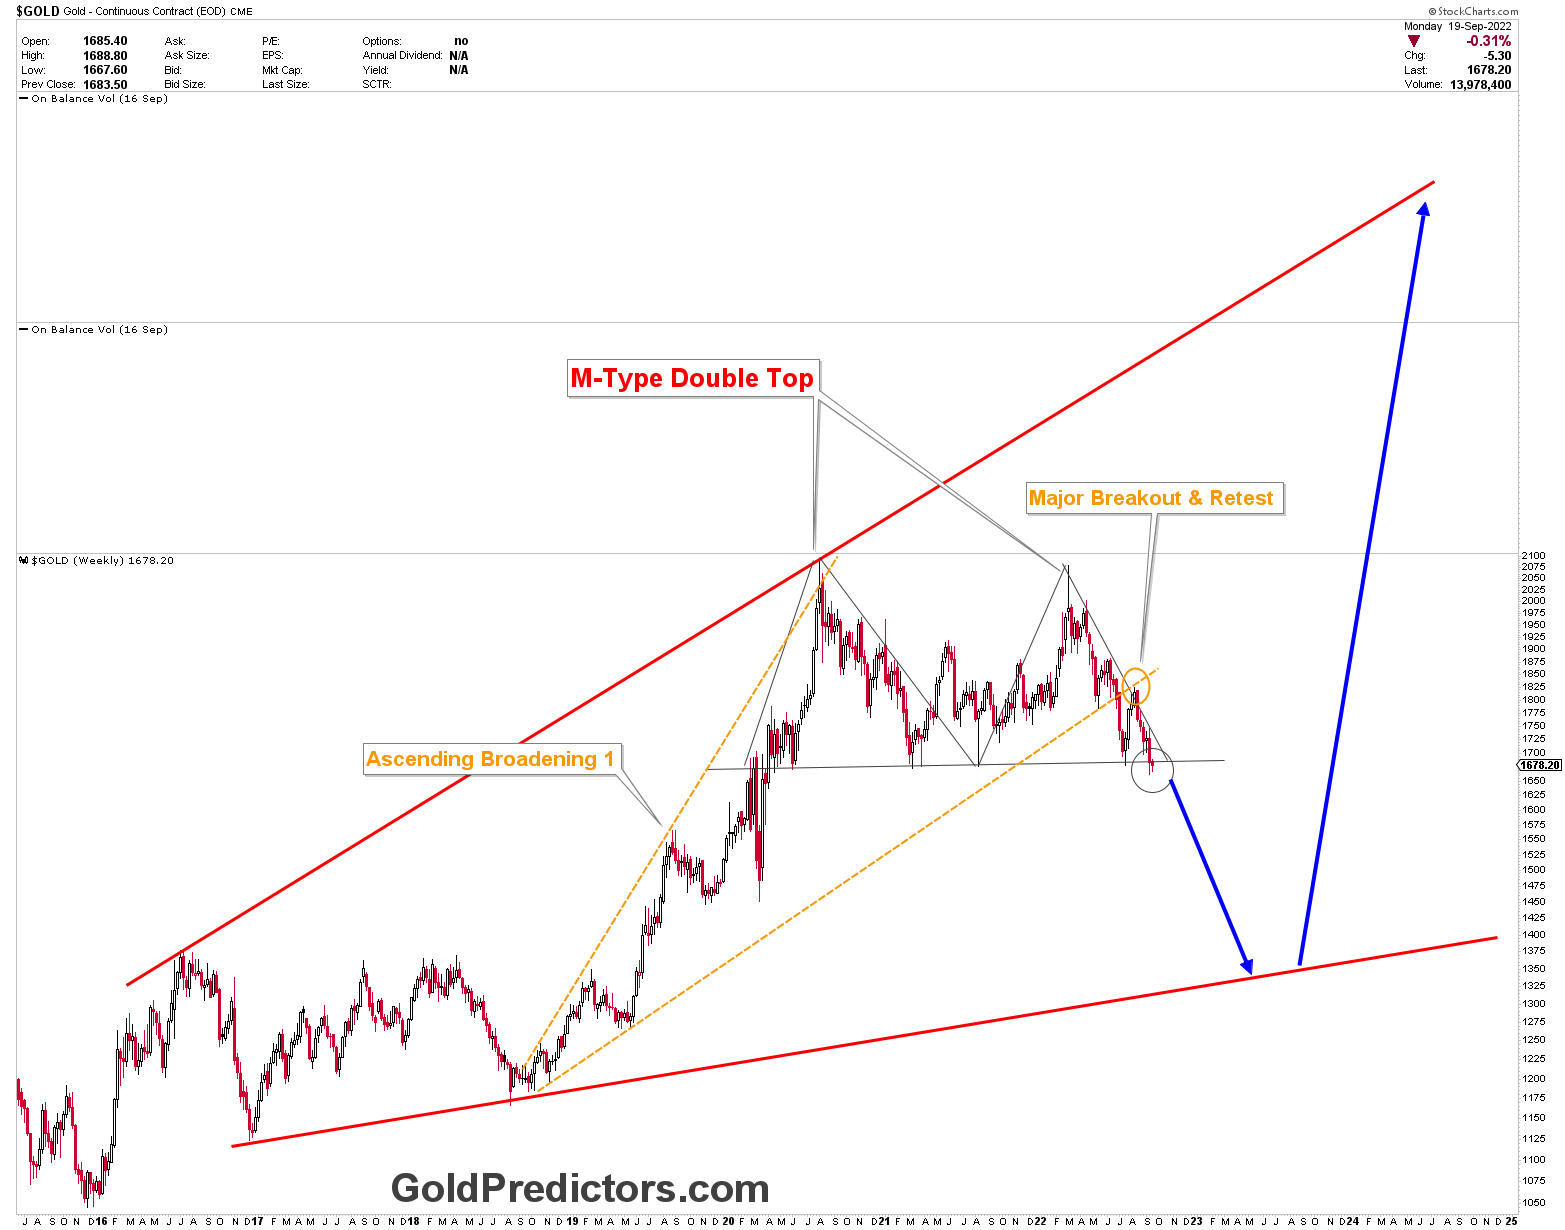
It was expected that gold would break lower to the inflection point of $1,680, with the next market move based on the next breakout at $1,680. However, based on the negative price action from last few months, it was predicted that $1,680 would be broken and much lower prices would be realized. The formation of Ascending Broadening, which was broken 11 weeks ago, confirmed the negative price action in the gold market. A retest of Ascending broadening produced a strong sell signal at $1,800 levels, indicating that gold is headed for much lower levels.
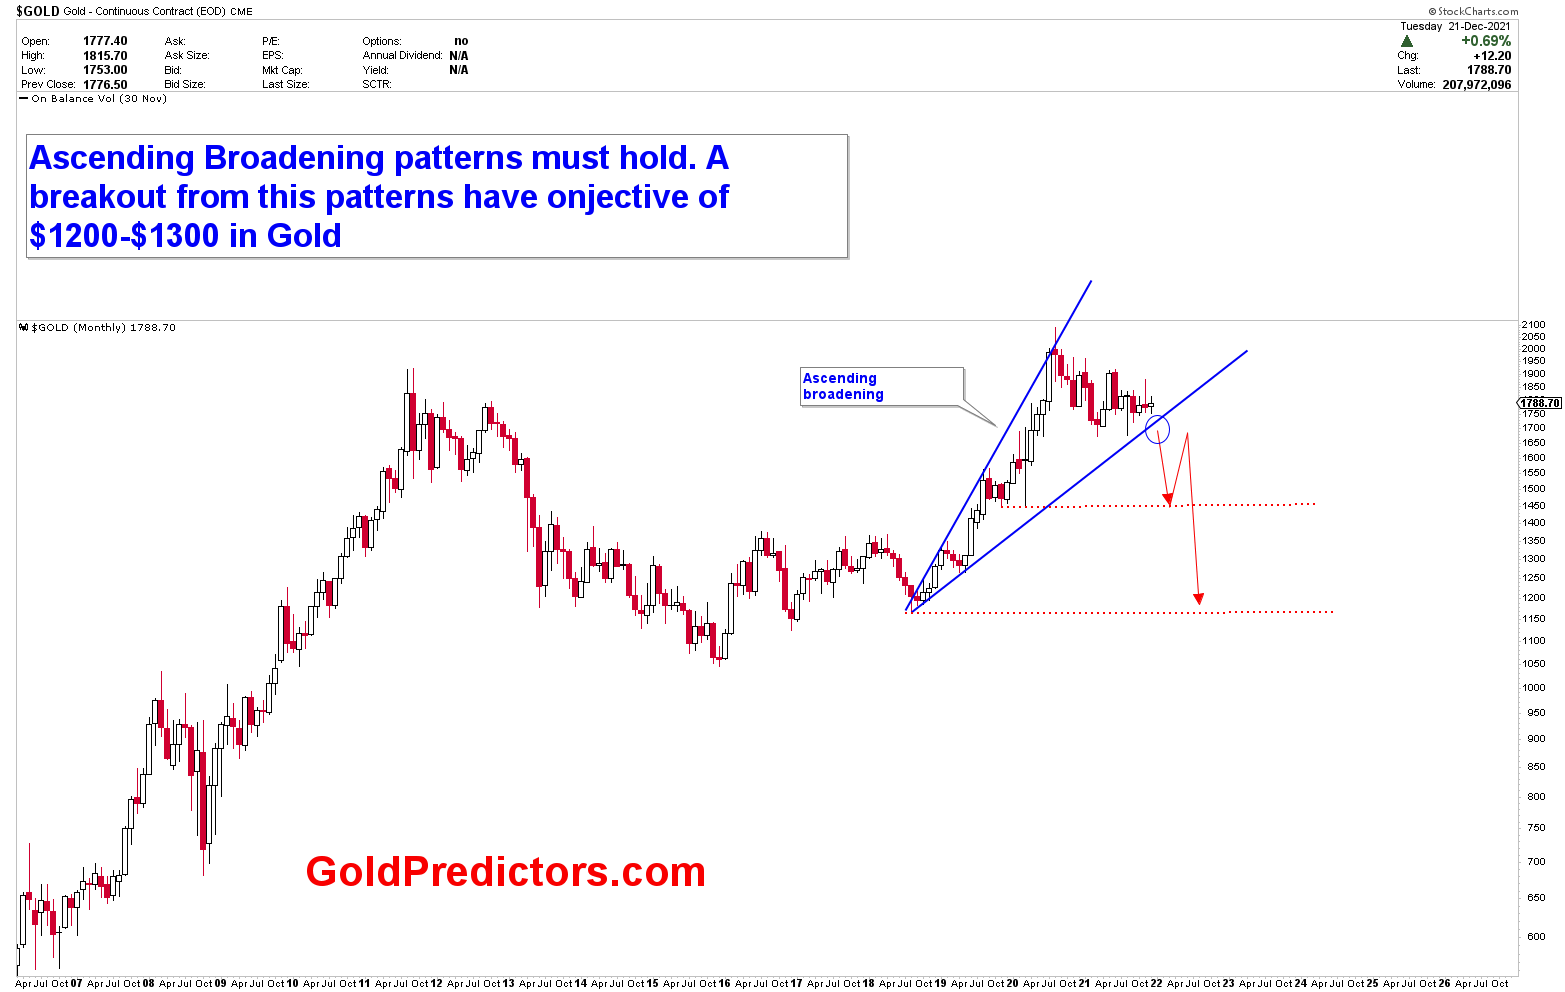
A few months ago, the chart that was used to target lower levels was presented, indicating lower levels in the gold market. The updated chart shows that the price has broken the Ascending Broadening, and a retest of the Ascending Broadening confirms the likelihood of lower gold prices if the $1,680 inflection point is broken.
What if $1,680 inflection is broken?
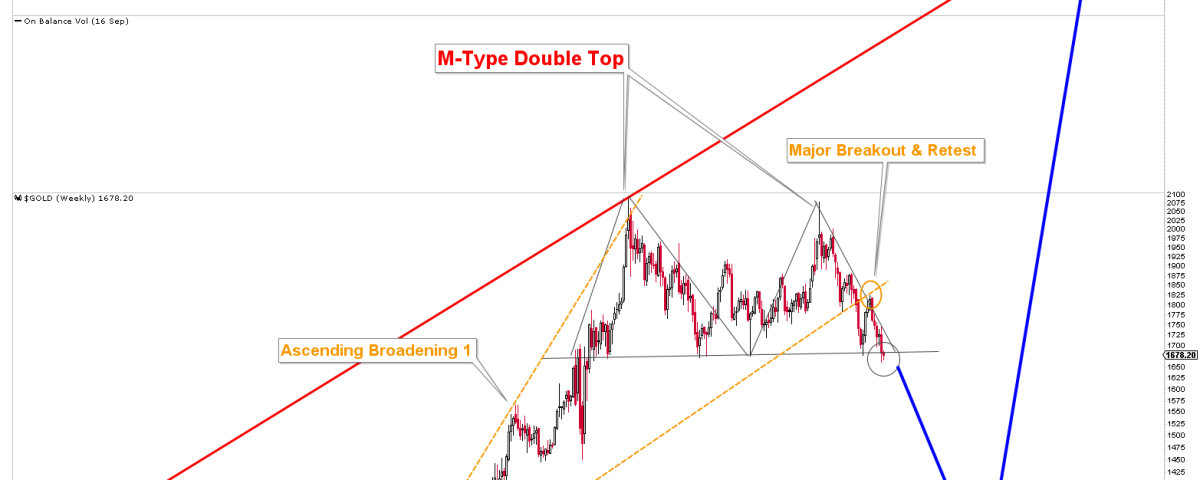
If the long-term inflection points of $1,680 is breached, gold will most likely fall rapidly to much lower levels. As previously discussed, the target of ascending broadening is at $1,200-$1,300, but there are a number of levels that must be monitored and have the potential to produce a sharp bounce back to $1,680. The chart below depicts the formation of a double top with the neckline $1,680. The M-type top will be valid once this neckline is broken. The chart also shows the Ascending broadening (yellow), which was broken and retested, resulting in a sell signal.
How to Trade Gold During Upcoming Decline?
Trading gold has been extremely difficult due to the tremendous volatility caused by geopolitical uncertainty and global inflation. Because the risk is high, so is the reward. Before executing a trade, the risk of the trade must be calculated. Since prices have a 100-dollar range, traders are more likely to execute trades after gold has completed its impulsive move on short-term basis. It has been observed that many investors and traders lost money during the major decline that began with the Covid peak. That loss is due to wrong money management. We have identified two major levels for gold going forward. The first was the $1,680 inflection point, and the second was the $2,075 yearly pivot. When gold reached $2,075 and began to fall with a monthly wick, we presented our strong forecast that gold would likely break the inflection point of $1,680 to break out of this major sideways range. Things have been proceeding as expected.
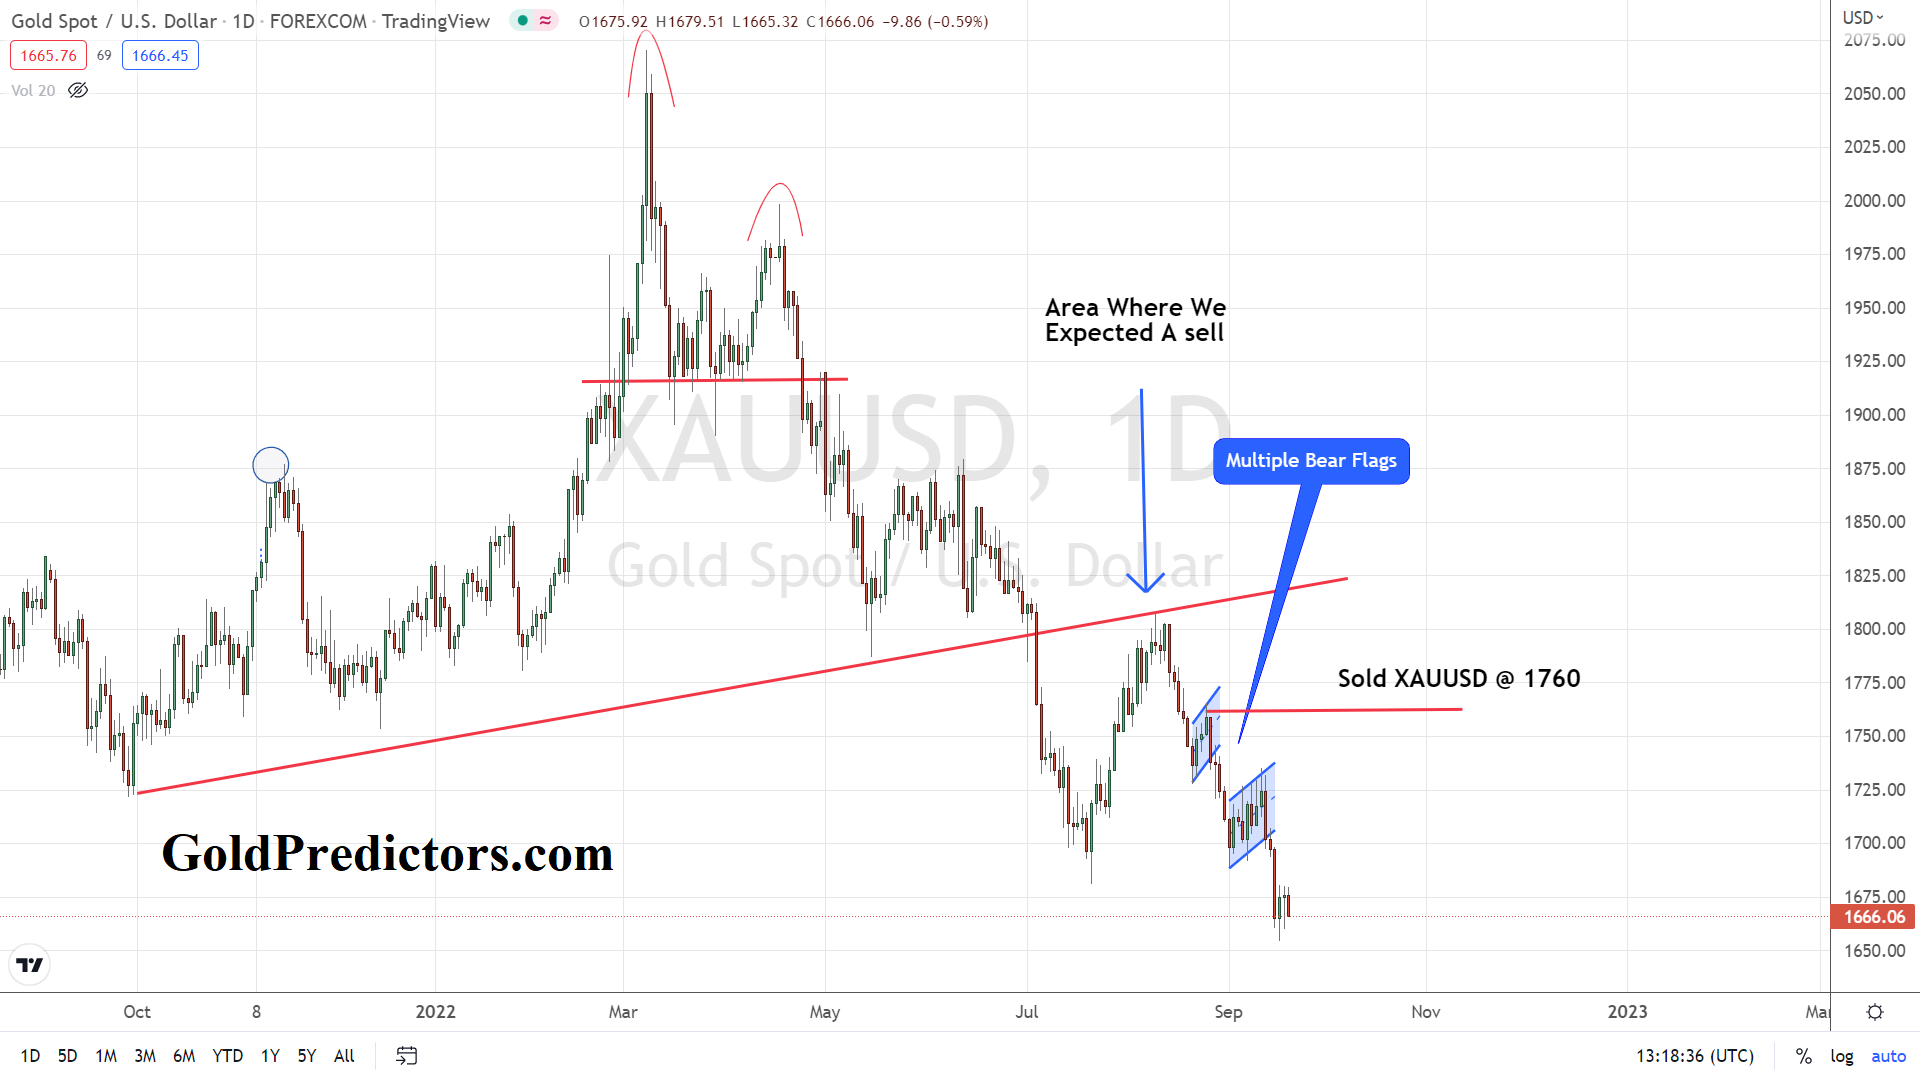
The most recent trade entry was to sell at $1,760, where we anticipated a top and a massive drop below $1,680. The trade was delivered to members via email and WhatsApp, and we are currently making decisions on it. This trade was placed in anticipation of a break from the Ascending Broadening, and a retest of $1,800 was strongly bearish signal. This trade is currently profitable to the tune of $100/ounce.
Please login to read full article!
Please subscribe to the link below to receive free updates.


