


Gold Near to Yearly Supports
The market fundamentals and technical indicators point to a bear stock market. A bear stock market, on the other hand, does not affect the entire economy. As per study, only 14 of the 25 bear stock markets since 1928 have resulted in a recession. However, the previous four bear markets, in 1990, 2000, 2008, and 2020, all resulted in a recession. Each of the four cases are different but the Fed’s recent tightening cycle to combat high inflation may trigger a recession. High interest rates are a good way to combat short-term inflation, but long-term inflation cannot be controlled, and the Fed will most likely implement new monetary policies in the economy. Let’s take a quick look at some fundamental and technical gold charts.
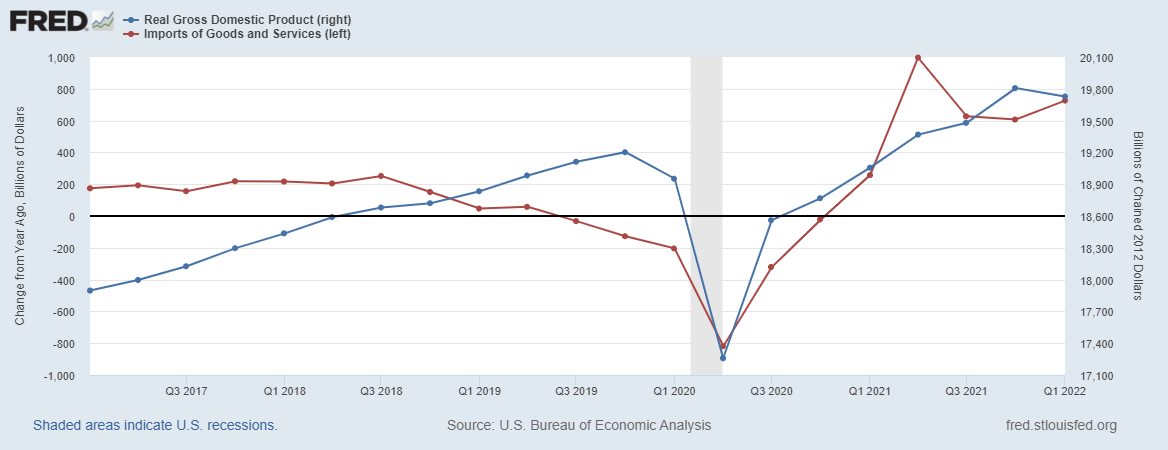
Decline in GDP since 2020 Recession
Importing and exporting activities have an effect on the country’s GDP, inflation, and interest rates. Rising imports and a growing trade deficit put pressure on the US dollar (USD). A weaker US dollar boosts exports while lowering imports, whereas a strong US dollar reduces exports while increasing imports. Higher inflation, on the other hand, has an impact on exports by increasing material and labour costs.
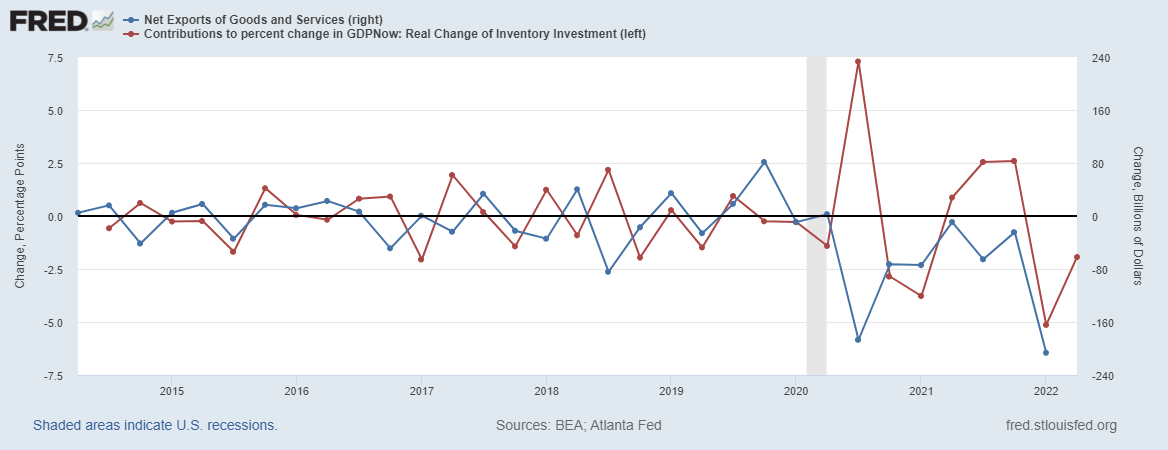
GDP rises significantly in 2021 due to huge fluctuations in net exports of goods and services and inventory investments, but falls by 1.5% annually in the first quarter of 2022. This decrement in GDP is the result of lower levels of exports and inventory investments as seen in the chart. Inventory investments are extremely volatile, but the first quarter of 2022 shows a significant decrease in inventory investment. The imports have an increment pattern, whereas exports have a decrement pattern. There is also a significant drop in net exports in the first quarter of 2022. It is obvious that the decline GDP for the first quarter of 2022 is due to the drop in net exports and investments. However, if net exports continue to decline in upcoming quarters, it will impact the GDP curve.
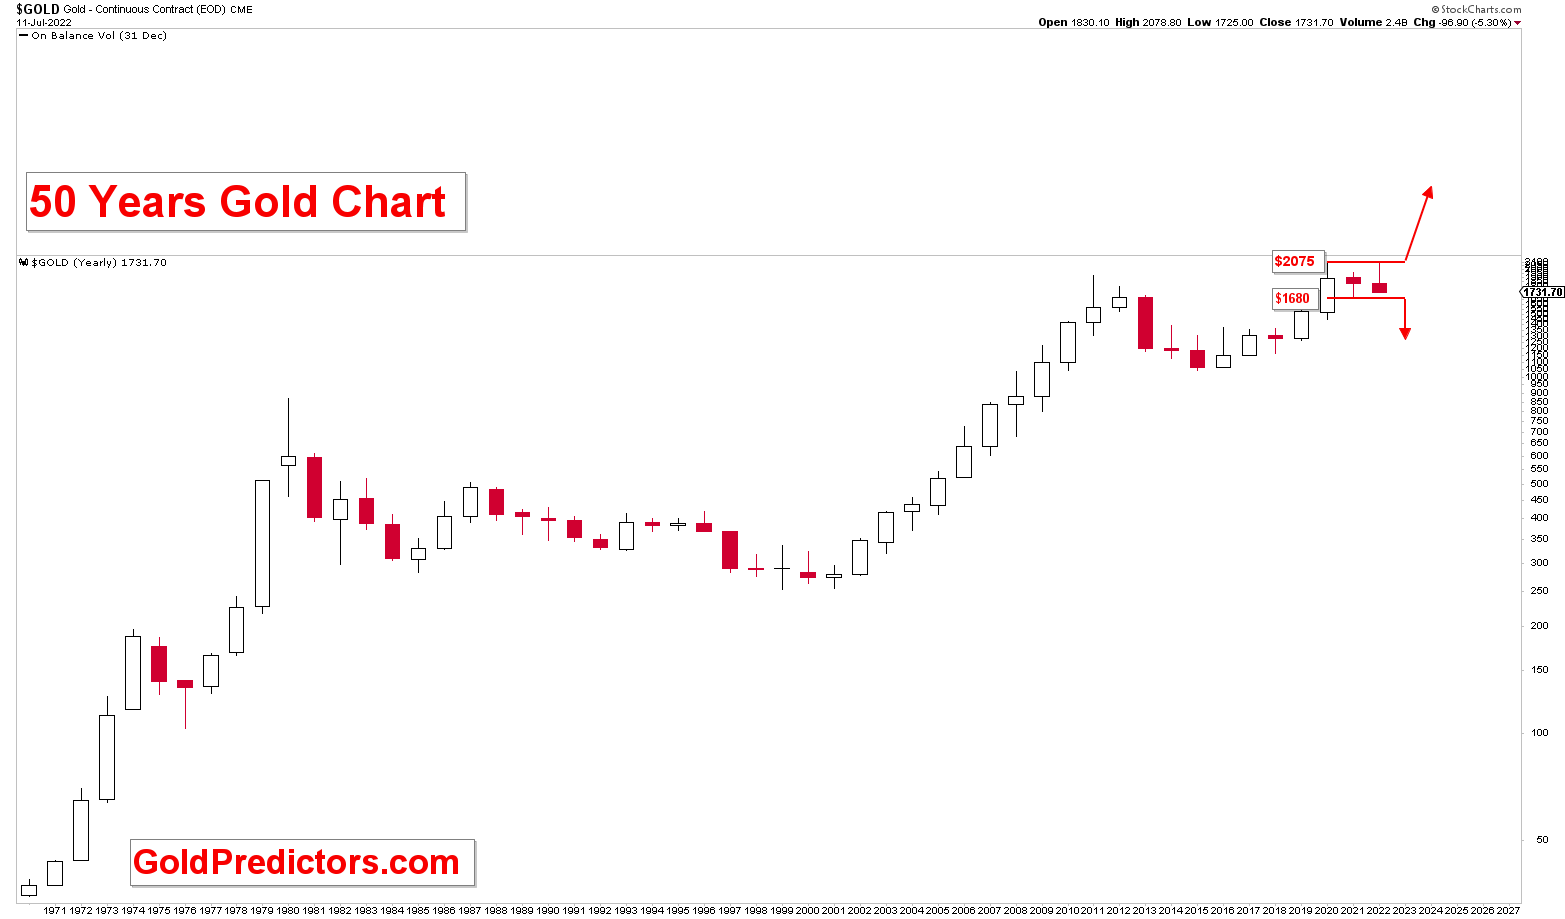
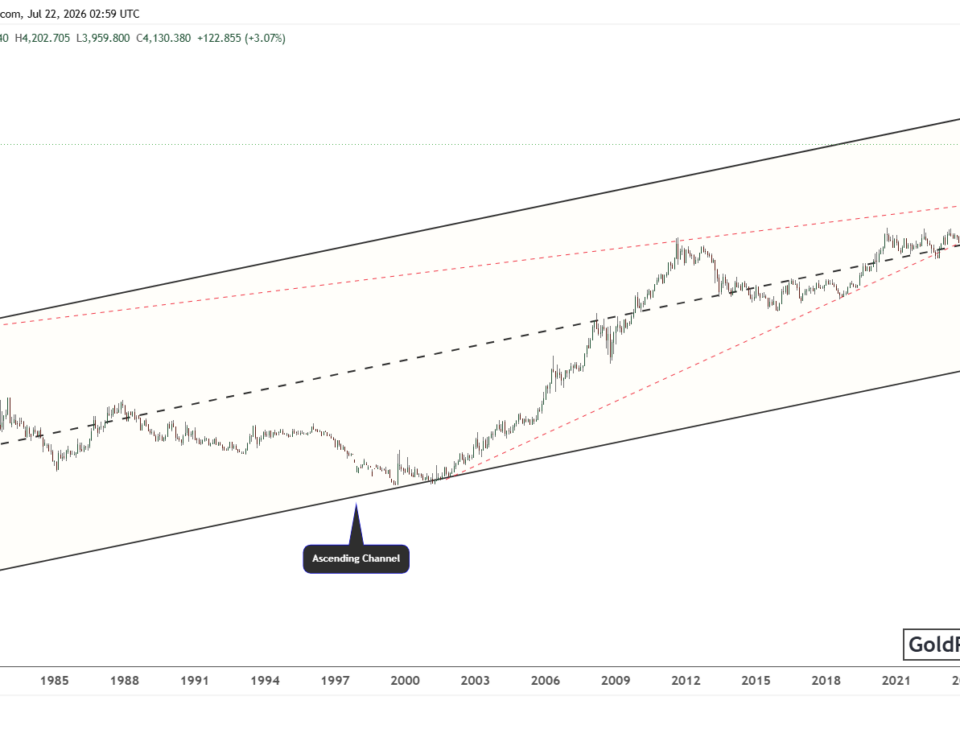
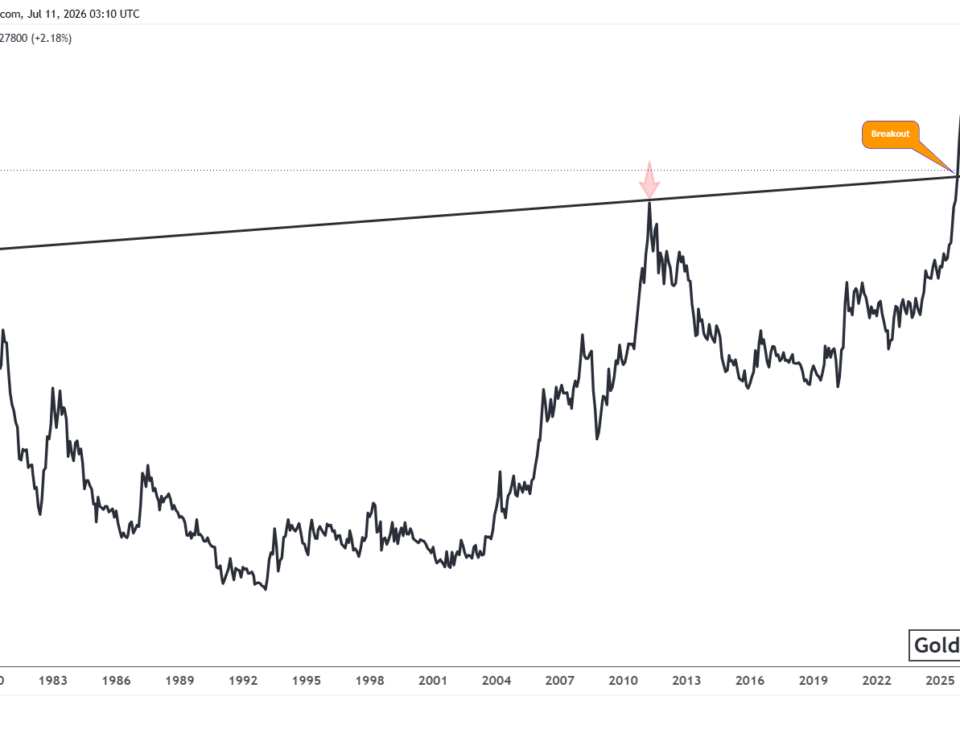
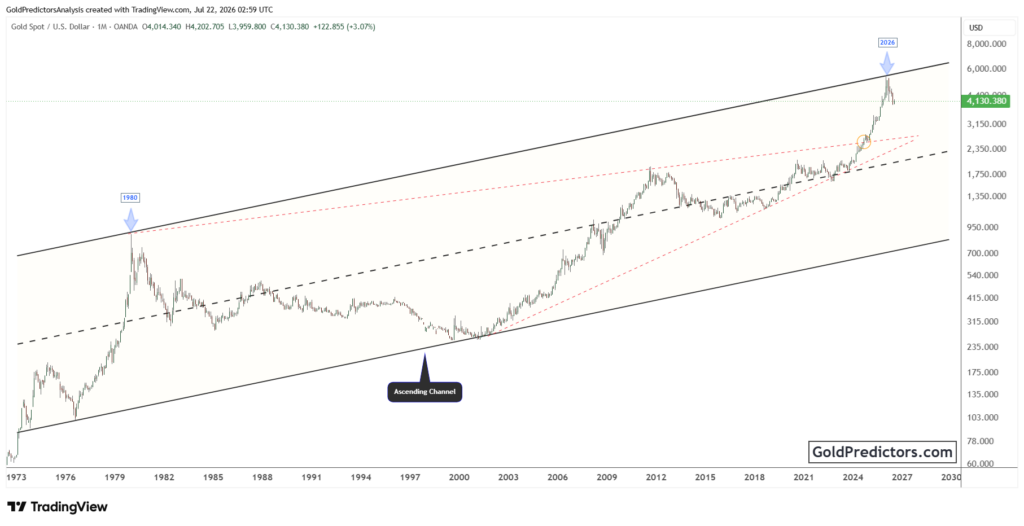
Gold Long-Term Fluctuations
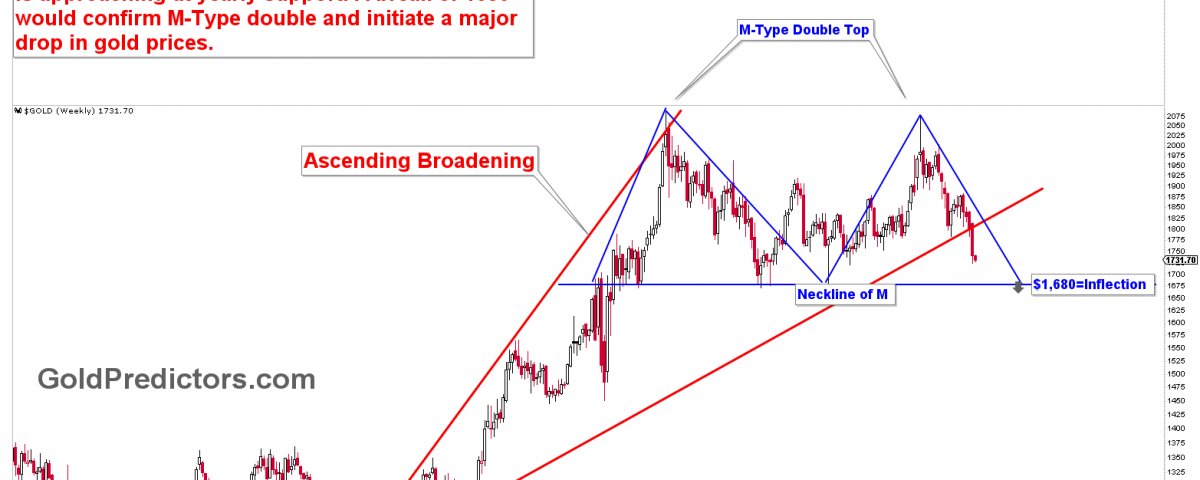
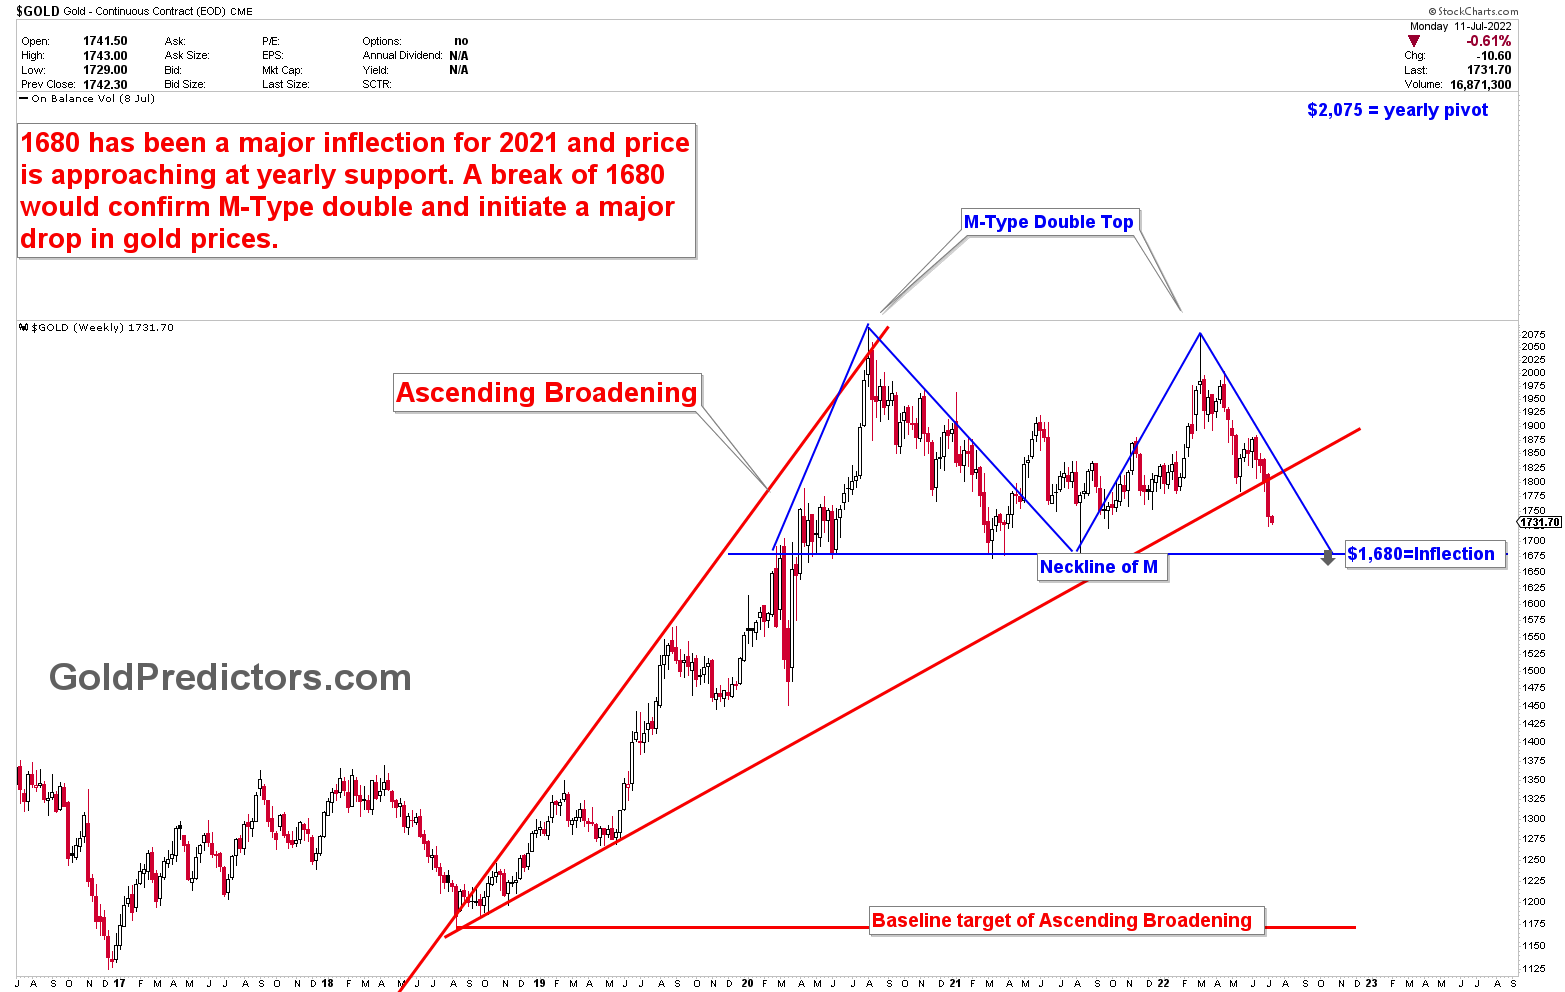
As previously stated, the yearly pivot and key for higher prices was identified as $2,075/ounce. The high was formed at $2,070 and was quickly followed by a drop to lower levels. We talked about $1,680 as the yearly inflection point and strong support for 2021, and the low for 2021 was $1,675. Gold prices have remained within a broad range between $1,680 and $2,075, with prices now approaching the yearly support level of $1,680. The previous year was an inside yearly candle, and the significance of these key numbers are shown in the chart below. The issue with $1,680 is that the formation of M-type double tops points to the formation of bearish patterns for the medium term. The M-type double top is discussed in next session.
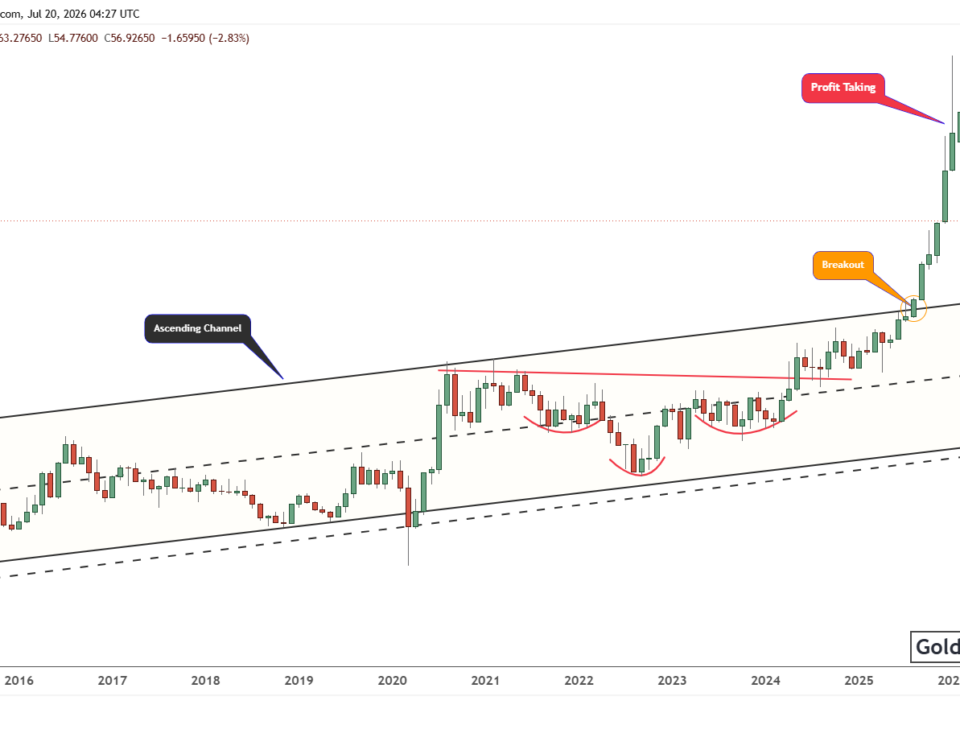
Gold Medium-Term Outlook
For several months, the medium-term picture has been forming ascending broadening patterns. We’ve been keeping an eye on this pattern as a key point with the possibility of a breakdown for quite some time. Prices fell below expectations and are now trading near the $1,680 level. With the breakdown of the patterns, the price is now approaching the yearly support zone between $1,720 and $1,680. A break below $1,680 will confirm the double and signal the start of the next major decline gold market.
Gold Short-Term Patterns & Targets
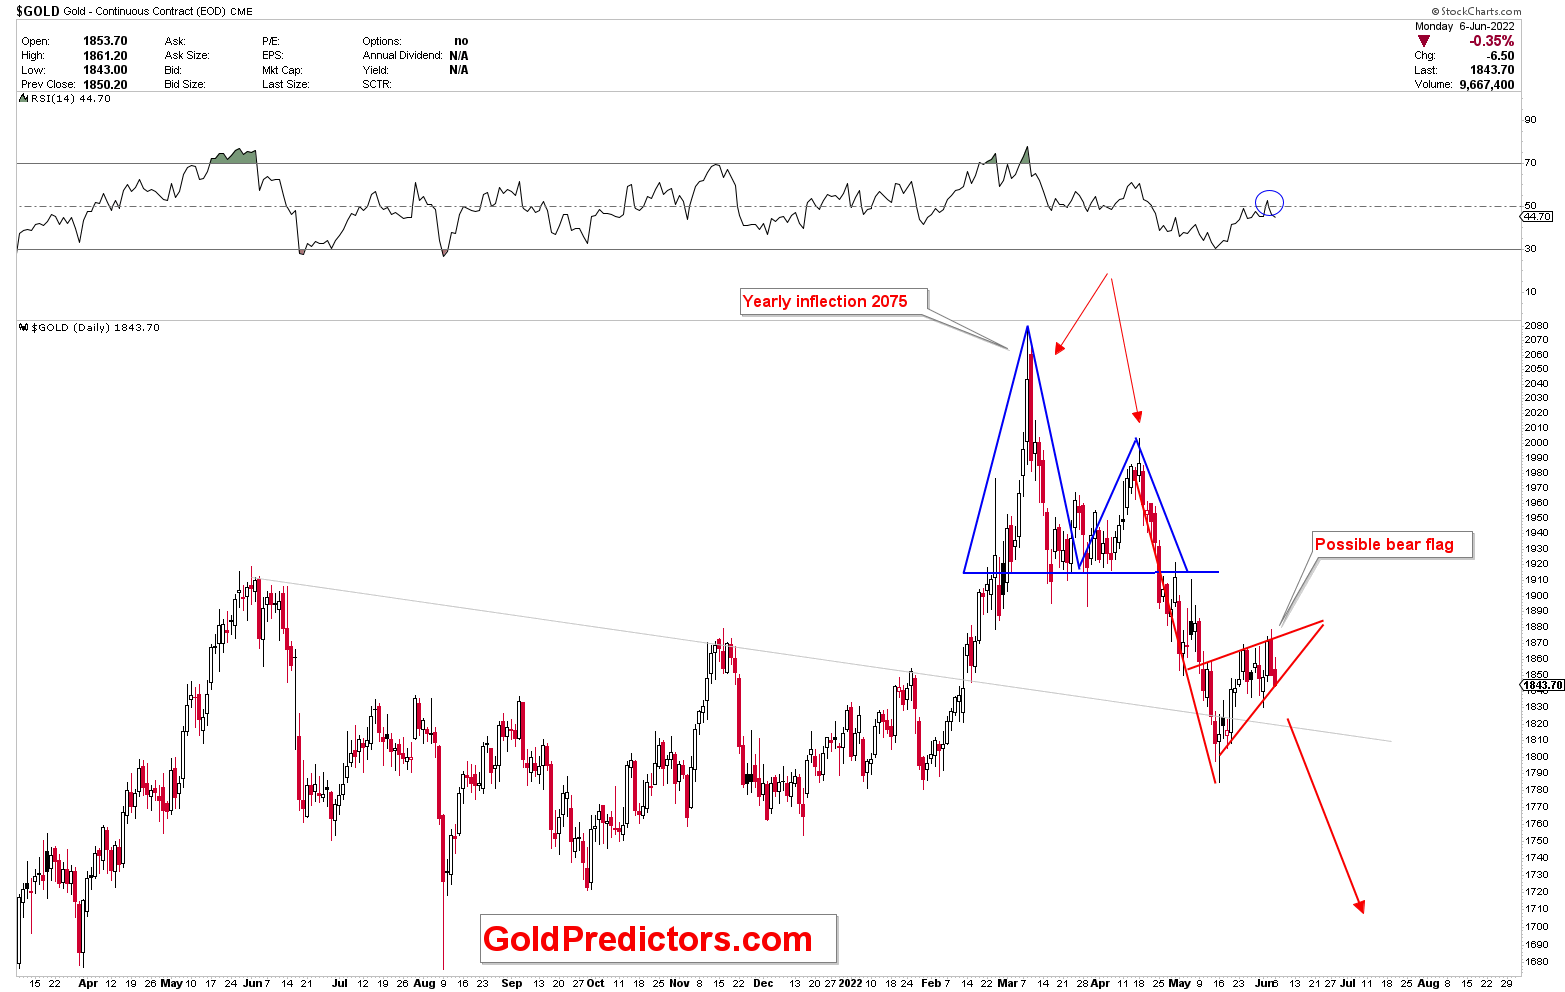
We identified the development of Adam and Eve at the $2,075 yearly pivot with the development of the bear flag on June 6. This bear flag was expected to break down to lower levels of $1,725 and $1,680. The old chart is shown below.
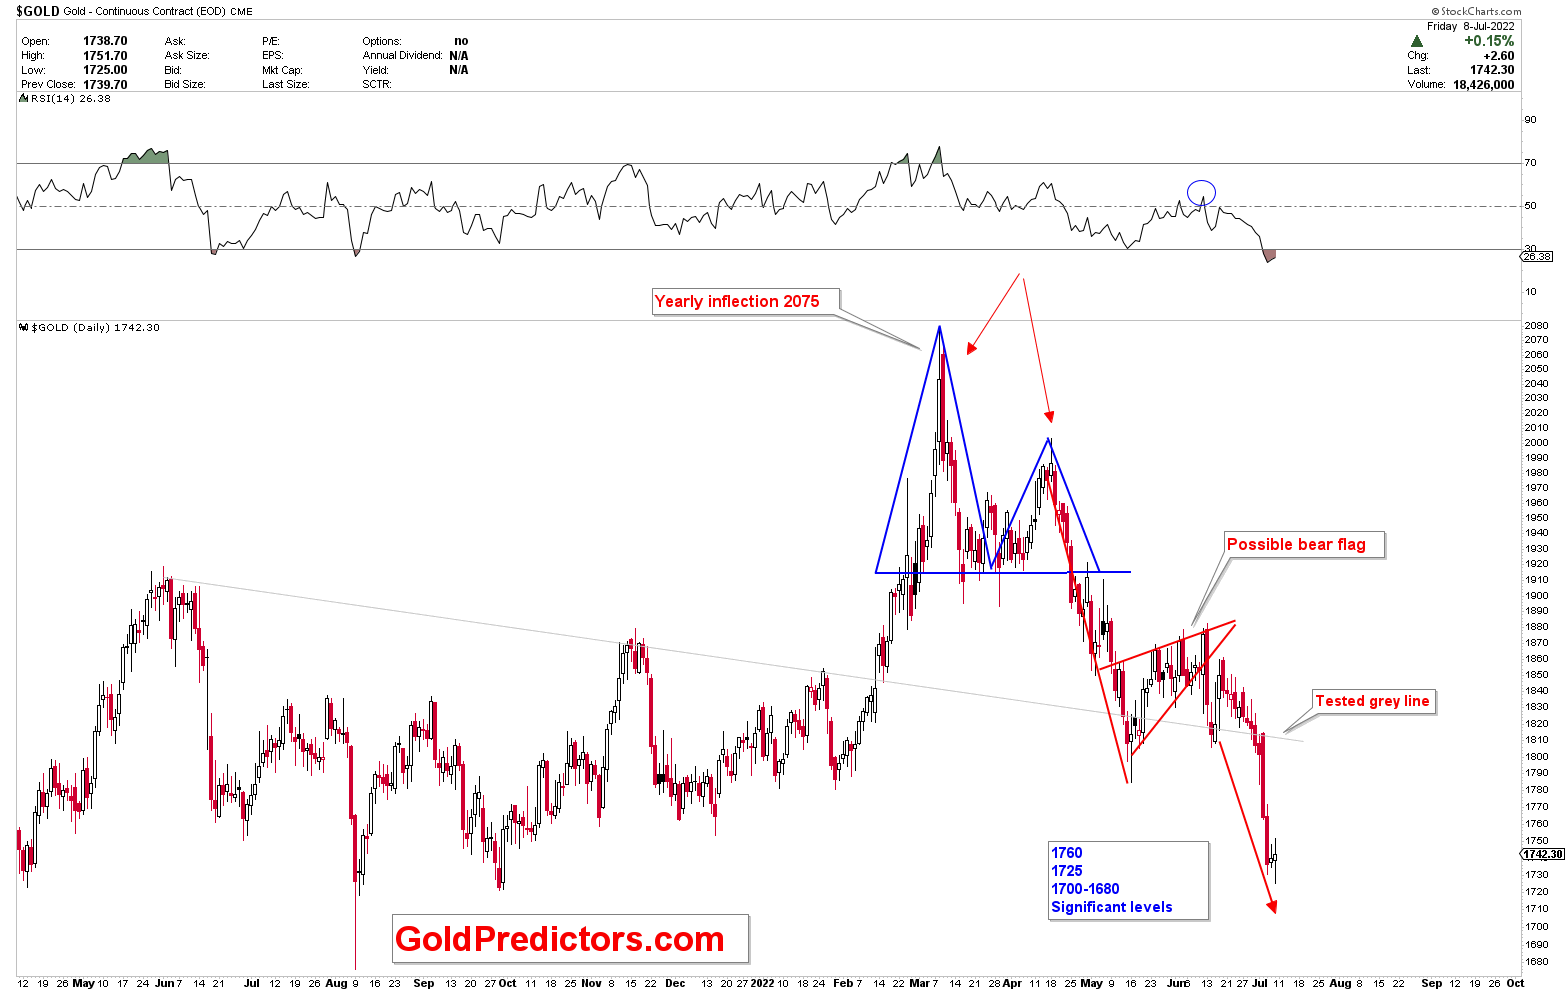
The price has acted exactly as expected and has broken down from the bear flag. The chart has been updated, and price is now sitting on the major targets of this bear flag. Expect a strong recovery in the $1,725 and $1,680 regions. The next course of action for the gold price will be determined by the rate of acceleration of the rebound from $1,680-$1,725.
Short Term Cycles
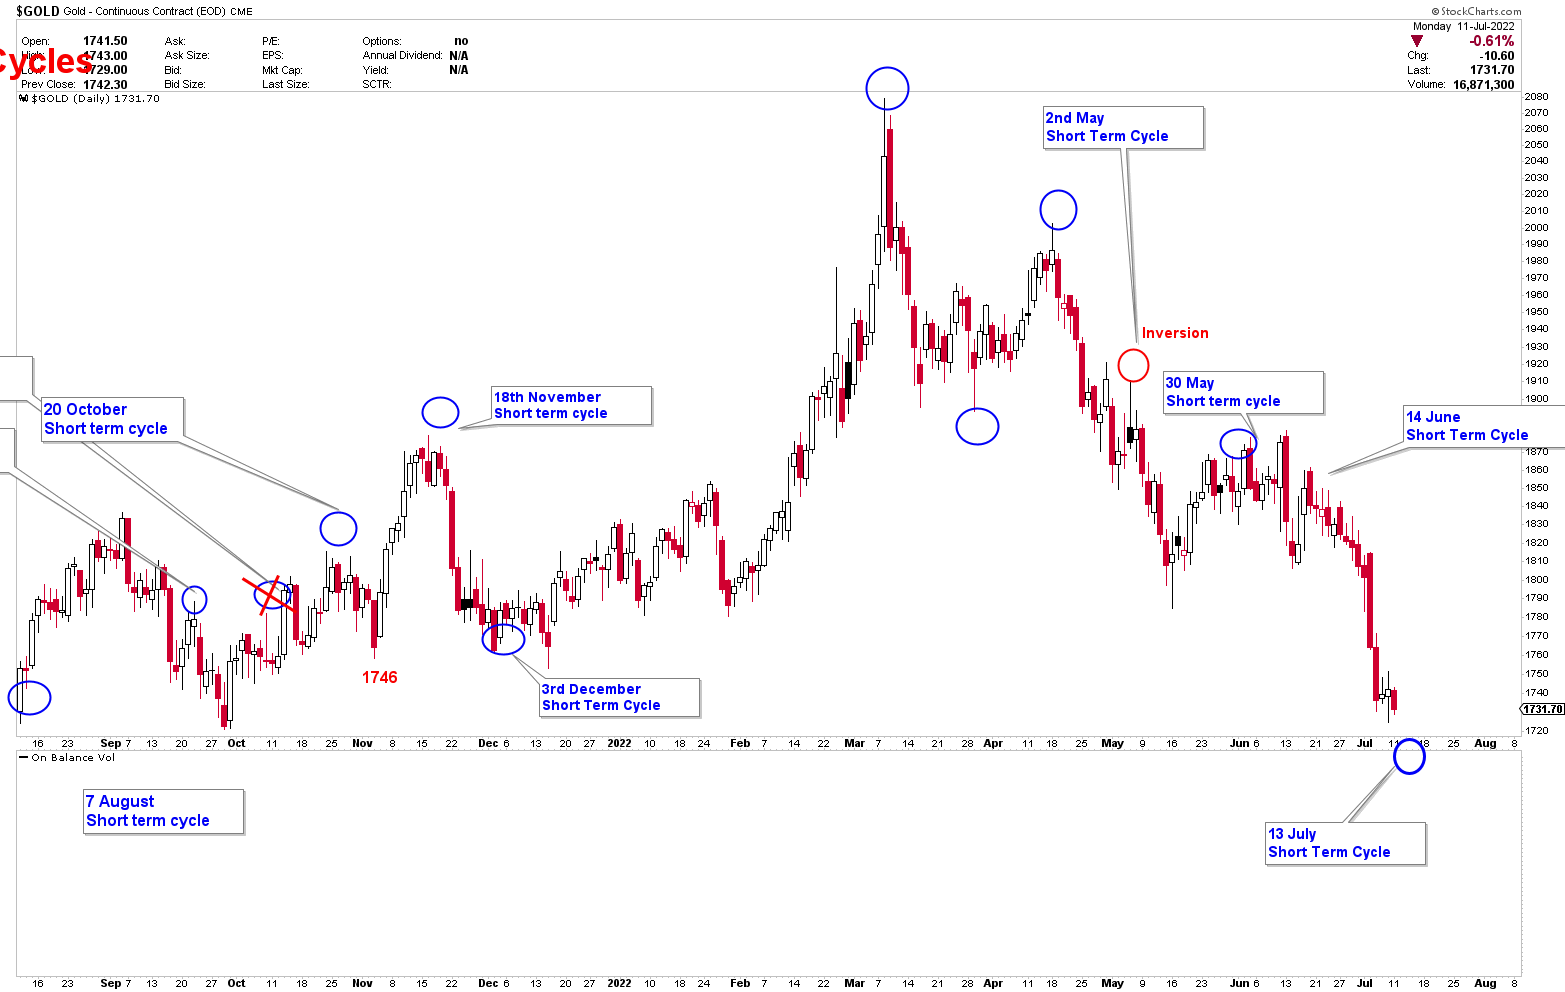
Short term cycles occur every 15-28 days and are useful for predicting a short term top or bottom in gold prices. The previous short term cycle on June 14th indicated lower prices, and the next short term cycle is expected to bottom on July 13th. Because short term cycles have a few hours of deviation, price may behave abnormally during this time period before confirming the next course of action. If the price continues to fall towards $1,700 and $1,680 by Thursday, it will create a good buying opportunity in terms of short-term cycles. If prices rise above $1,750 before July 14th, they may form a top rather than a bottom. The short-term development of price patterns will determine the next course of action, and we will update if we see any trading opportunities.
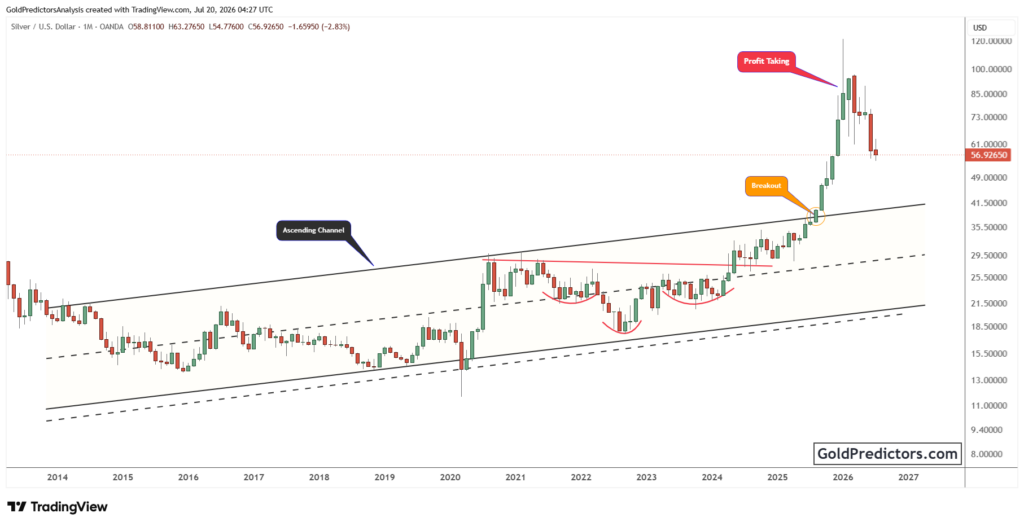
Silver Long-Term Outlook
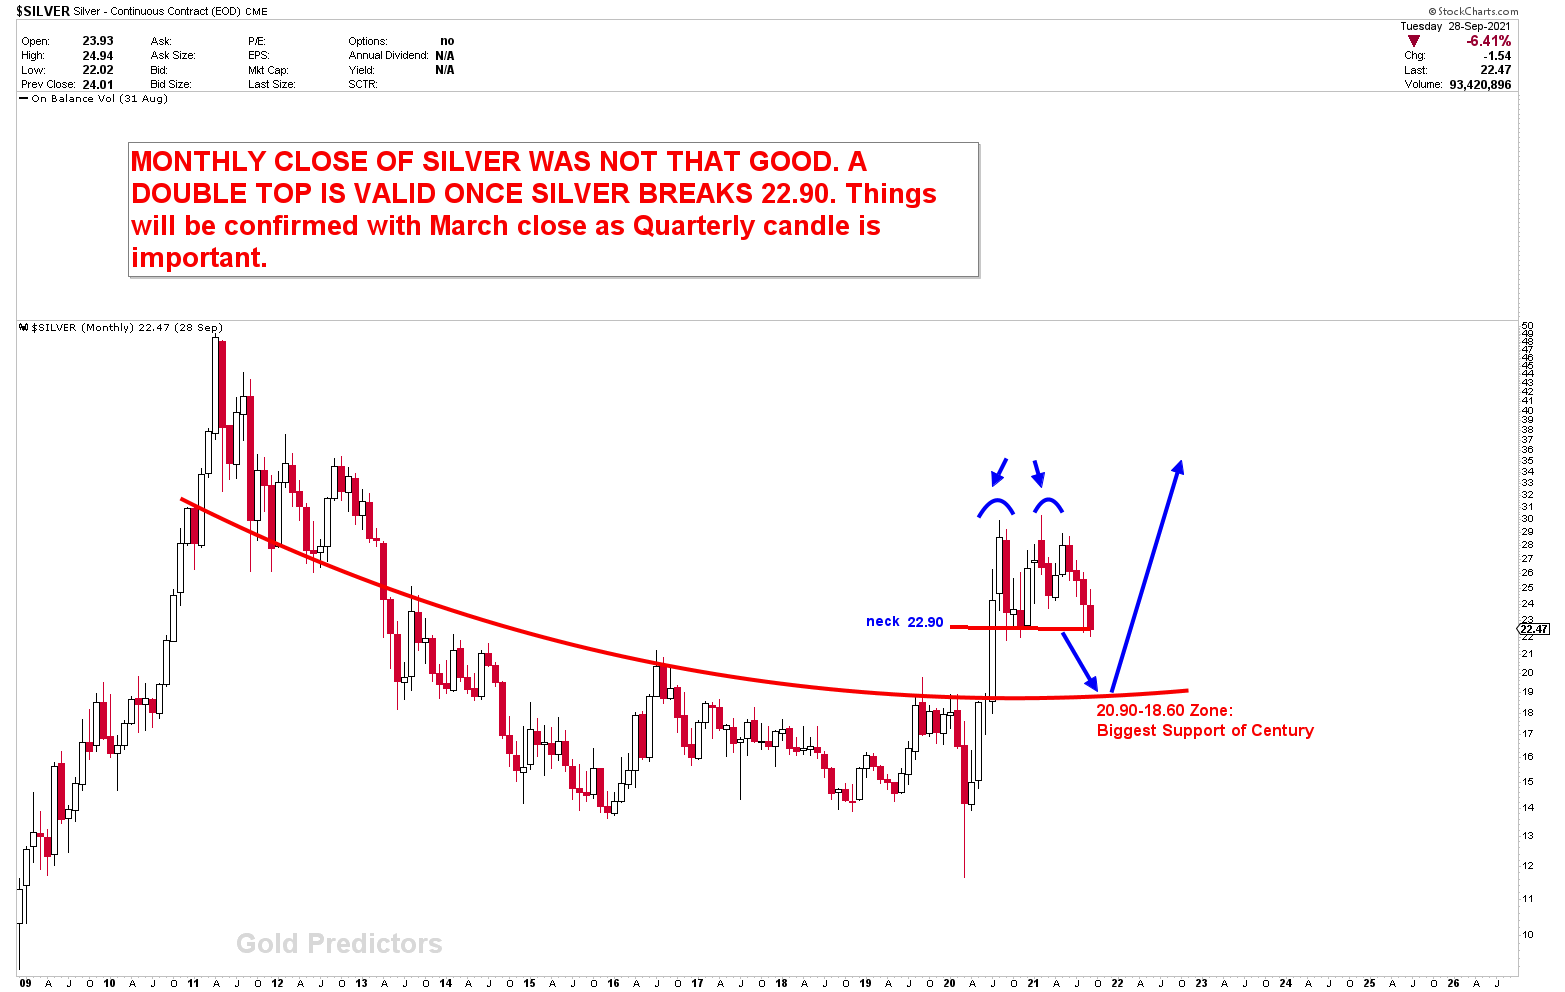
According to data analysis, silver outperforms gold during bull market phases but lags gold during bear or sideways market phases. We were very bullish on silver in 2020, but when prices rejected the 25 level, we changed our silver outlook to bearish with the formation of a double top in March 2021. The old chart is shown below.
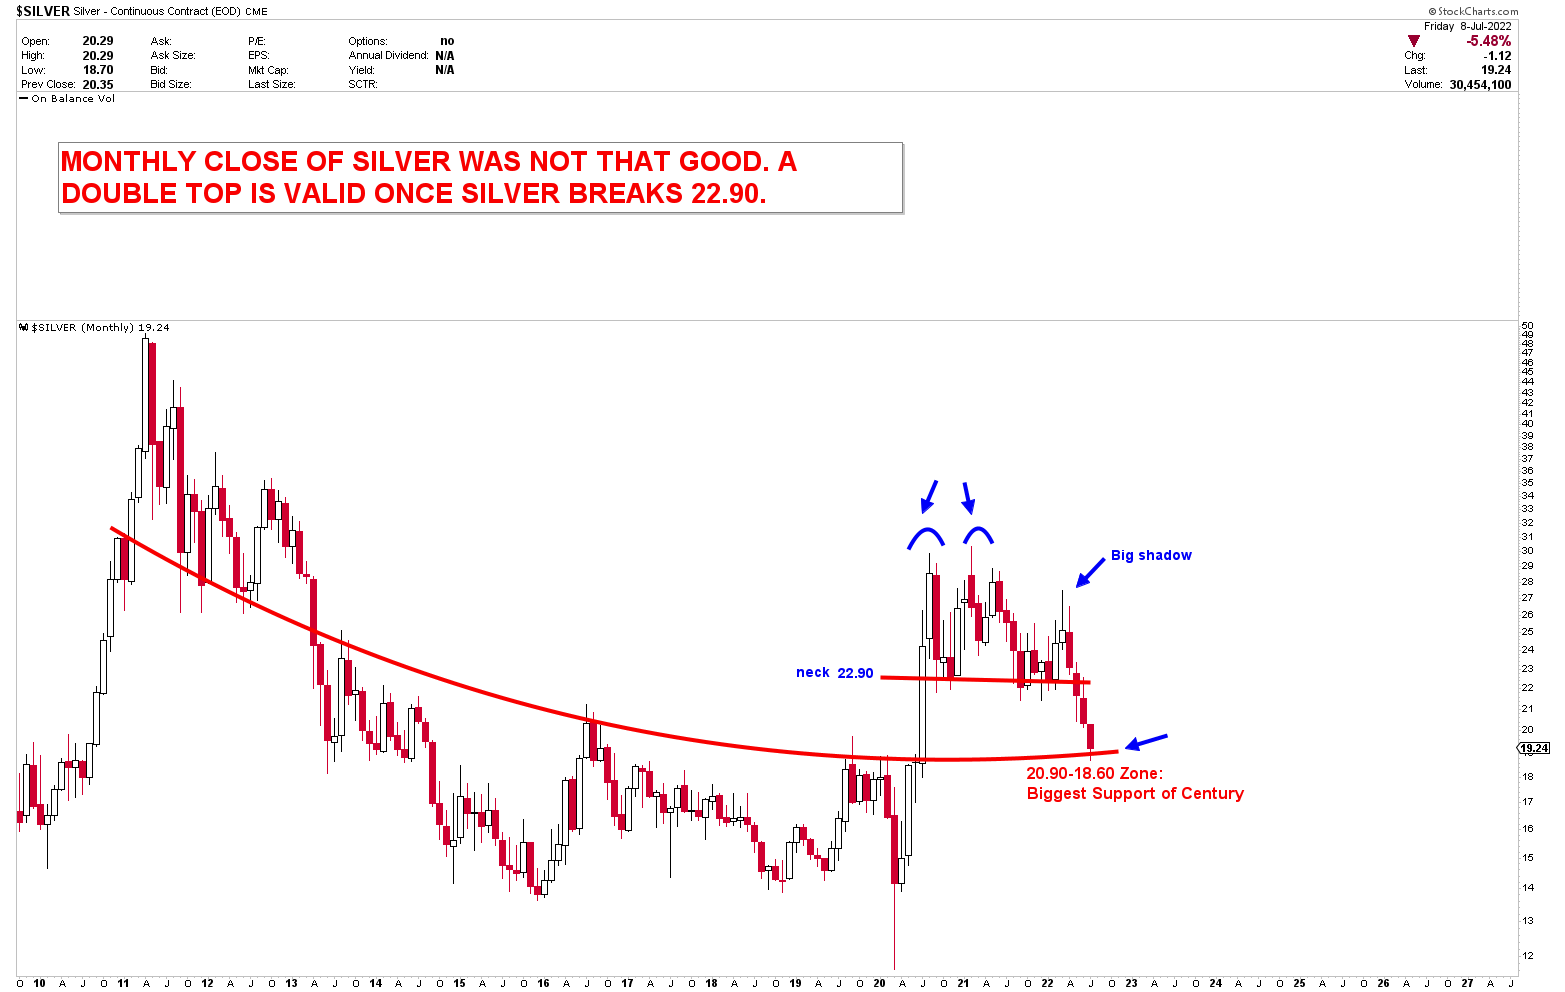
Silver prices have behaved as predicted and are now approaching our major support level of 18.70. The updated chart is shown below.
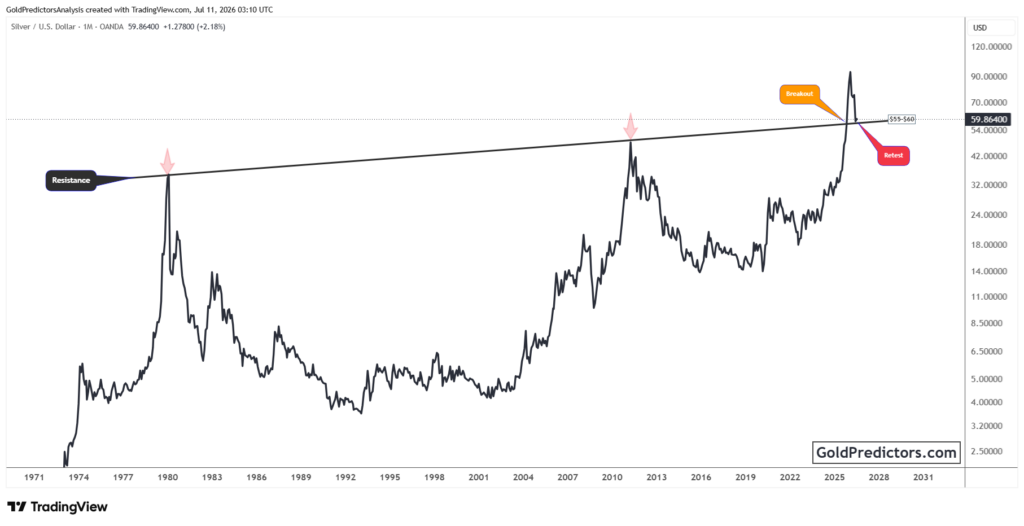
Silver Levels
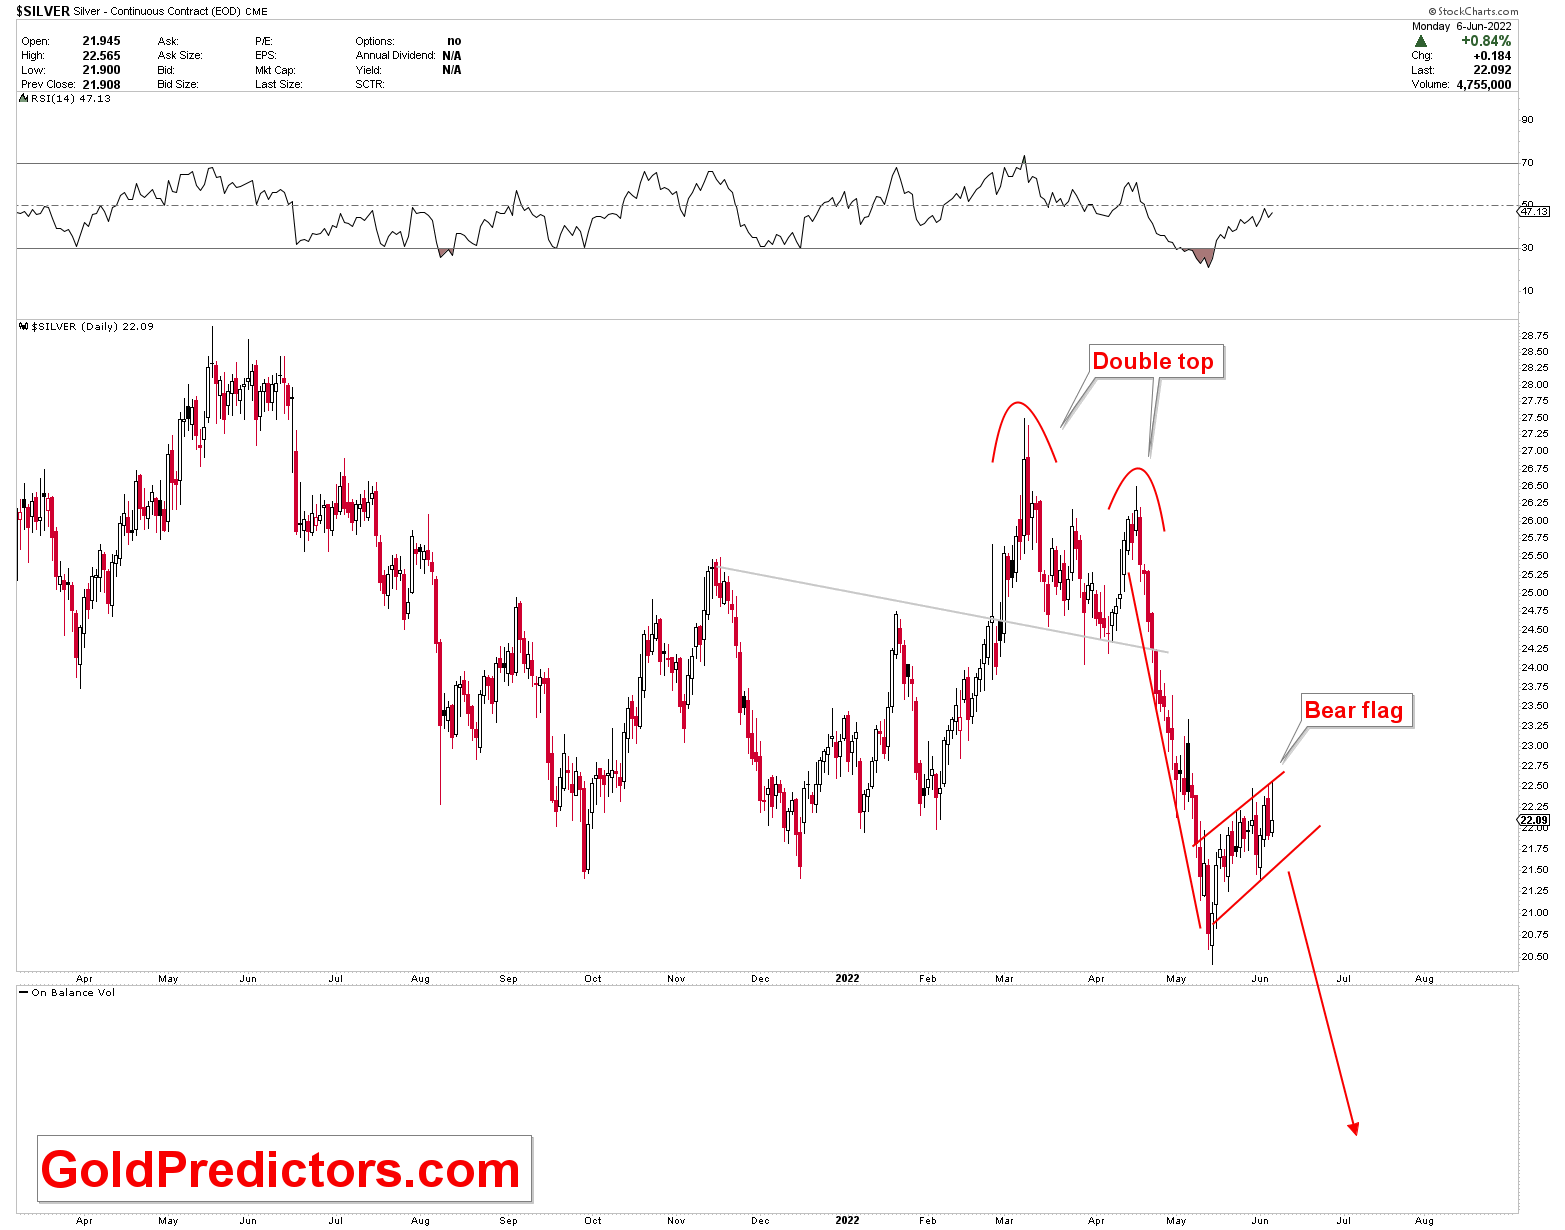
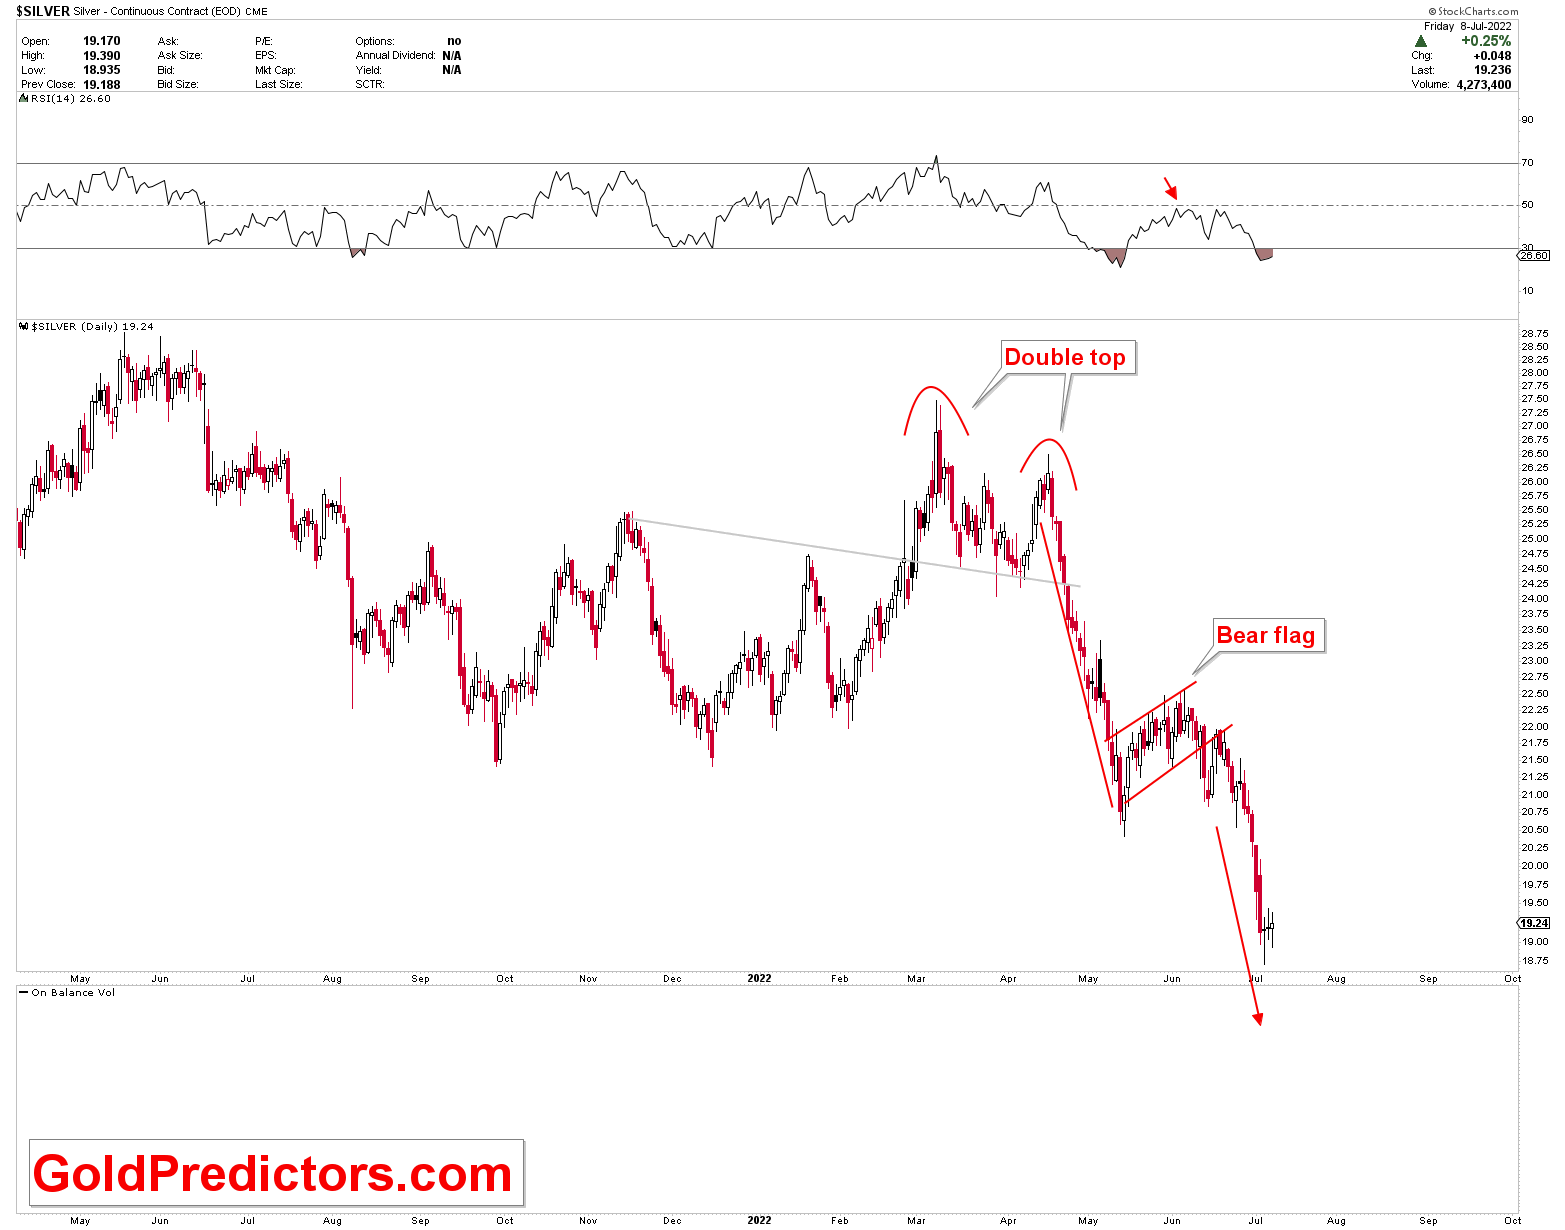
The proposed bear flag in silver prices performed as expected, and prices are not approaching the bear flag’s target. The old silver chart which was developed to point out the next silver direction is shown below.
The formation of a double top and the initiation of a bear flag triggered this drop, and the price is now approaching major long-term support at $18.70. Since this is a long-term support, the deviations are 50 cents on each side of the pivot. A monthly close below $18.70 is unexpected and will call the medium-term bullish scenario into question. Silver will begin to lead gold once gold has confirmed a bottom.
Conclusion
Due to the obvious recent rapid expansion of the money supply, long-term inflation is difficult to control. Individuals and central banks are also expected to increase their long-term investments. The weaponization of the Western financial system in sanctions against Russia is likely to result in central banks shifting away from a dollar-based reserve currency in the long run. There is no ready replacement for a reserve currency. Whatever the outcome, gold will almost certainly play a larger role in central banks’ foreign reserve holdings. However, the recent drop in gold prices was not unexpected, as we had clearly stated the possibility of a decline a few months ago as we approached the yearly inflection point. The technical issue with gold charts is that a monthly break of $1,680 will confirm the development of bearish patterns, implying a massive drop in the coming months. This drop, on the other hand, will be regarded as a good opportunity for medium- and long-term investors and traders. For the time being, keep an eye on the 1725-1680 range as a strong technical support in the gold market.