Gold dance below $1,975 | Gold Predictors - Forecasting Gold Prices

New York

London

Sydney

Tokyo

Log In

  • Register
  • Lost your password?
gold predictorsgold predictorsgold predictorsgold predictors
  • HOME
  • ABOUT US
    • About Us
    • Social Networks
    • Industry Links
    • Testimonials
    • News & Updates
  • RESEARCH
    • Scientific Trade Strategies
    • Gold Hub
    • Gold Importance
    • Silver Importance
  • GOLD HUB
  • GOLD ANALYSIS
    • Gold Analysis
    • Technical Analysis
      • Trend Identification
      • Phase Identification
      • Important Levels
      • Volatility Measurement
    • Gold Cycle
      • Short Term Cycles
      • Medium Term Cycles
      • Long Term Cycles
    • Price Action Analysis
      • Phase Identification
      • Historical Pattern Identification
      • Candlestick Pattern Identification
    • Fundamental Analysis of Gold
    • Gold Related Markets Analysis
    • Gold Seasonal
  • TRADING METHODOLOGY
    • Gold Analysis
      • Technical Analysis
      • Gold Cycle
      • Price Action Strategy
      • Fundamental Analysis
      • Gold Related Markets Analysis
      • Gold Seasonal
    • Measure Signal Strength
      • Weak Signal
      • Strong Signal
      • Confirmed Signal
    • Trading Decision
    • Trading Rules
      • Basic Trading Rules
      • Gold Predictors Trading Rules
    • Trade Examples
    • Performance
  • LIVE CHARTS
  • MEMBERSHIPS
    • Free Membership
    • Premium Membership
    • SignUp
  • MEMBERS AREA
    • Free Article
    • Premium Article
    • Trading Signals
    • Long Term Signals
    • Forex Reports
    • Crypto Reports
  • FOREX REPORTS
  • HELP
    • FAQ
    • Contact Us
Login / Register

Gold dance below $1,975

0
Published by admin at April 20, 2022
Categories
  • Premium Articles
Tags

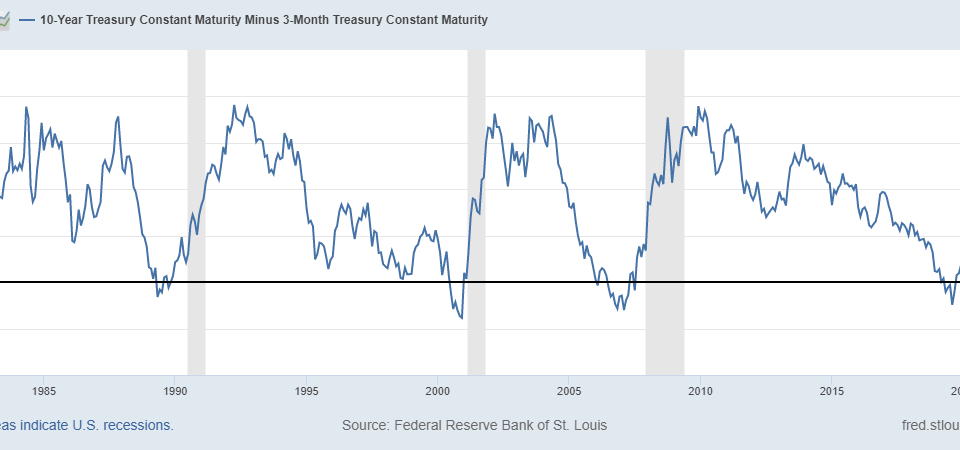
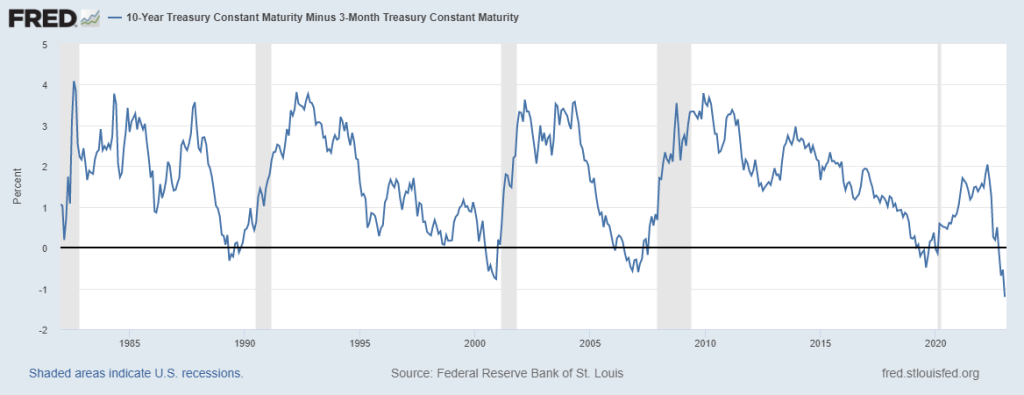
The value of precious metals is declining as a result of the current risk-on market environment. Following a drop in the US Treasuries yields from a three-year high, the US Dollar Index retraced from 101.04 to 100.28, indicating the greenback’s vulnerability. Treasury Inflation-Protected Securities (TIPS) 10-year rates reverted to negative territory after a four-basis-point increase. These factors kept gold prices from falling lower, and technical charts also supported the bullish stance.

While all of this was going on, the Federal Reserve was still speaking on Wednesday. Inflation will not return to 2% until 2023, according to Fed President Charles Evans. In addition to his comments on Tuesday, he rejected a 75 basis point increase recommended by St. Louis Fed President Bullard. Aside from that, the conflict between Russia and Ukraine continues to dominate the headlines. While NATO countries, led by the United States, continue to transfer weapons to Ukraine.

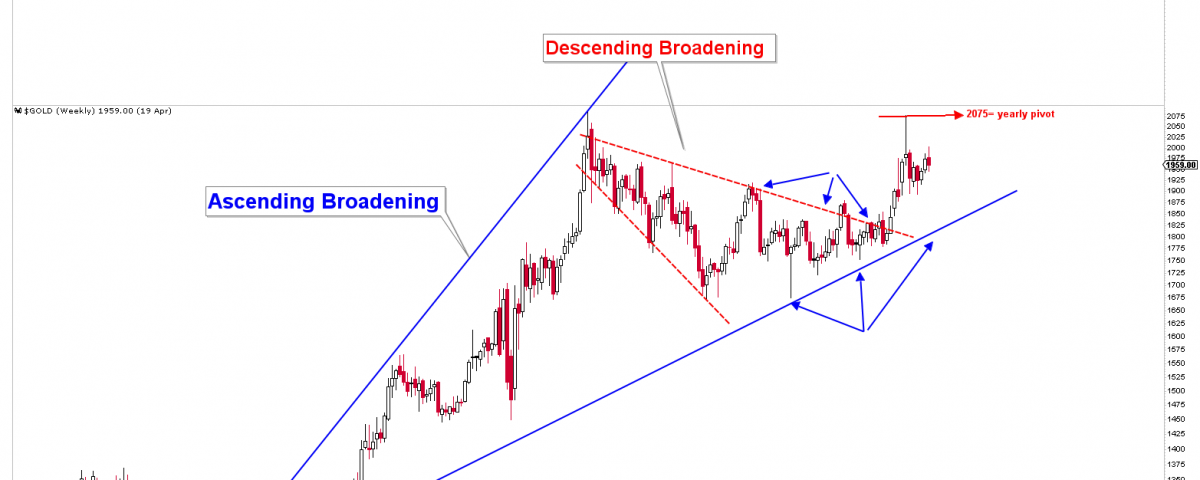
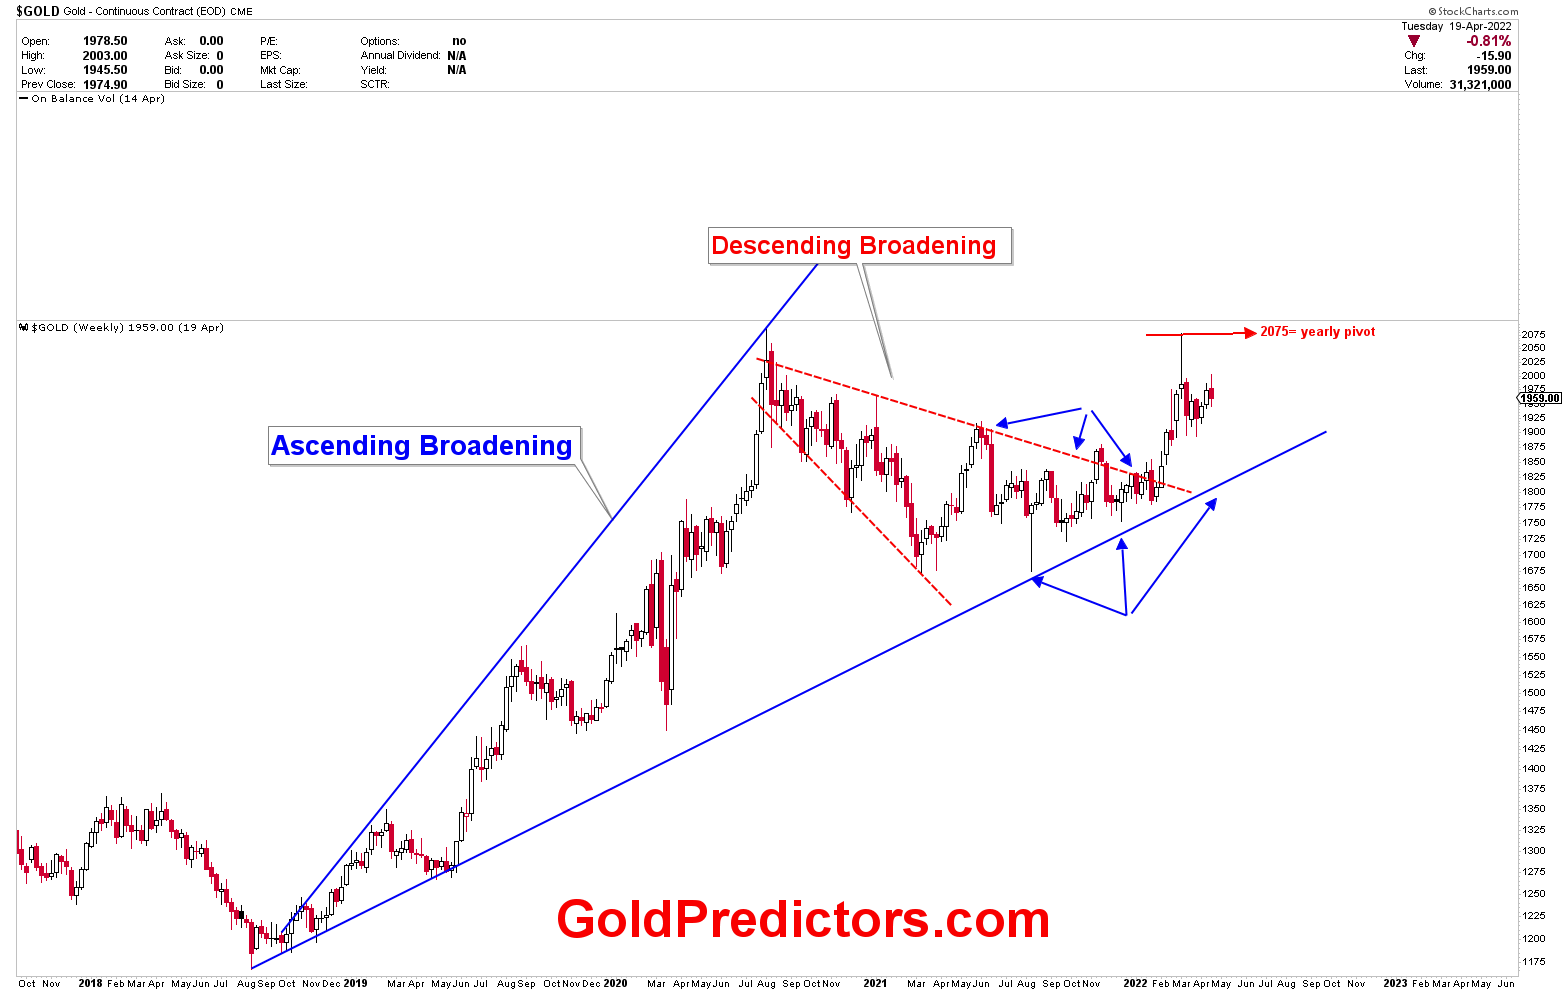
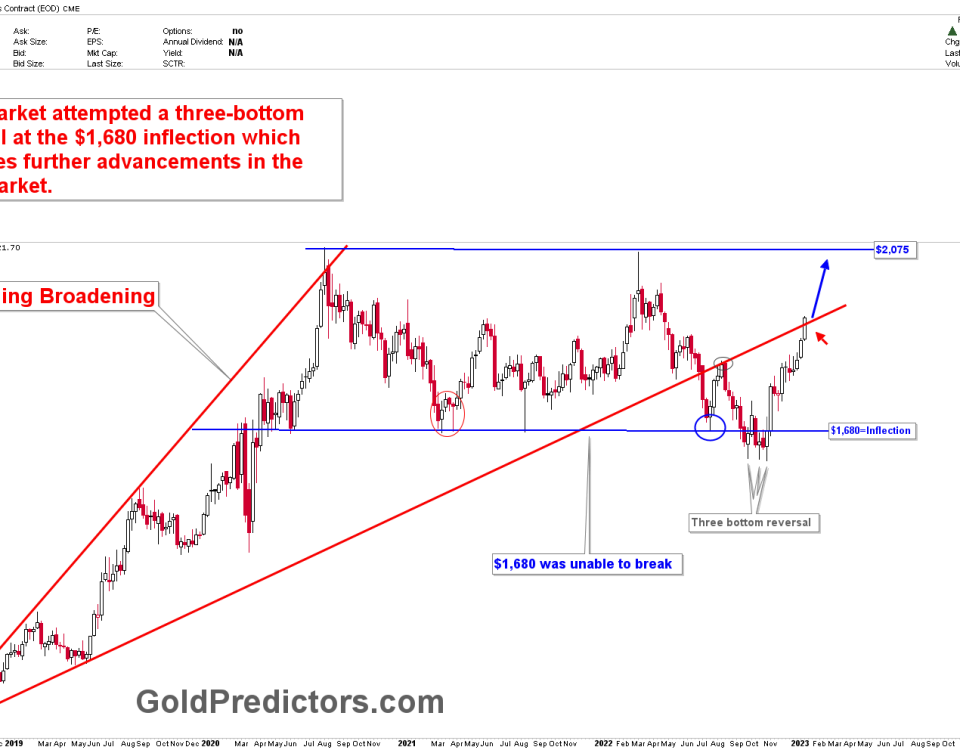
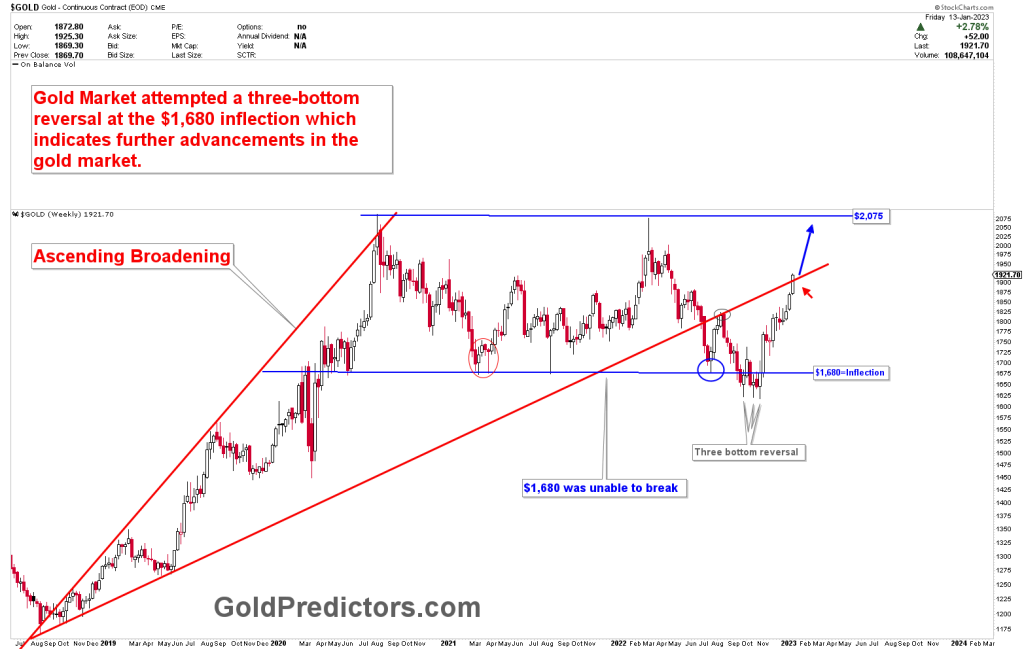
Gold prices are supported by ascending broadening patterns and are expected to rise to the $2,075 yearly pivot. Prices fell below $1,920 as a result of the strong yearly resistance, and the price has fluctuated below the $1,975 resistance. The patterns indicate the formation of descending broadening, which is usually a bullish pattern, and a breakout indicates that gold must continue to trade higher. However, to accelerate to the next level, the strong pivot of $2,075 must be broken on a monthly closing basis. As previously discussed, prices are likely to be in a wide range between $2,075 and $1,920. On the other hand, our mentioned strong level of $25.75 was a fake-out, and silver is now back below this level, causing silver to consolidate gains. The precious metals consolidations will ignite the next big rally. If gold breaks the highs, the next rally might be very strong.

Gold dance below $1,975

Please login to read full article!

Please subscribe to the link below to receive free updates.

Free Membership

This content is locked

Login To Unlock The Content!

Username:
Password:

Related posts

January 29, 2023

Premium Updates Are Mostly Delivered Using Emails


Read more
recession
January 28, 2023

Gold – A Recession Warning


Read more
gold ascending broadening
January 15, 2023

Gold: Bullish Short-Term Structure


Read more

Comments are closed.

ABOUT US

  • About Us
  • Social Networks
  • Industry Links
  • Testimonials
  • Terms & Conditions

TECHNICAL ANALYSIS

  • Technical Analysis
  • Trend Identification
  • Phase Identification
  • Important Levels
  • Volatility Measurement

CYCLE ANALYSIS

  • Gold Cycle
  • Short Term Cycles
  • Medium Term Cycles
  • Long Term Cycles

PRICE ACTION ANALYSIS

  • Price Action Analysis
  • Phase Identification
  • Historical Pattern Identification
  • Candlestick Pattern Identification
© 2017 Gold Predictors. All Rights Reserved.
  • Remember Me
    Lost your password?
    Dont have an account?Sign Up