Gold Bottom At Inflection Point | Gold Predictors - Forecasting Gold Prices

New York

London

Sydney

Tokyo

Log In

  • Register
  • Lost your password?
gold predictorsgold predictorsgold predictorsgold predictors
  • HOME
  • ABOUT US
    • About Us
    • Social Networks
    • Industry Links
    • Testimonials
  • RESEARCH
    • Scientific Trade Strategies
    • Gold Hub
    • Gold Importance
    • Silver Importance
  • GOLD HUB
  • GOLD ANALYSIS
    • Gold Analysis
    • Technical Analysis
      • Trend Identification
      • Phase Identification
      • Important Levels
      • Volatility Measurement
    • Gold Cycle
      • Short Term Cycles
      • Medium Term Cycles
      • Long Term Cycles
    • Price Action Analysis
      • Phase Identification
      • Historical Pattern Identification
      • Candlestick Pattern Identification
    • Fundamental Analysis of Gold
    • Gold Related Markets Analysis
    • Gold Seasonal
  • TRADING METHODOLOGY
    • Gold Analysis
      • Technical Analysis
      • Gold Cycle
      • Price Action Strategy
      • Fundamental Analysis
      • Gold Related Markets Analysis
      • Gold Seasonal
    • Measure Signal Strength
      • Weak Signal
      • Strong Signal
      • Confirmed Signal
    • Trading Decision
    • Trading Rules
      • Basic Trading Rules
      • Gold Predictors Trading Rules
    • Trade Examples
    • Performance
  • LIVE CHARTS
  • MEMBERSHIPS
    • Free Membership
    • Premium Membership
    • SignUp
  • MEMBERS AREA
    • Free Article
    • Premium Article
    • Trading Signals
    • Long Term Signals
    • Forex Reports
    • Crypto Reports
  • FOREX REPORTS
  • HELP
    • FAQ
    • Contact Us
Login / Register

Gold Bottom At Inflection Point

0
Published by admin at August 16, 2021
Categories
  • Free Articles
Tags

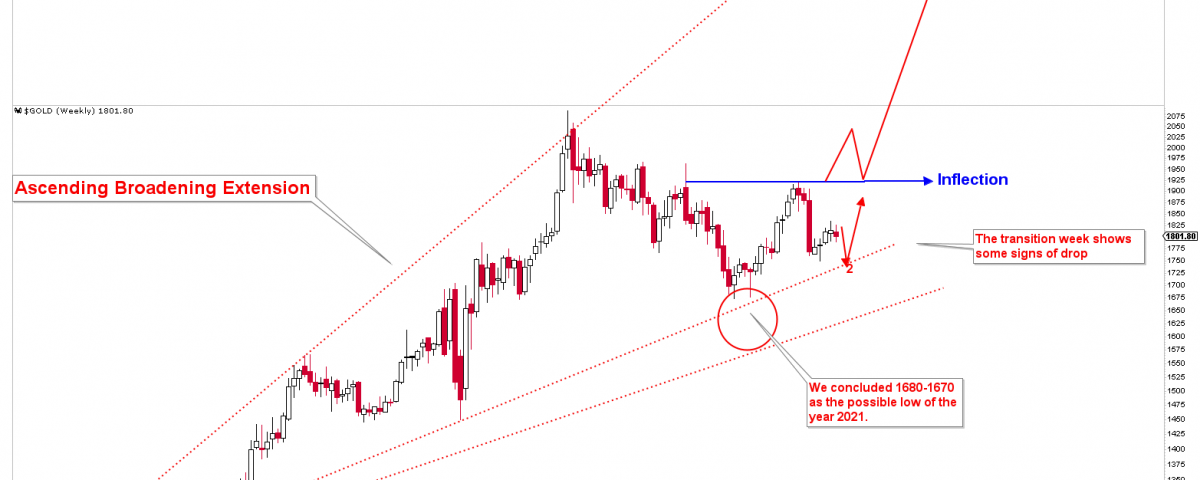
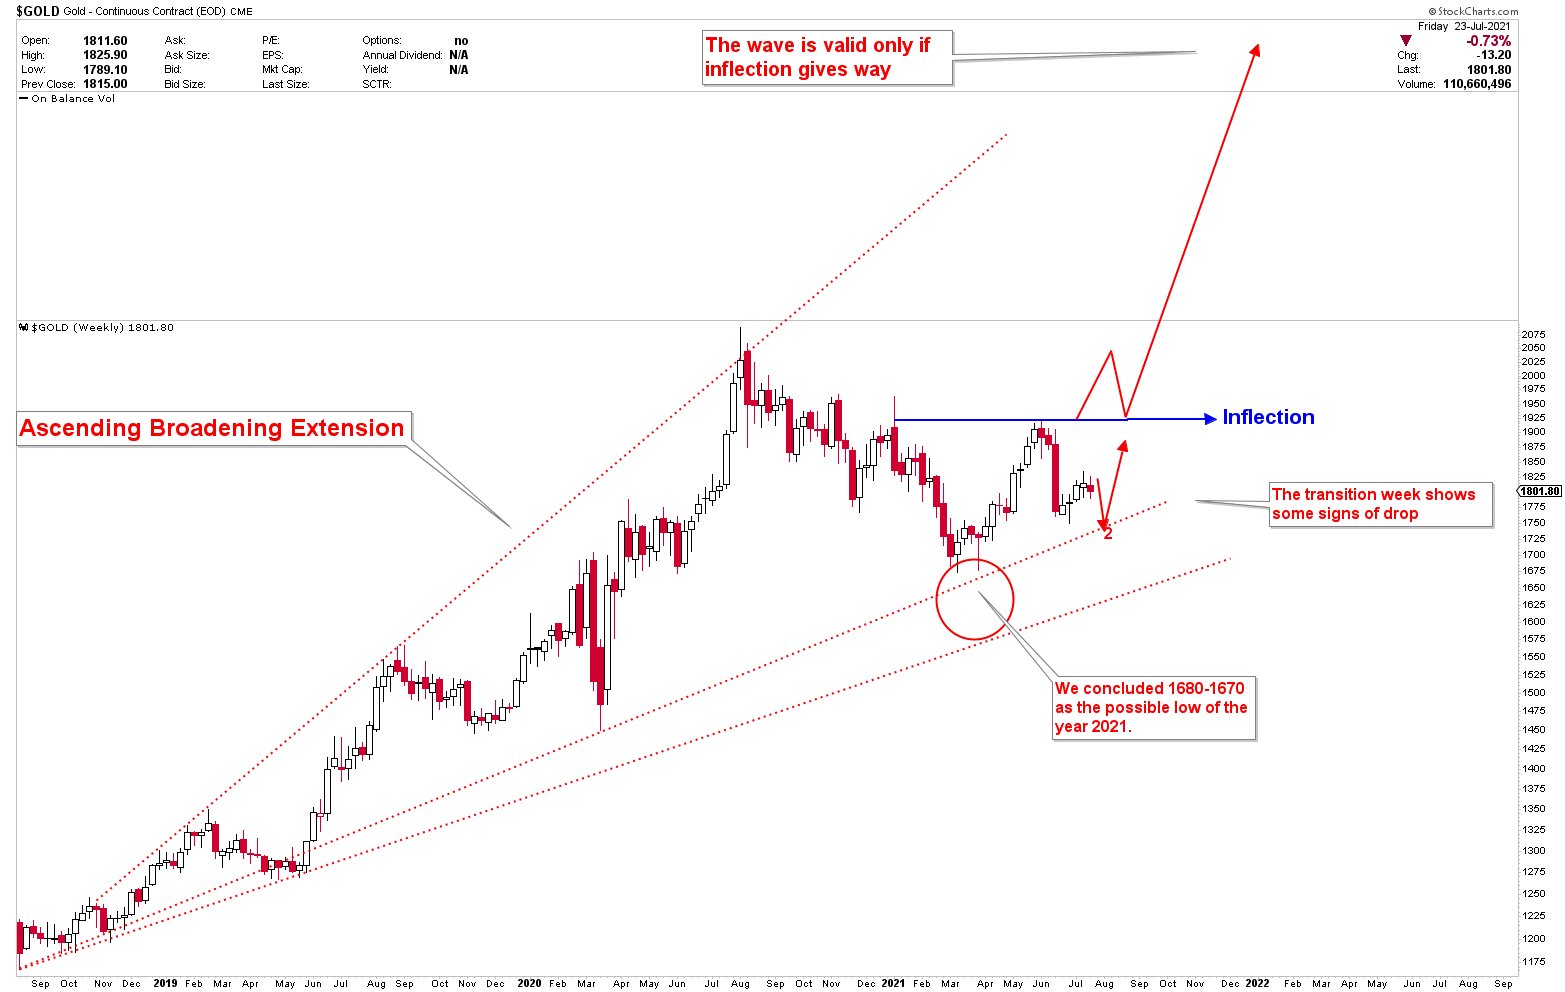
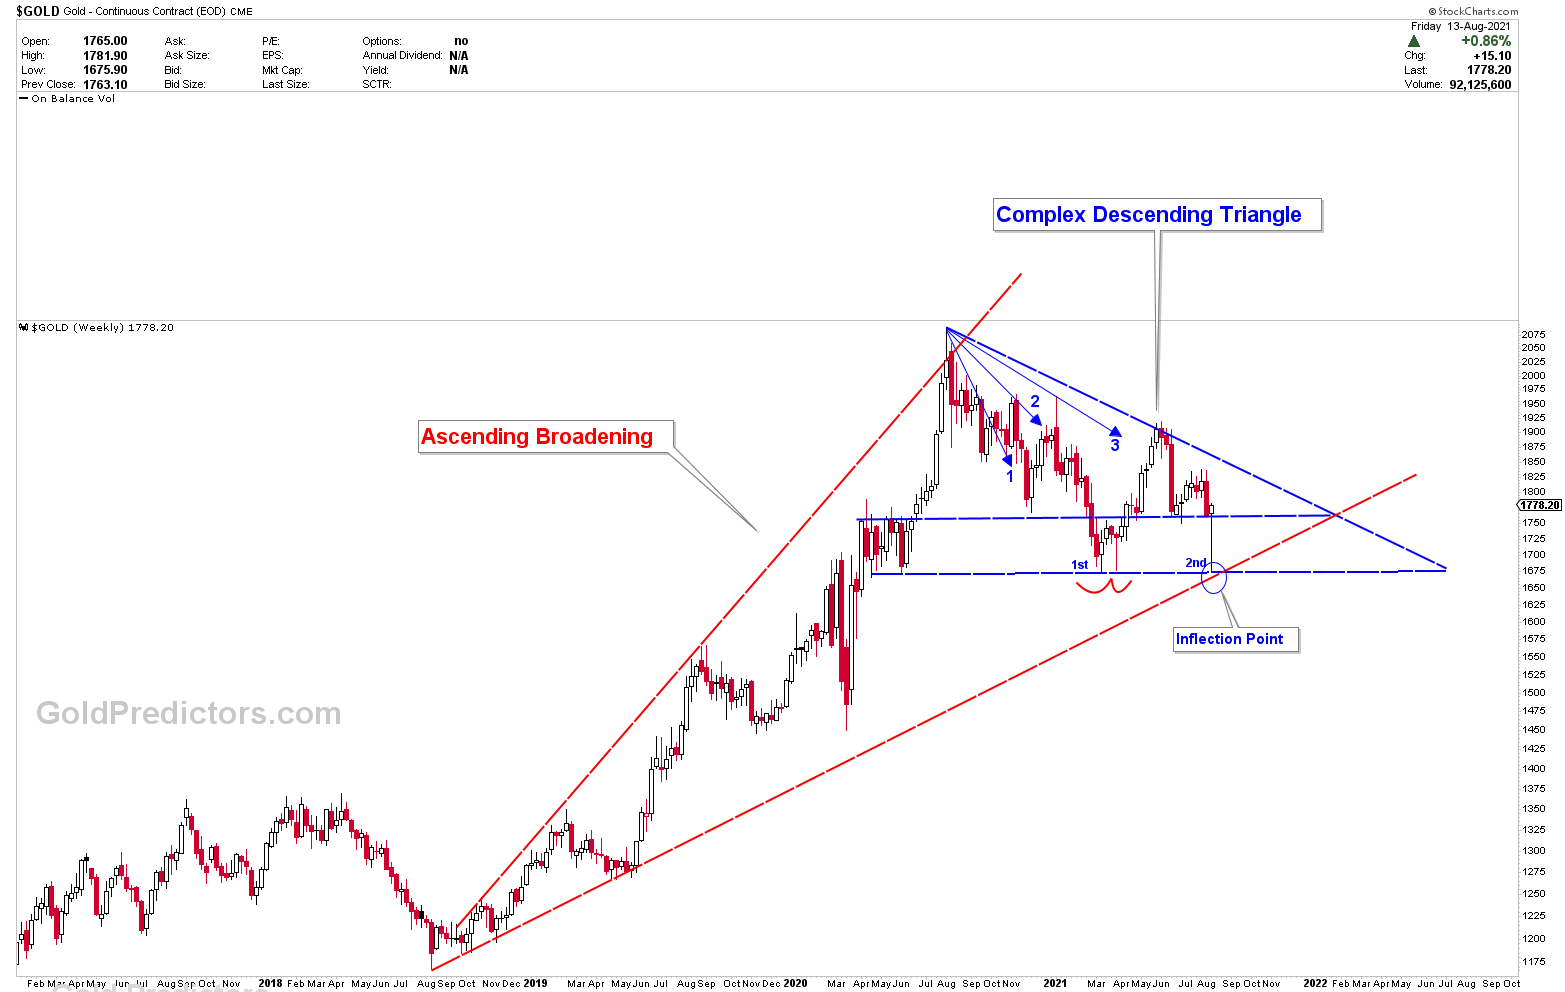
Last week, gold bottom at inflection point of 1680, resulting in a strong reversal weekly candle. Whatever the circumstances, we made it clear to premium members that we expect higher gold and silver prices. It was mentioned that the price drop on Monday was merely a bear trap. We stated clearly three weeks ago that gold prices are likely to fall from 1835 before rising significantly. Prices began to fall exactly in 1835. When prices were trading at 1680, we publicly stated that gold is unlikely to breach 1680. And how important is 1680 number in terms of our historical chart analysis.
The chart shows how we presented a leg down in gold from 1835 to lower levels, followed by higher prices. The chart was developed on 23rd July 2021.

gold bottom

Gold price is operating in line with our expectations. Since prices closed above 1760, prices are likely to trade sideways to higher in the coming days. Since the volatility is extremely high at the moment, only a few of the levels indicate that the bounce could be a dead cat bounce. These levels and scenarios will be discussed in detail in the premium article tomorrow. A gold bear trap produced one of the biggest historical weekly candles in gold weekly charts.

Did Gold Really Bottom?

There are two possible scenarios for understanding this type of heavy move that happened last week. Prices fell in a matter of minutes and recovered 100% of the drop by the end of the week. These details will be discussed in premium article tomorrow.

gold bottom

Silver has two levels of support, as previously stated on twitter. The first is 23.01, and the second is 20.80 for silver to bottom on a long-term basis. Silver dropped to 22.98 on Friday, just 3 cents below our target, and then shot higher after forming an inverted head and shoulder bottom on hourly charts. This type of development also indicates two possible scenarios in terms of long term development. These scenarios will be discussed in detail in a premium article tomorrow.

Gold Trade Entry

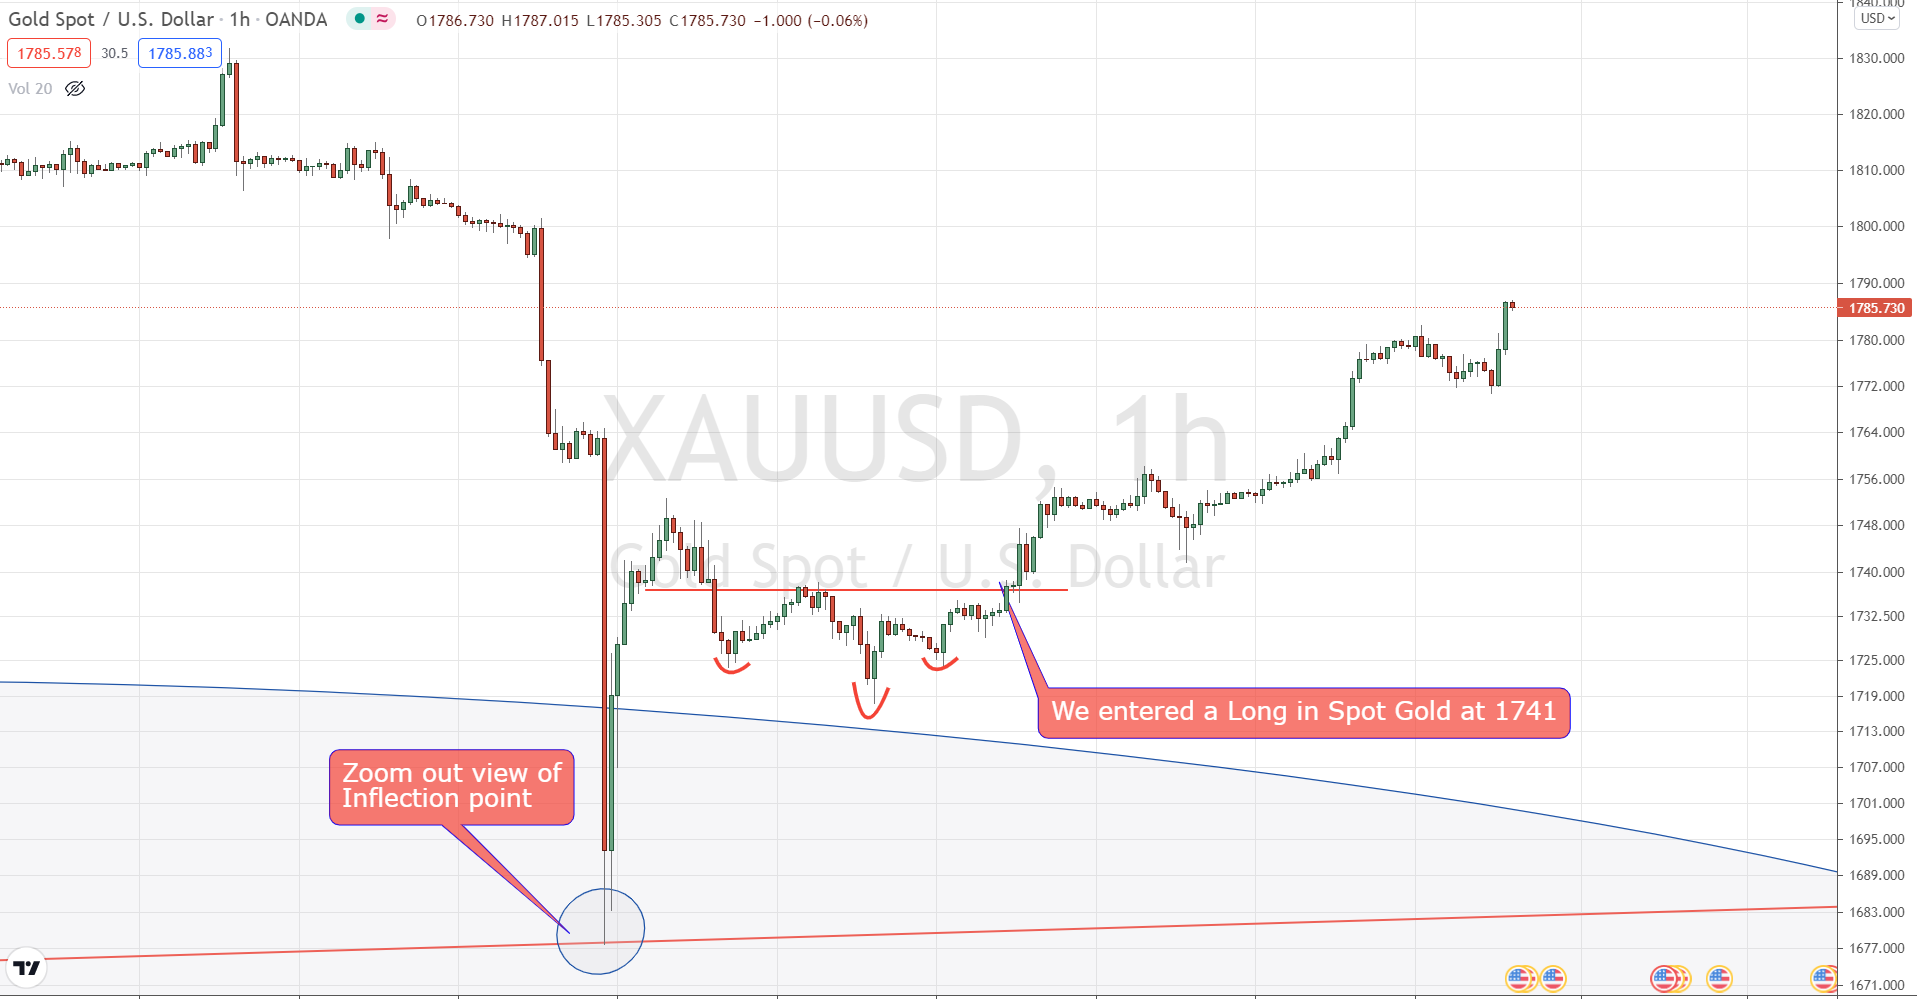
Our trade entry for premium members which went long at 1741 by following the CUP type of bottom on short term charts. The trading positions will be kept open since gold has to decide this week for the possible targets.

gold bottom

To Receive Free Updates Please Register As A Free Member

Free Membership

Related posts

silver pattern
May 9, 2025

Silver Bullish Patterns Signal Move Toward $50


Read more
gold pattern
May 8, 2025

Gold Breaks Multi-Decade Resistance as Gold/Silver Ratio Nears Historic Turning Point


Read more
gold pattern
May 7, 2025

Gold Price Breakout 2025: Long-Term Patterns Point to $4,000 and Beyond


Read more

Comments are closed.

ABOUT US

  • About Us
  • Social Networks
  • Industry Links
  • Testimonials
  • Terms & Conditions

TECHNICAL ANALYSIS

  • Technical Analysis
  • Trend Identification
  • Phase Identification
  • Important Levels
  • Volatility Measurement

CYCLE ANALYSIS

  • Gold Cycle
  • Short Term Cycles
  • Medium Term Cycles
  • Long Term Cycles

PRICE ACTION ANALYSIS

  • Price Action Analysis
  • Phase Identification
  • Historical Pattern Identification
  • Candlestick Pattern Identification
© 2017 Gold Predictors. All Rights Reserved.
  • Remember Me
    Lost your password?
    Dont have an account?Sign Up