


Gold’s Bullish Technical Outlook Persists Despite Economic Slowdown Indicators
United States economy showed signs of slowing momentum in April 2024. The employment data for April was less robust than expected, with only 175,000 jobs added, marking the smallest increase since October last year. This growth fell below consensus expectations and was accompanied by a rising unemployment rate to 3.9%. This combination suggests a potential cooling in the labor market. Further complicating the economic landscape is the Employment Cost Index, which accelerated unexpectedly. This indicates that wages and salaries might rise faster than predicted. This development suggests that inflation may not be subsiding. Therefore, it could lead the Federal Open Market Committee (FOMC) to maintain current monetary policies without immediate changes. This hold may influence various sectors of the economy including gold. However the long term technical outlook of gold market remains strongly bullish.
The financial conditions and consumer sentiment indicators, due next week, will provide additional clues about the economic trajectory. As investors and policymakers digest these details, monitoring the impact on the gold market will be critical.
A Long-Term Gold Bullish Outlook
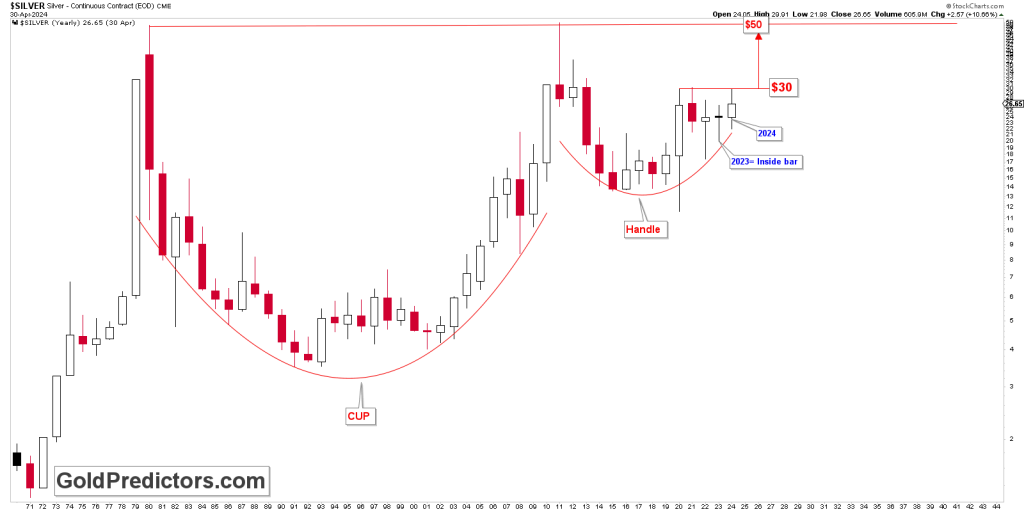
The long-term outlook for gold remains strongly bullish. Despite short-term corrections, the overarching trend points to a significant upward trajectory. This perspective is supported by the technical analysis of gold‘s price movements on monthly charts.
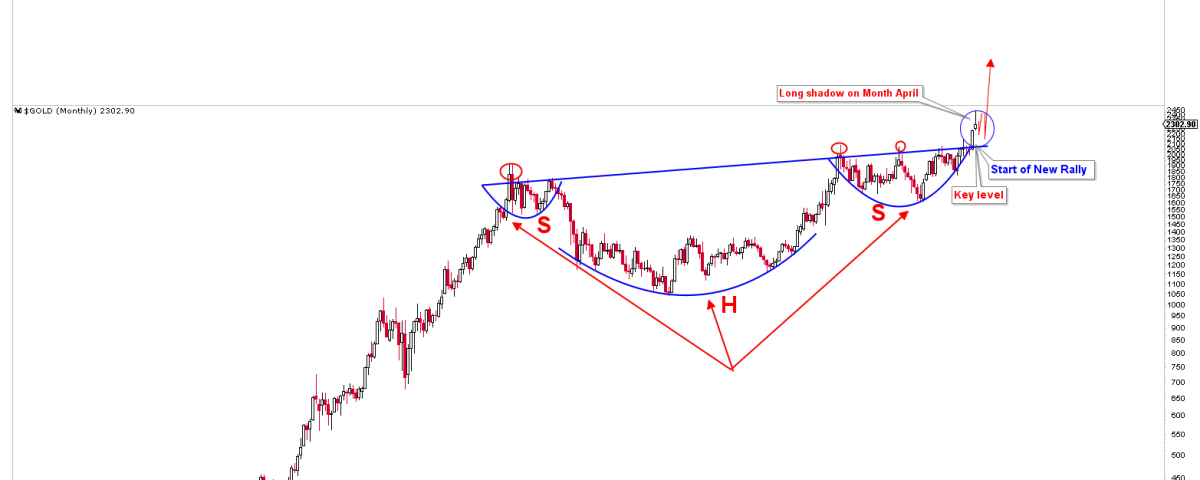
A closer examination reveals the formation of an inverted head and shoulders pattern, a standard bullish indicator in technical analysis. This pattern began forming over a decade ago, with the left shoulder traced back to price consolidations in 2011 and 2012. The head was formed during 2015, and the right shoulder from 2021 to 2023. The pivotal moment came in March 2024, when the price finally broke above the neckline of this pattern, signaling a solid bullish breakout.
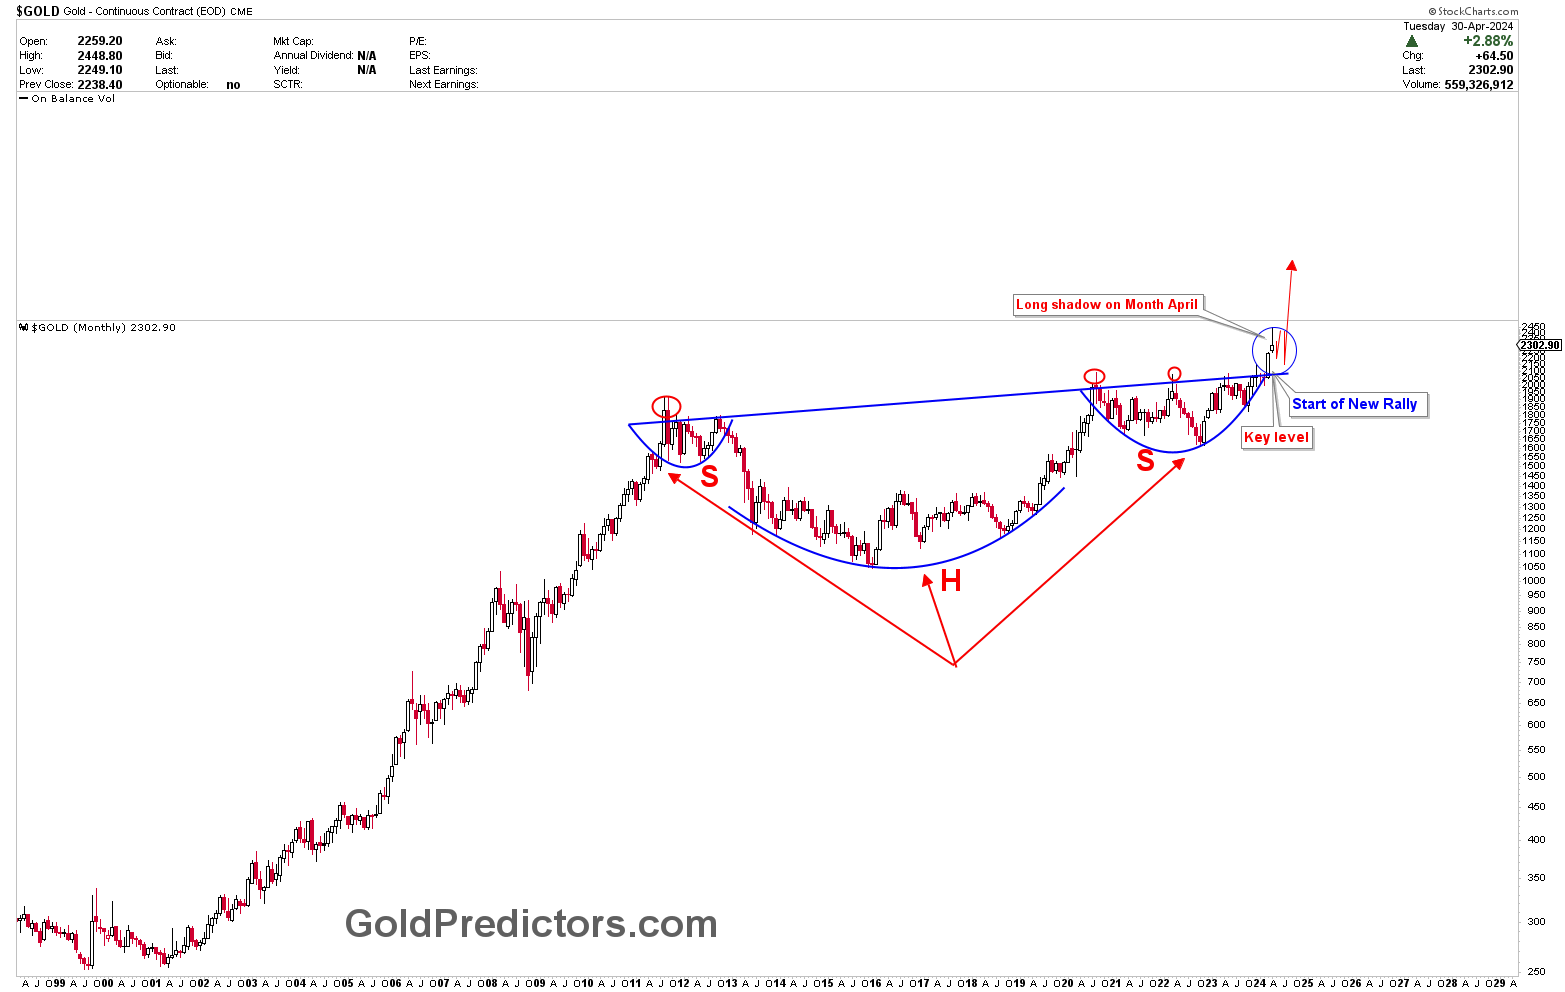
Although the price experienced a breakout just two months ago, it might typically return to the breakout at $2,075. This pivotal level took many years to break. Therefore, the price correction might be limited. However, the long shadow in April’s monthly candle indicates price weakness. This monthly candle showed a long shadow due to low liquidity at the end of the month, related to the Labor Day holiday on May 1st. Nevertheless, this pullback is a prime buying opportunity for both medium and long-term investors.
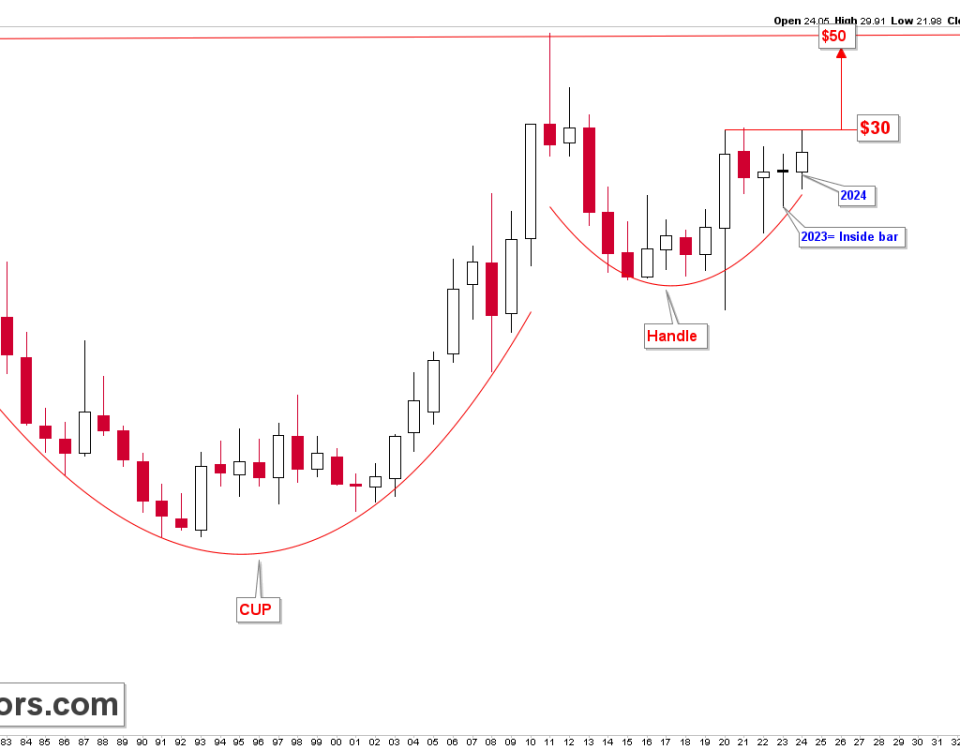
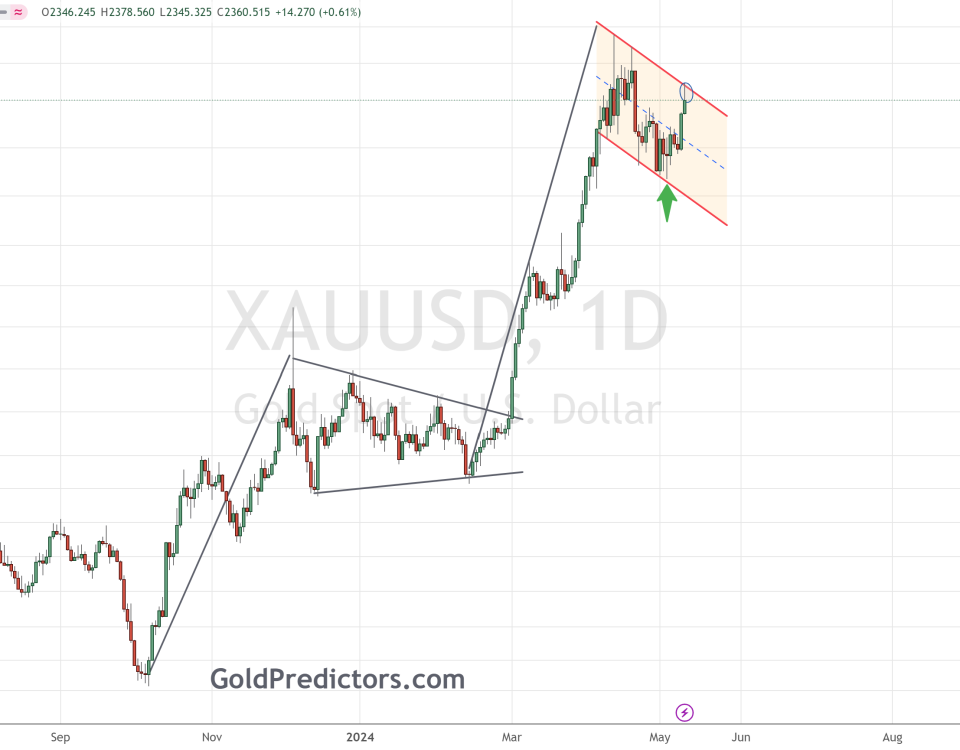
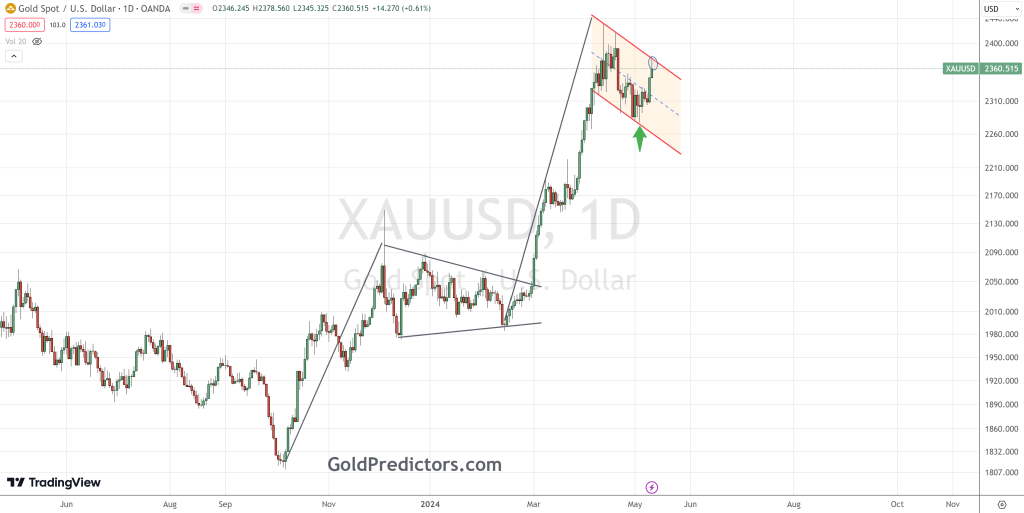
Looking forward, the initial resistance target for gold stands at around $3,000. However, the momentum gathered by the recent breakout and the technical formations suggest that even higher levels could be within reach. Investors would be wise to monitor these developments closely, as the dynamics of the gold market could offer substantial returns, especially in an environment where economic uncertainties and inflation concerns might hamper traditional investments. The short-term patterns in gold show the formation of the triangle, which may be the clue for the next move out of this short-term consolidation.
Final Words
In conclusion, while the U.S. economy shows signs of a possible slowdown, which could influence short-term market movements, the gold market’s long-term technical outlook remains bullish. The technical indicators and ongoing economic factors provide a strong foundation for gold’s continued appreciation. Investors looking for opportunities in a volatile economic landscape would do well to consider gold not just as a safe haven but as a promising investment with the potential for significant growth.
Gold Predictors offer short-term and medium-term trading signals for gold and silver to premium members through WhatsApp and emails. To access these insights, consider subscribing to Gold Predictors by using the link below. By subscribing, you’ll receive timely trading signals directly to your preferred communication channels.