


Why Gold Breakout Marks the Start of a Generational Bull Market
Gold prices dropped last week, but remained within the consolidation range between the $3,500 and $3,000 levels. However, this pullback is seen as part of a stabilizing process before the next move higher. Long-term charts show that gold has broken through a significant resistance level after more than a decade of consolidation. This breakout confirms the start of a new bull market, characterized by strong momentum. Technical patterns reveal a solid structure supported by institutional buying. Gold is evolving from a traditional hedge into a core long-term asset. With price acceleration underway, the market signals considerable upside potential.
Gold Breaks Major Long-Term Resistance After a Decade of Consolidation
The gold chart below shows a decisive breakout above a key resistance line that held prices in check for over a decade. From the early 2010s until 2023, gold was trapped within a symmetrical broadening wedge. This wedge reflected indecision, volatility, and accumulation. However, that phase has ended. The breakout occurred in 2023 when gold pushed above the upper boundary of the wedge, confirming its strength with a follow-up move in subsequent quarters.
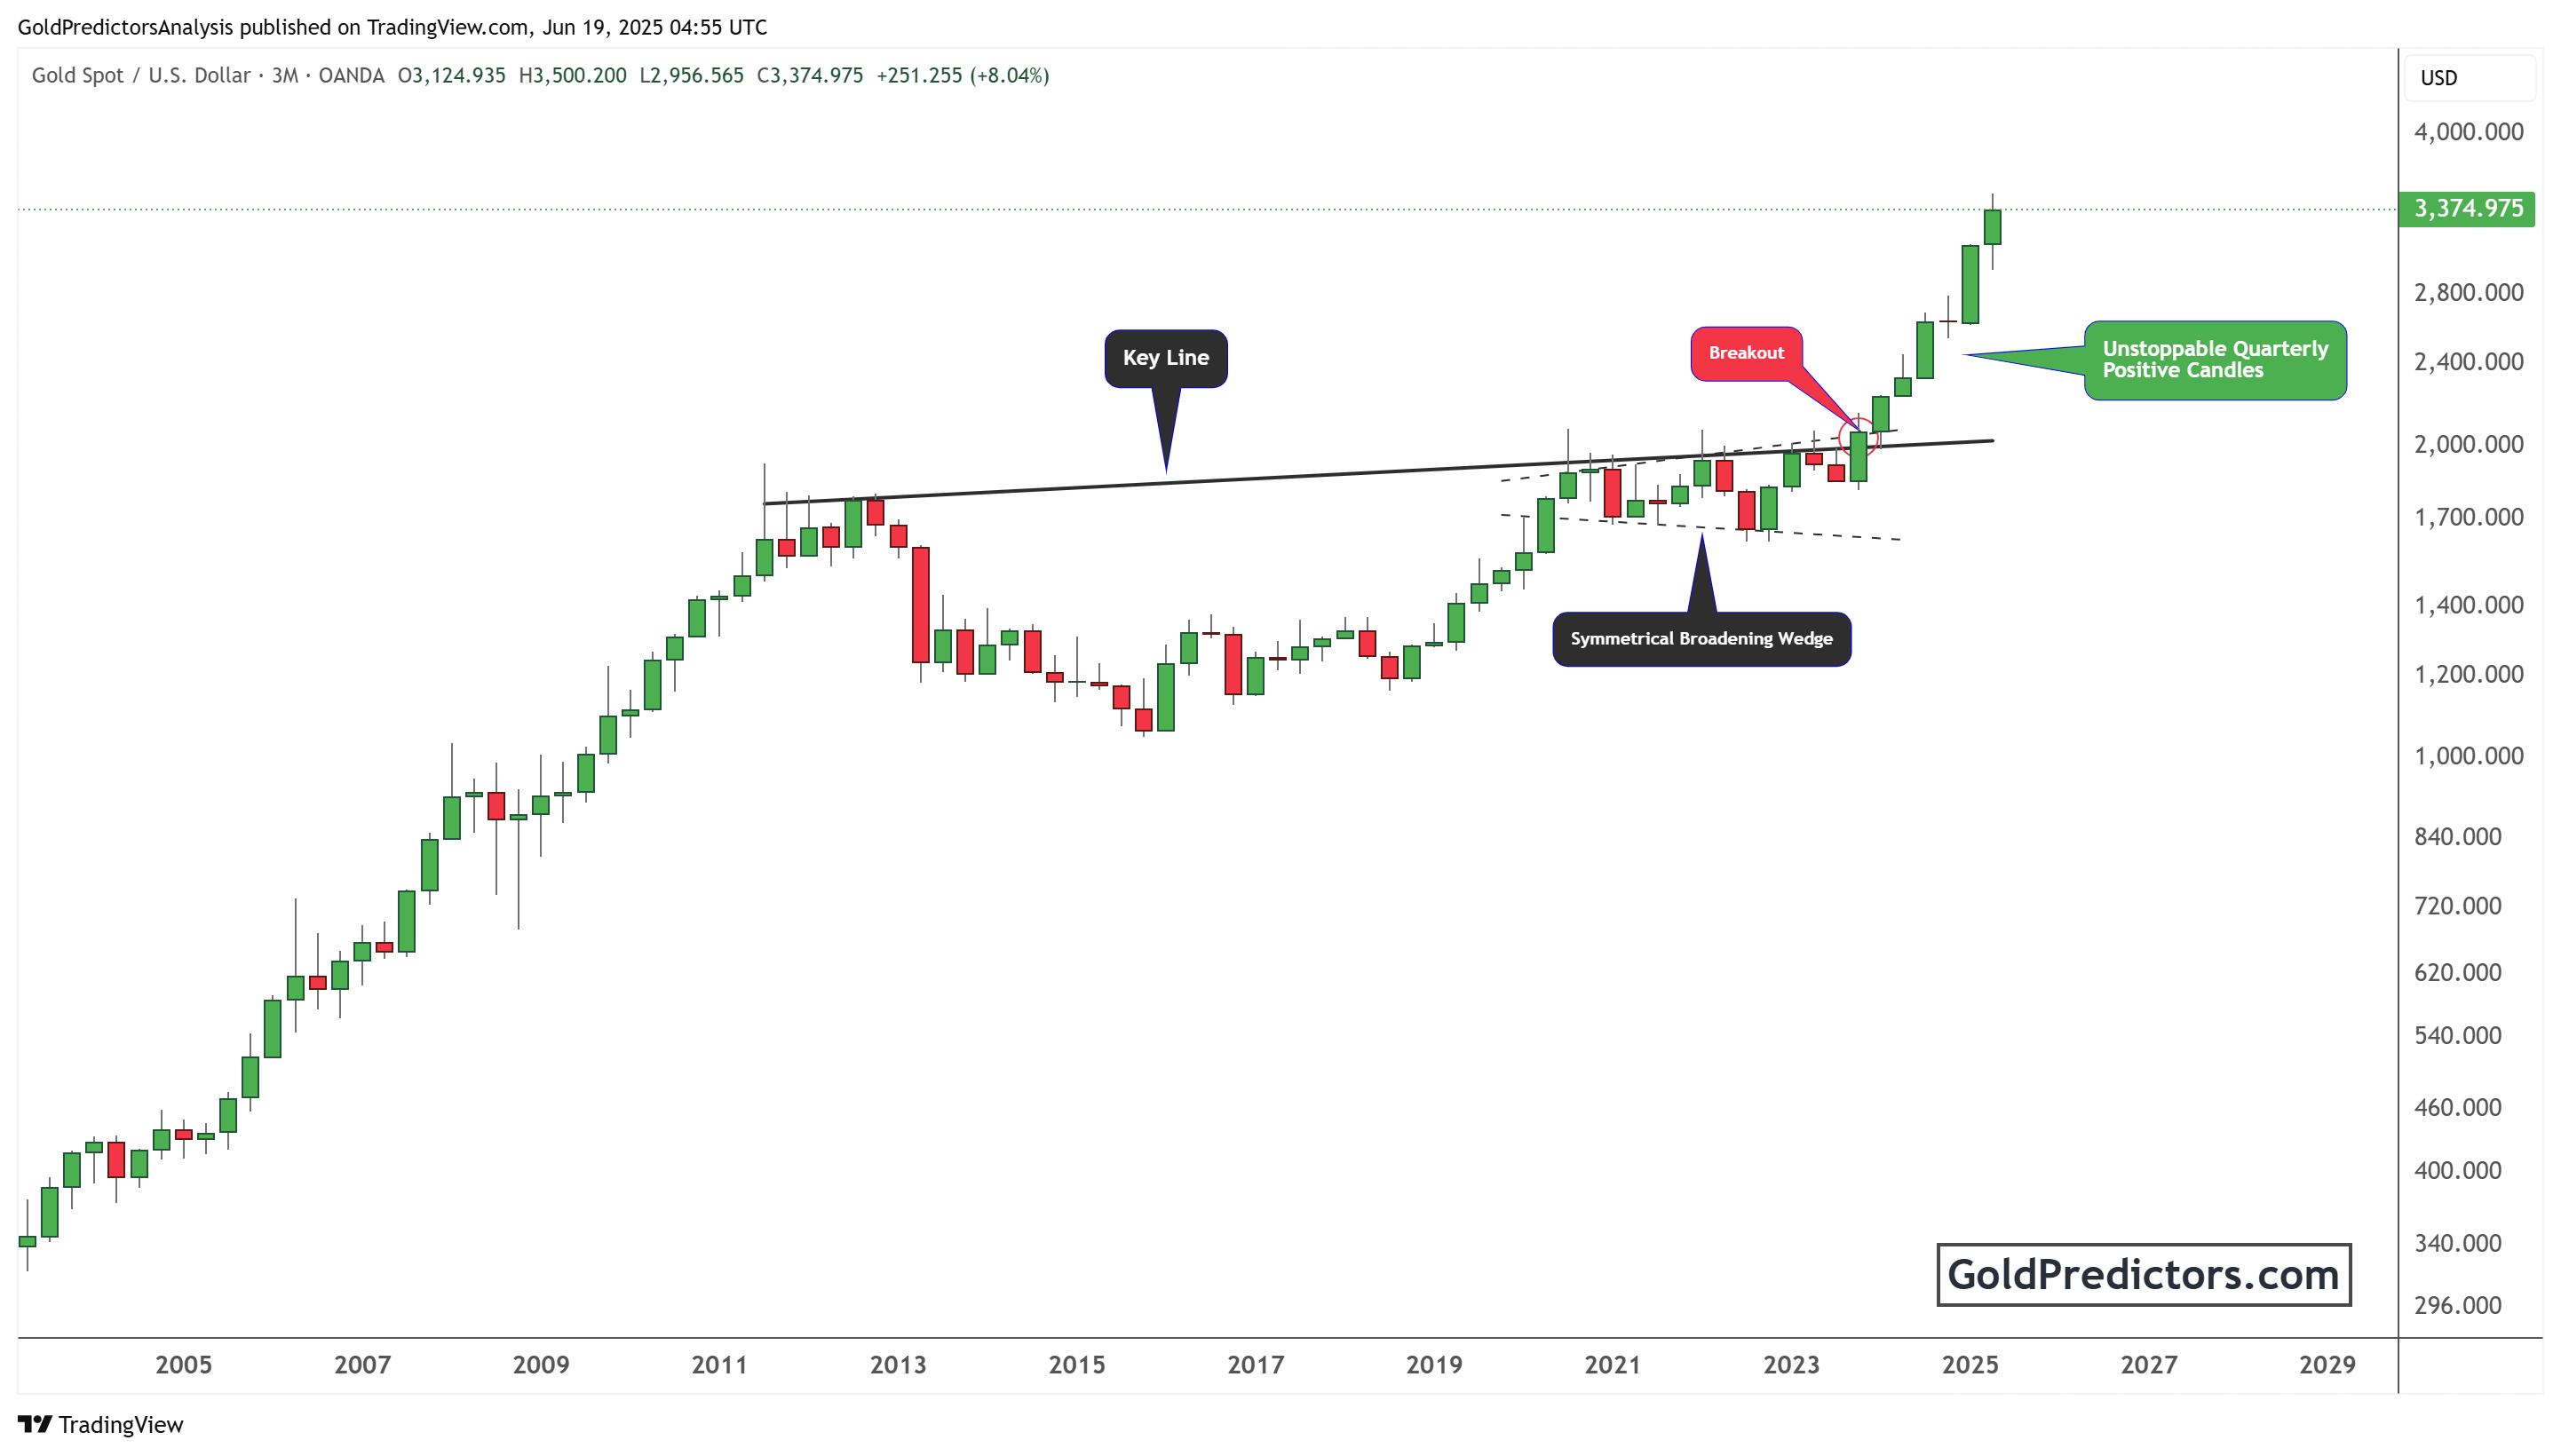
The most striking feature on the chart is the series of unstoppable quarterly green candles. This rare phenomenon reflects sustained institutional buying and firm conviction in the market. These bullish candles indicate that investors no longer view gold as just a hedge but as a core long-term asset. The breakout has now transformed the previous resistance zone, around $2,050–$2,100, into a strong long-term support level. However, the question is whether gold will ever see these support levels, as the ongoing economic crises indicate continued buying interest.
Breakouts on quarterly charts signal structural changes in the market. The last time gold made such a breakout was before the 2009–2011 Bull Run. Back then, gold surged from under $1,000 to above $1,900. The current structure is even more powerful and mature, suggesting a multi-year trend with much higher upside potential.
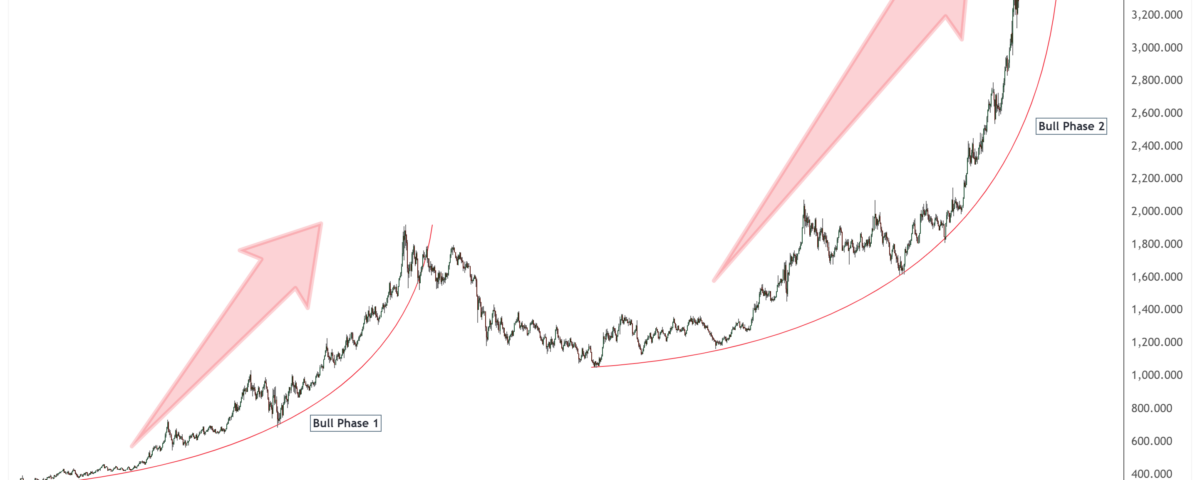
Gold Bull Market Accelerates With Steeper Uptrend and Price Targets Ahead
The chart below shows gold’s two distinct bull phases. The first bull phase started in the early 2000s and ended in 2011. It was marked by a steady parabolic rise, driven by inflation fears, financial instability, and rising debt levels. After consolidating for nearly a decade, gold entered the second bull phase in 2018.

This new bull phase has now accelerated. The curve on the chart clearly shows a tightening and upward arc, suggesting the price is moving into a vertical growth zone. The steepness of the curve in Bull Phase 2 is more aggressive compared to Phase 1. The large red arrows on the chart point to a possible exponential rise. Gold is currently correcting below $3,300, but the technical structure suggests a potential surge toward $4,000 and $6,000 after completion of this correction.
The fundamentals support this technical setup. Geopolitical risks, currency debasement, excessive debt, and declining trust in fiat money are all factors that are bullish for gold. Investors are increasingly shifting from riskier assets, such as tech stocks, into more stable assets, like gold. Central bank buying has also reached record levels, further fueling the rally.
Conclusion: Gold Long Term Price Outlook Turns Extremely Bullish With $6,000 Potential
The breakout above $2,000 and $3,000 confirms that gold has entered a robust new bull market. This move is supported by strong technical patterns on both short- and long-term charts. The current structure mirrors previous historic bull markets, but with even greater momentum and maturity.
Breaking through a decade-long resistance zone marks a significant structural shift, comparable to the rally that preceded the 2009–2011 surge, during which gold nearly doubled in value. Bullish quarterly candles indicate firm support from institutional investors.
The technical breakout aligns with strong fundamentals. Global uncertainty, rising sovereign debt, and continued central bank gold accumulation reinforce the bullish outlook. As gold moves into a vertical growth phase, investors should prepare for further price acceleration. The gold market has entered a new era, and this rally is just beginning.
Gold Predictors Premium Membership
Get exclusive short-term and swing trade ideas with precise entry levels, stop-loss, and target prices, including justification and analysis — all delivered directly via WhatsApp.
Our premium service includes deep technical analysis on gold and silver markets. We cover cycle analysis, price forecasting, and key timing levels.
Members also receive a weekly market letter with detailed analysis, commentary from our Chief Analyst, including actionable insights, trade timing, and direction forecasts for gold and silver.
Stay ahead of the market — join our premium community today.


