


The Recent Boom in GBPJPY
The Japanese Yen has been the weakest currency as per our prediction in last year September 2021. The recent boom in GBPJPY has moved the pair around 1,300 pips as per our prediction last year. The safe-haven demand for Japanese yen was damaged by a revival in the risk attitude. This was seen by a generally upbeat tone in the equity markets. The divergence in the monetary policies of Federal Reserve and Japanese, combined with other fundamental factors, pushed investors away from the Japanese Yen.
The Fed Governer, Lael Brainard stated that the central bank would continue to raise interest rates to reduce its balance sheet. On the other hand, US consumer inflation numbers for March showed no signs of slowing and surged to levels not seen since 1981. Because of the Federal Reserve’s “hawkish” tone, the US dollar rose to its highest level in over two years and supported the USD/JPY.
The Boom In GBPJPY
BoJ Governor, Haruhiko Kuroda reaffirmed his commitment to the existing monetary stimulus in order to help economic recovery. In the last hour or two, there has been a rapid jump in USDJPY, taking some of the trade stops. The upward trend might thus be explained by some technical buying. That calls for caution from bulls in light of the current overbought circumstances. US economic data, including the Producer Price Index, will be released in the early hours of the North American trading day. As a result of this, the value of the US dollar is expected to rise. This gives the USD/JPY a further boost.
Similarly, the GBP/JPY pair has also stabilized near 163.00 on Tuesday, after mixed UK labour market data and a drop in global rates following a lower-than-expected inflation rate in the US. The pair has fluctuated between 162.80-163.60 throughout the day and is expected to shoot higher on Wednesday. Although UK CPI data will be released on Wednesday, and if it surprises to the upside, it might be a positive stimulus for the pound.
Long Term Outlook in GBPJPY
The GBPJPY’s long-term outlook remains bullish. We have been discussing the bullish outlook for the GBPJPY since last year and have stated unequivocally that a 3,000 pips move in the pair is imminent. The pair has moved around 1,500 pips from the bottom of the most recent rally and is poised to re-ignite its rally to much higher levels. The charts below show the long-term and short-term developments, with the analysis pointing to higher levels in 2021.
GBPJPY Analysis of 2021
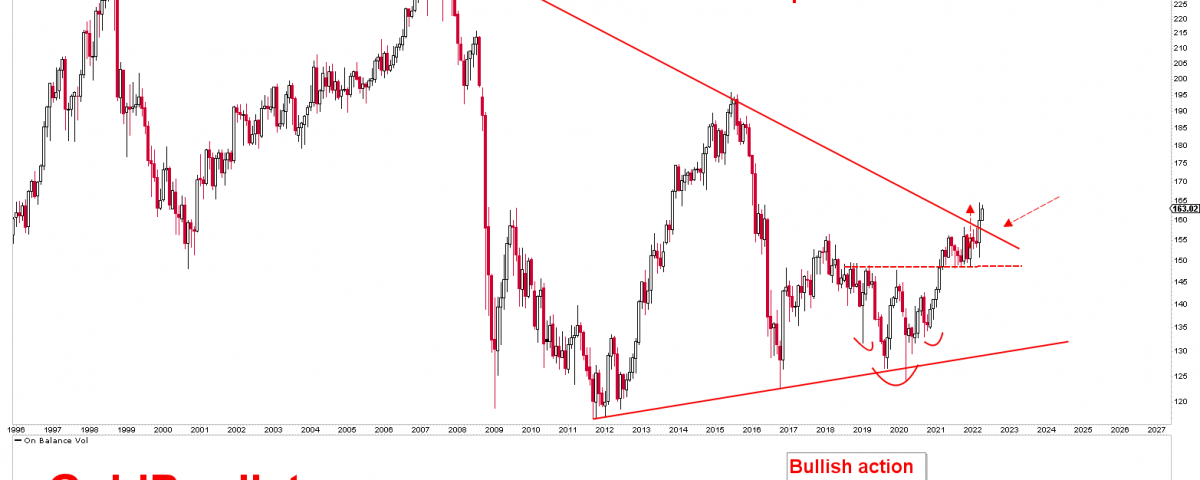
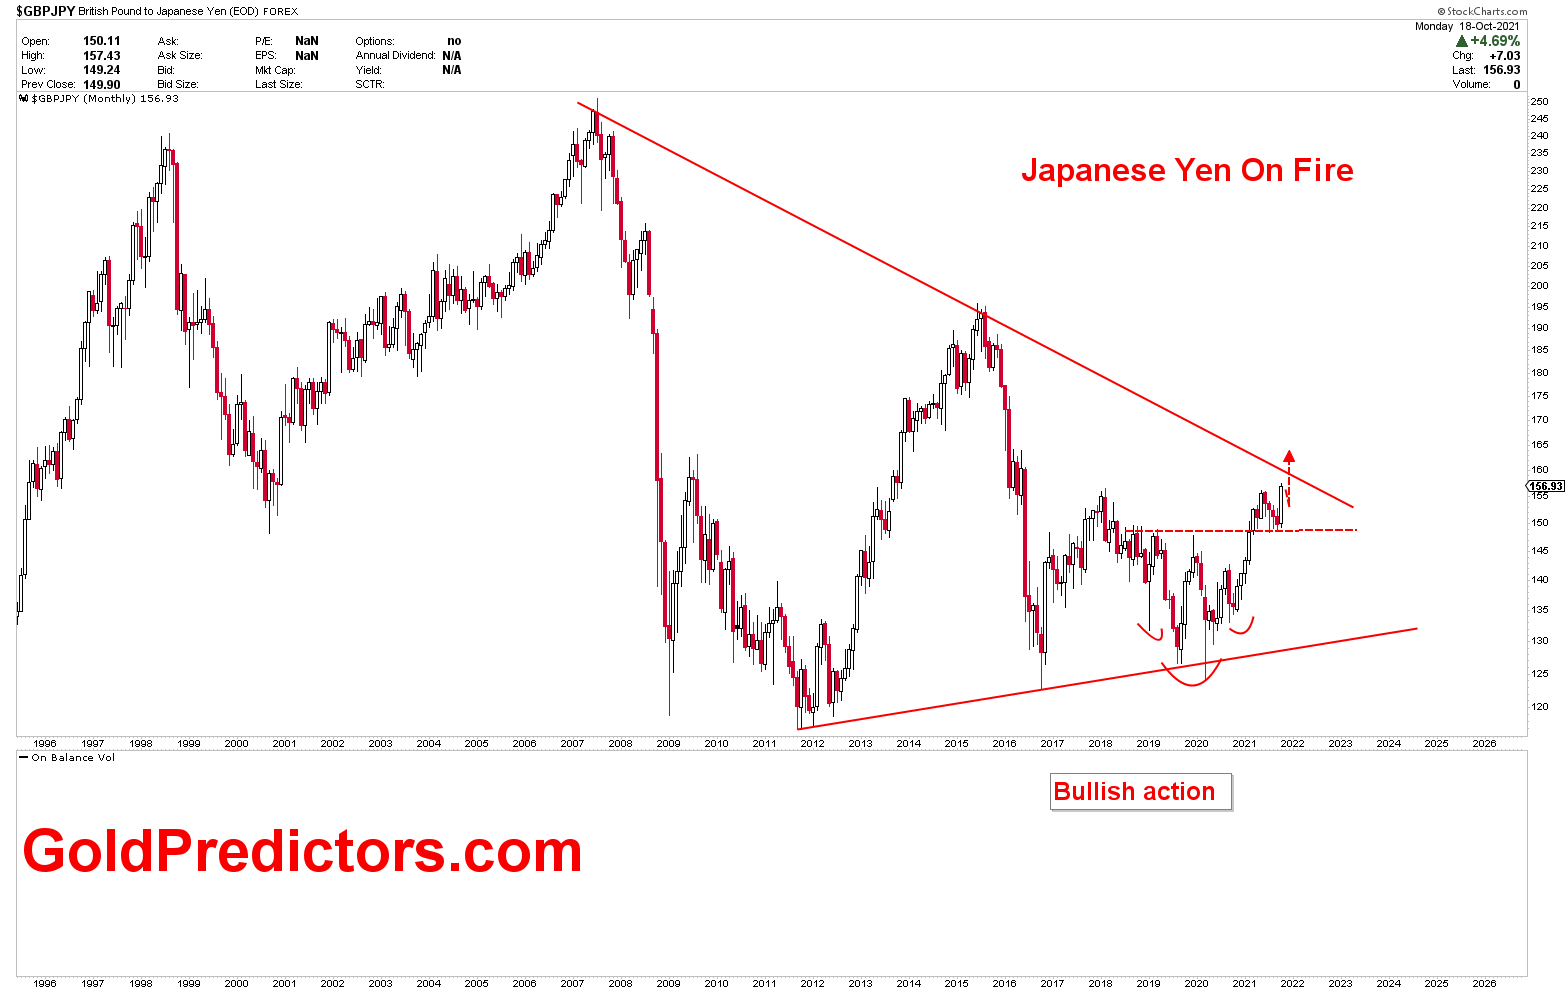
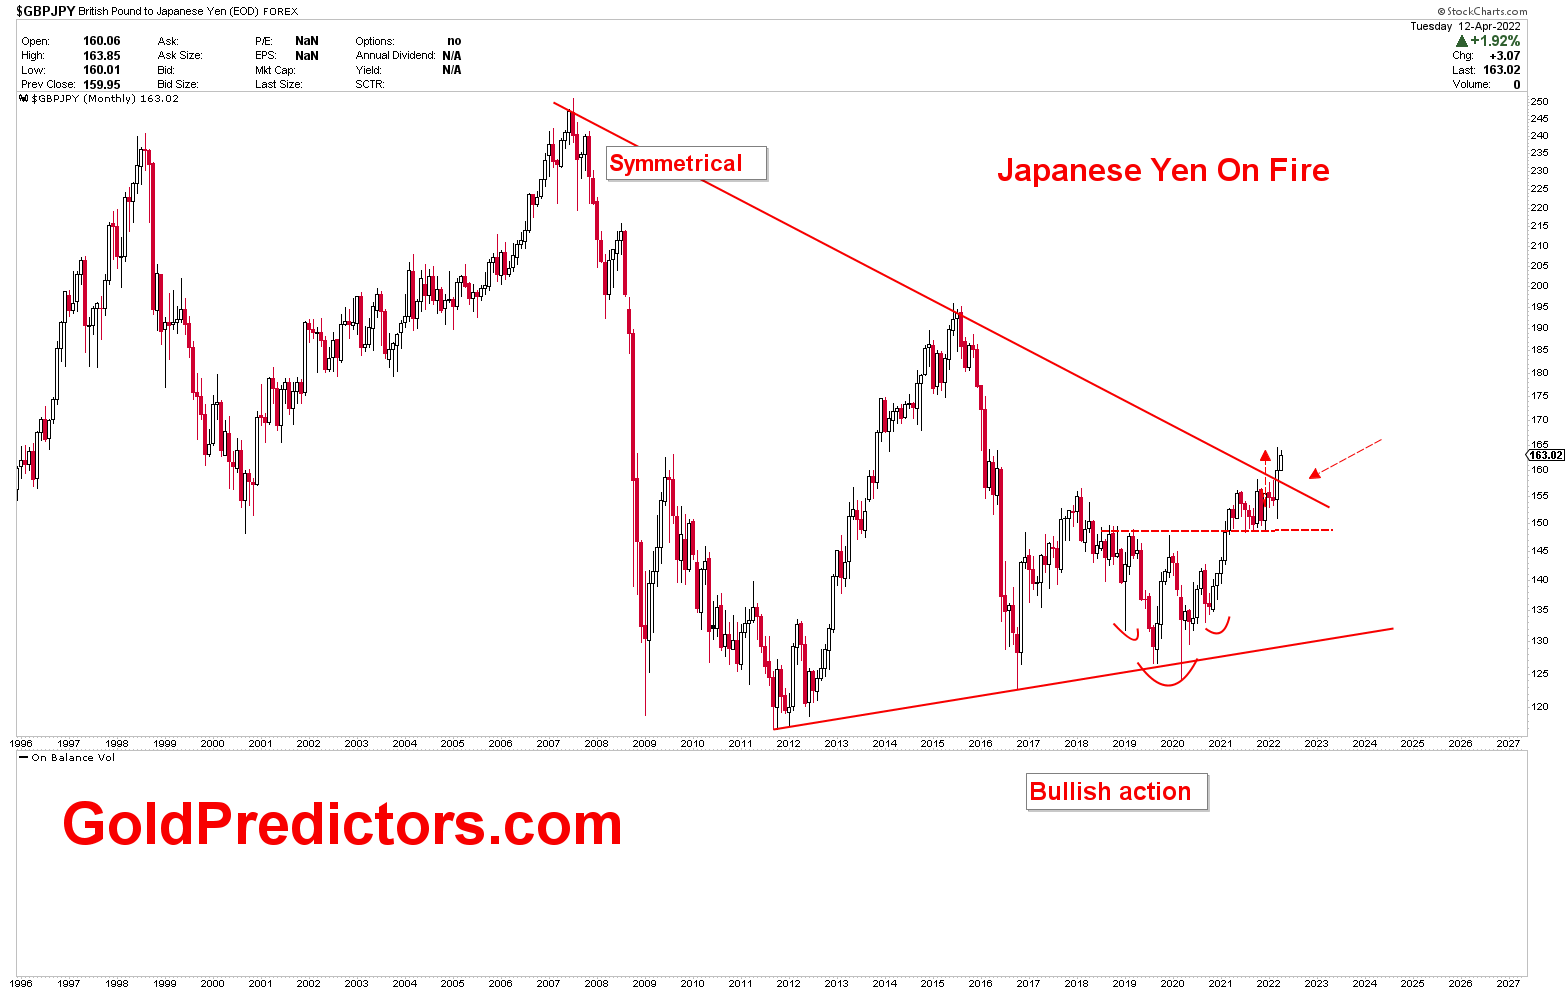
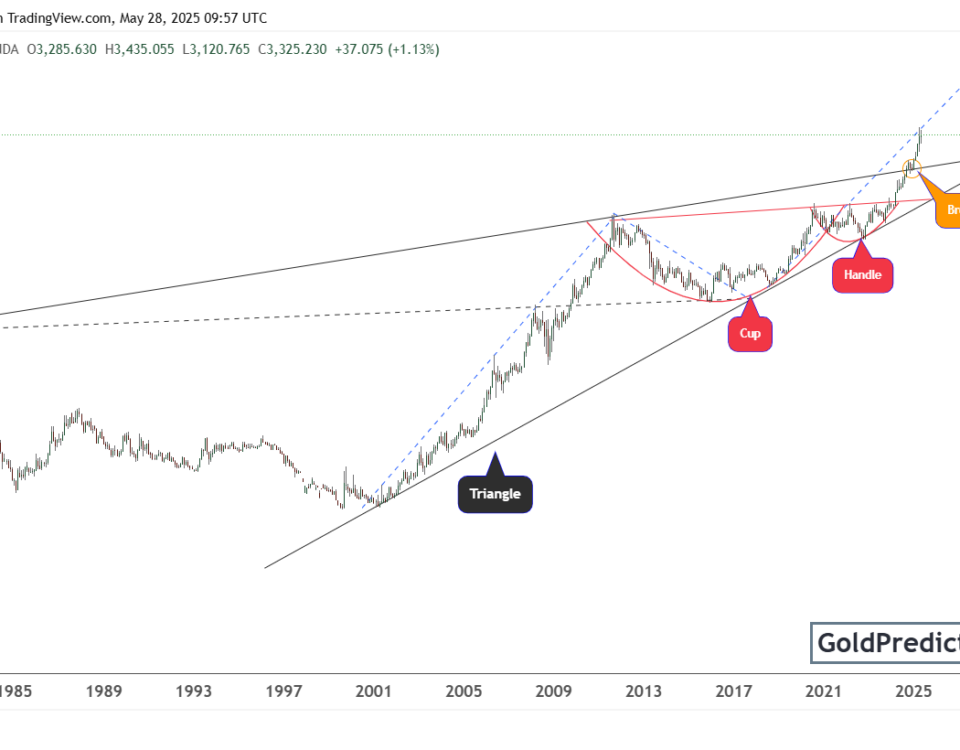
The first GBPJPY chart of 2021 shows the monthly analysis. The arrow points to a lower level and then a red arrow points higher, penetrating the red symmetrical triangle. The price was expected to follow the same trend. The month of November 2021 was a pullback month, followed by a rally back to break through the triangle line.
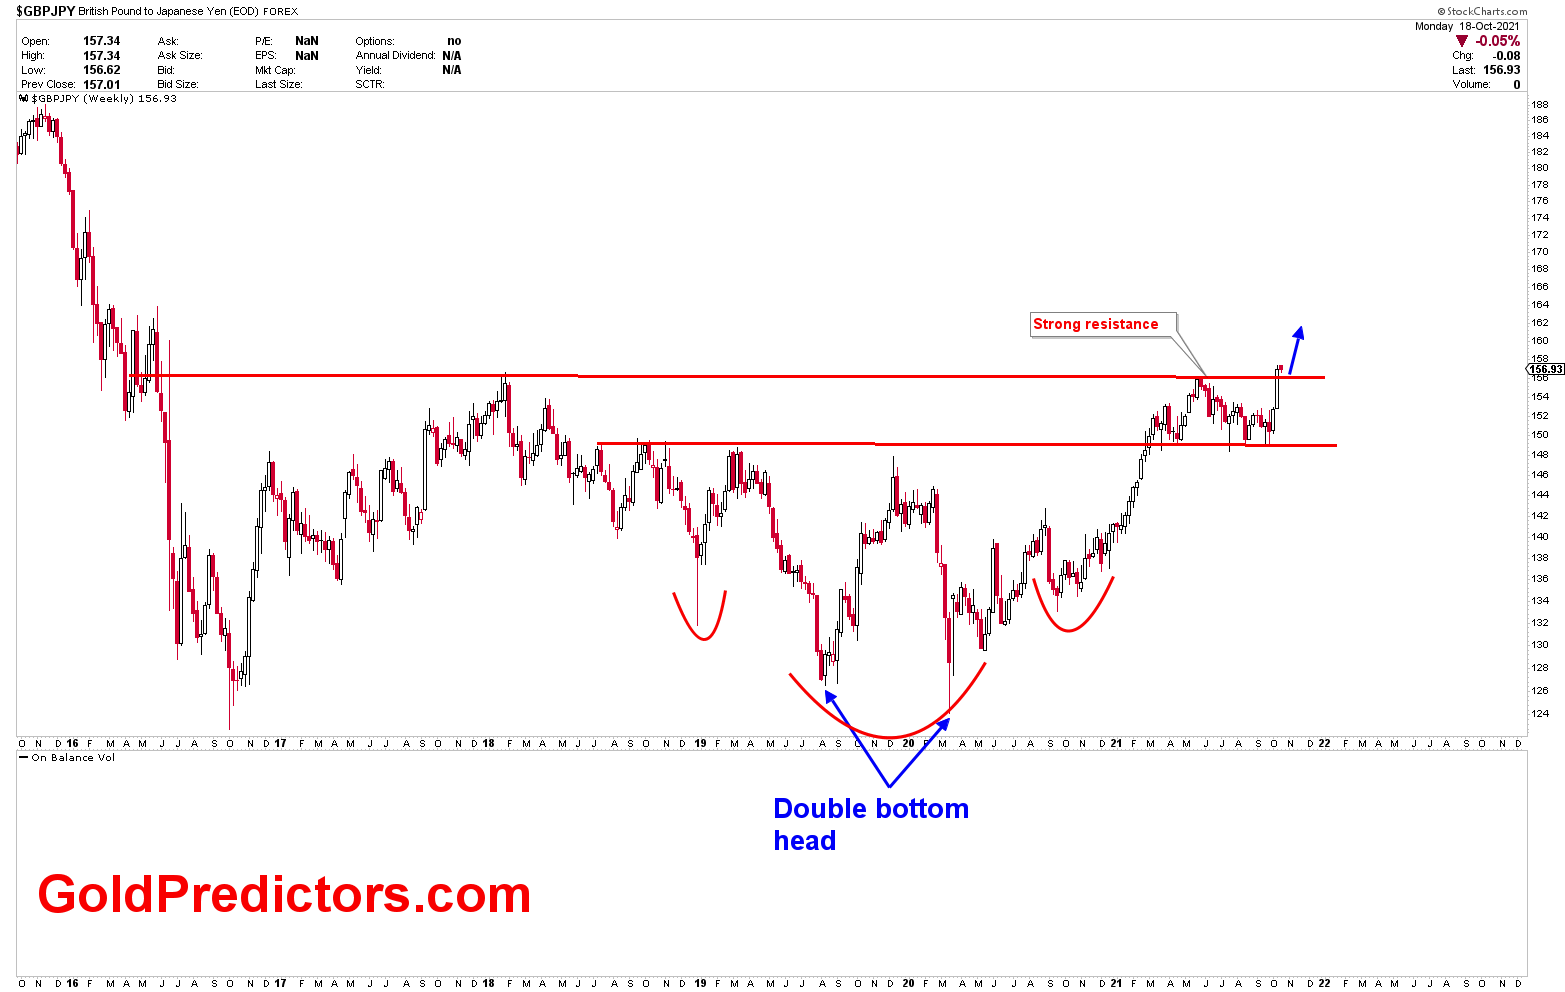
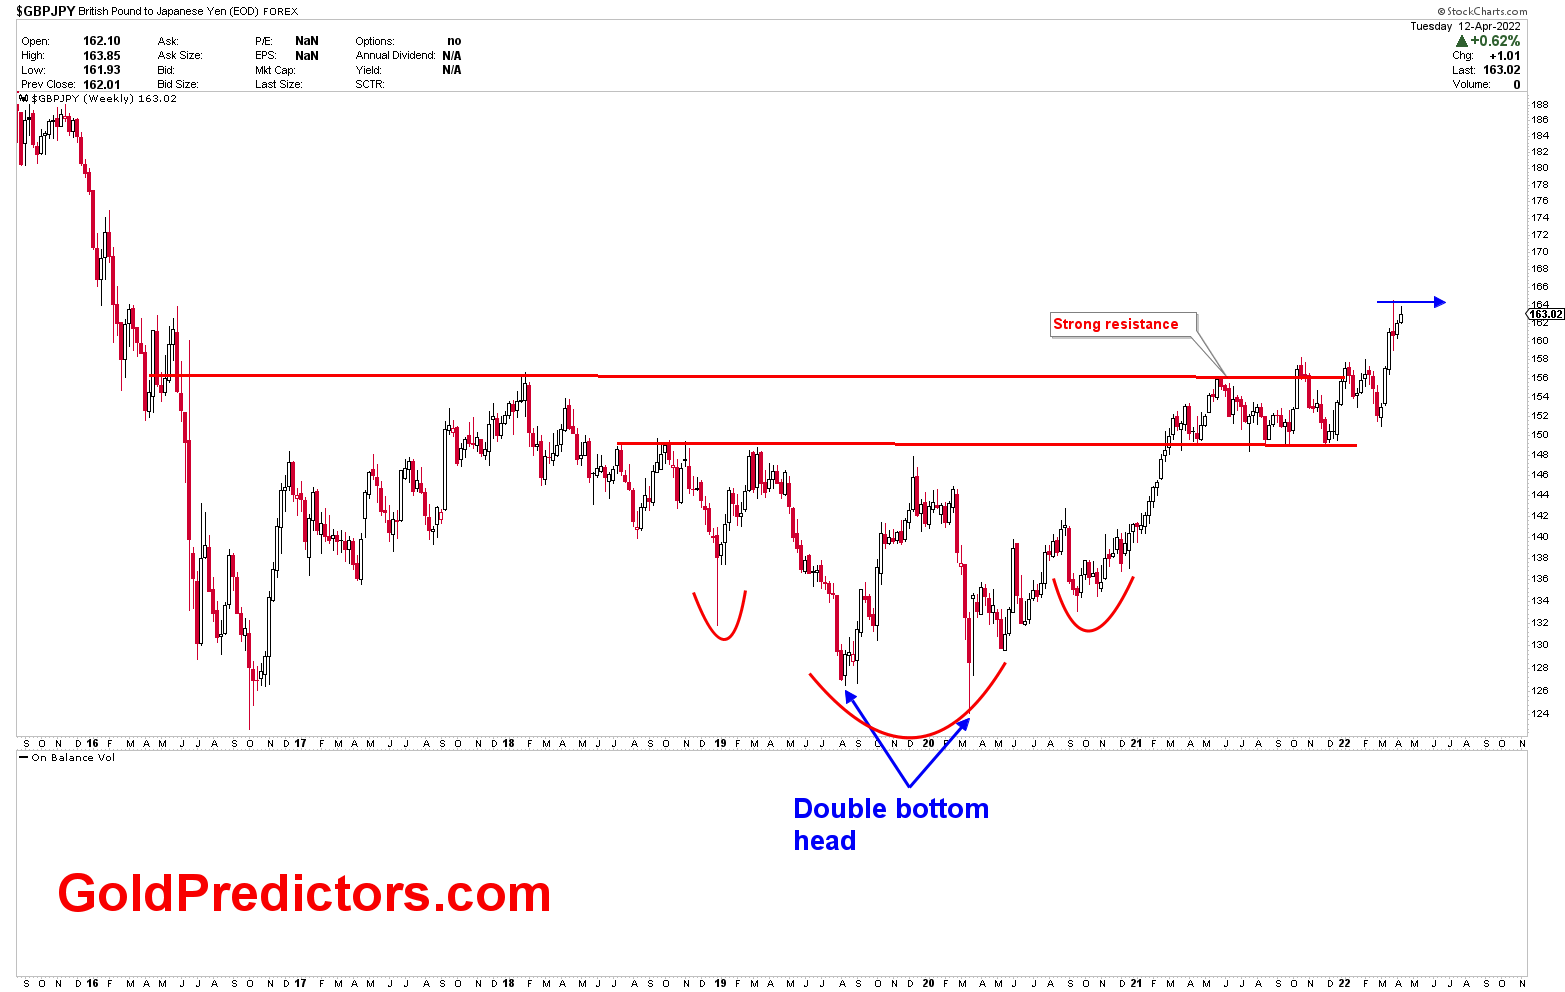
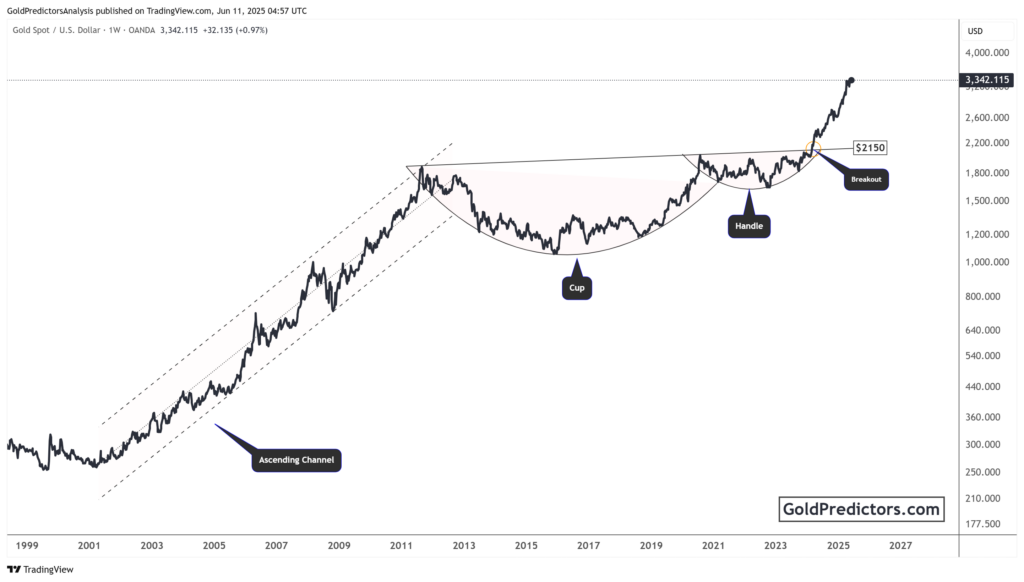
The following chart depicts the weekly outlook, with two horizontal red lines identified as the primary resistance zones where any pullback was possible. The development of an inverted head and shoulder with a breach of the neckline, on the other hand, confirmed a rally in the GBPJPY pair. As a result, the red arrow on the chart indicated that higher levels were about to be broken. November and December 2021 were fluctuating months in between these two lines, and a breakout sparked the rally in this instrument.
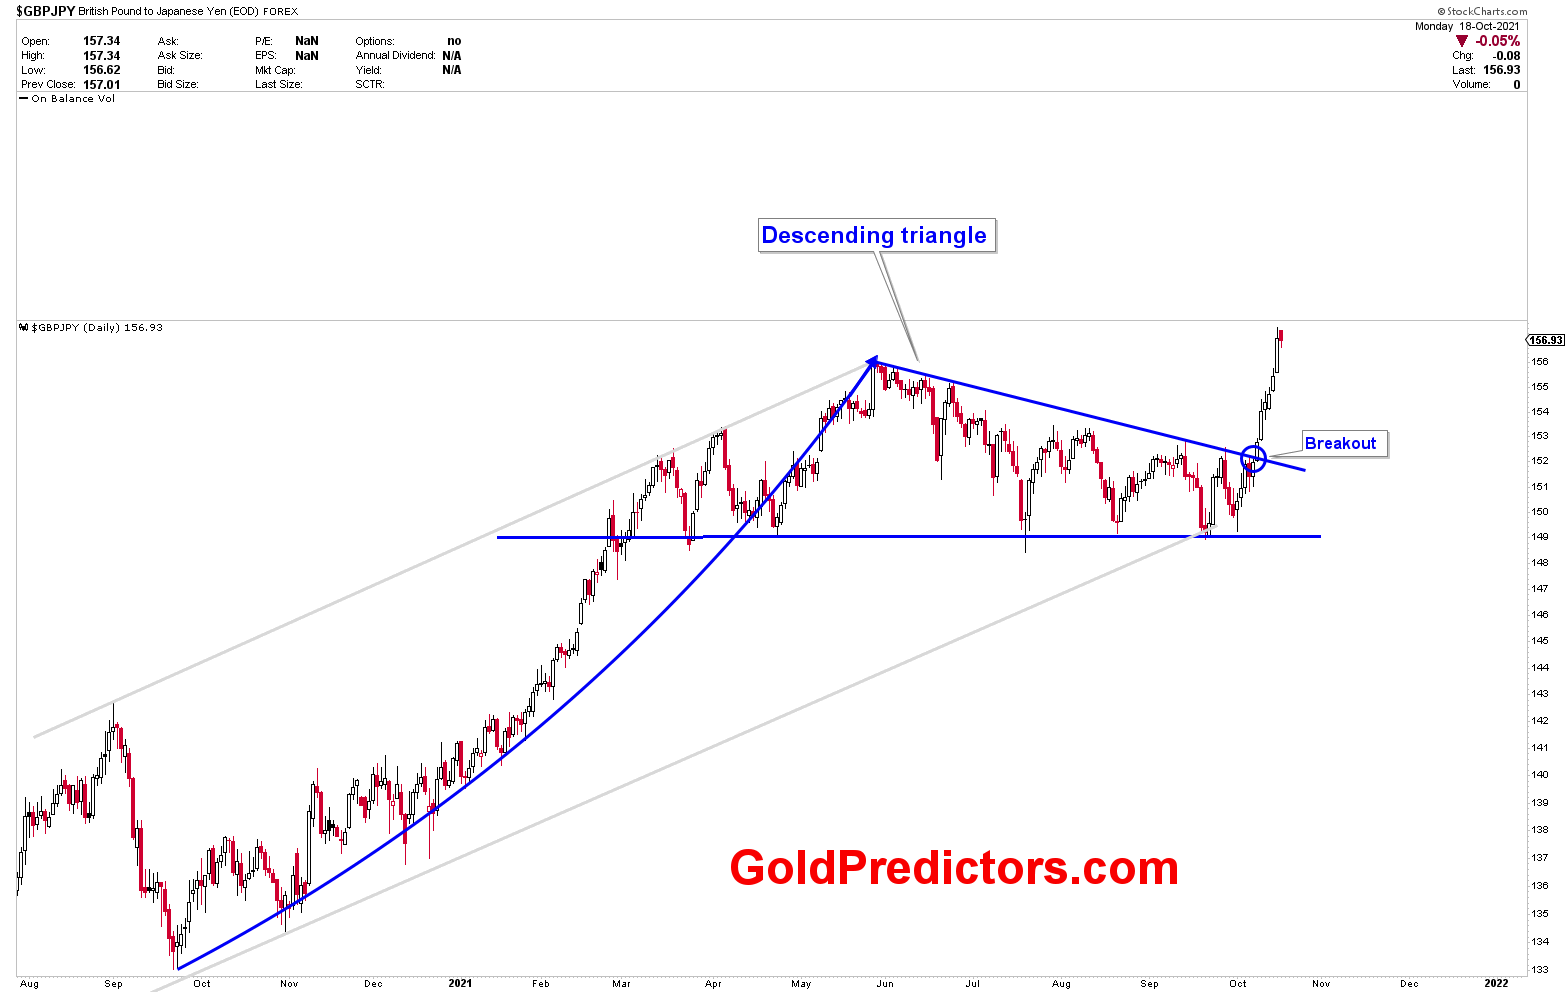
The third chart depicted the development on daily charts, where the price was moving beautifully in the grey channel. It was clear that prices were about to spark. Another notable formation was the breakout from the descending triangle at 152. This is where the trading signal to go long at 152 was executed. Breakout from the descending triangle also resulted in the formation of flag patterns, which indicated much higher prices.
GBPJPY Updated Analysis of 2022
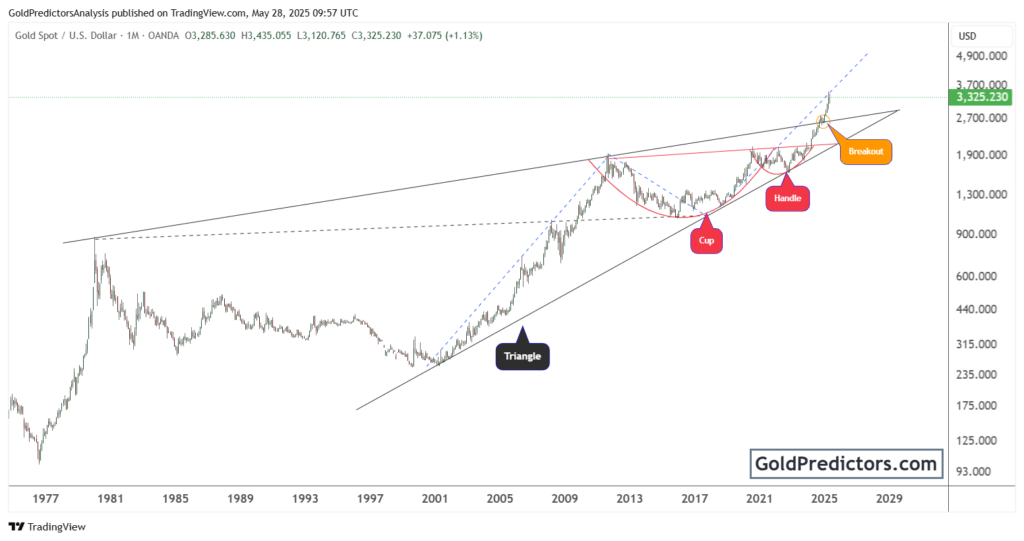
The updated chart, as a result of the analysis, produced a perfect reaction. This is now serving as the foundation for the next move. The monthly chart below shows that the month of March was close to or above the symmetrical triangle. However, due to long-term price patterns, there may be some consolidation due to short-term overbought conditions. Monthly charts have deviations of around 300 pips on both sides of lines. The increase in volatility may clear stop losses before any meaningful corrections. Therefore, traders are advised to keep their positions scalable.
The following chart depicts the analysis’s aftereffects. The price has consolidated between the range bound red lines before breaking higher. There was no pullback after the breakout, and the price is now entering overbought territory.
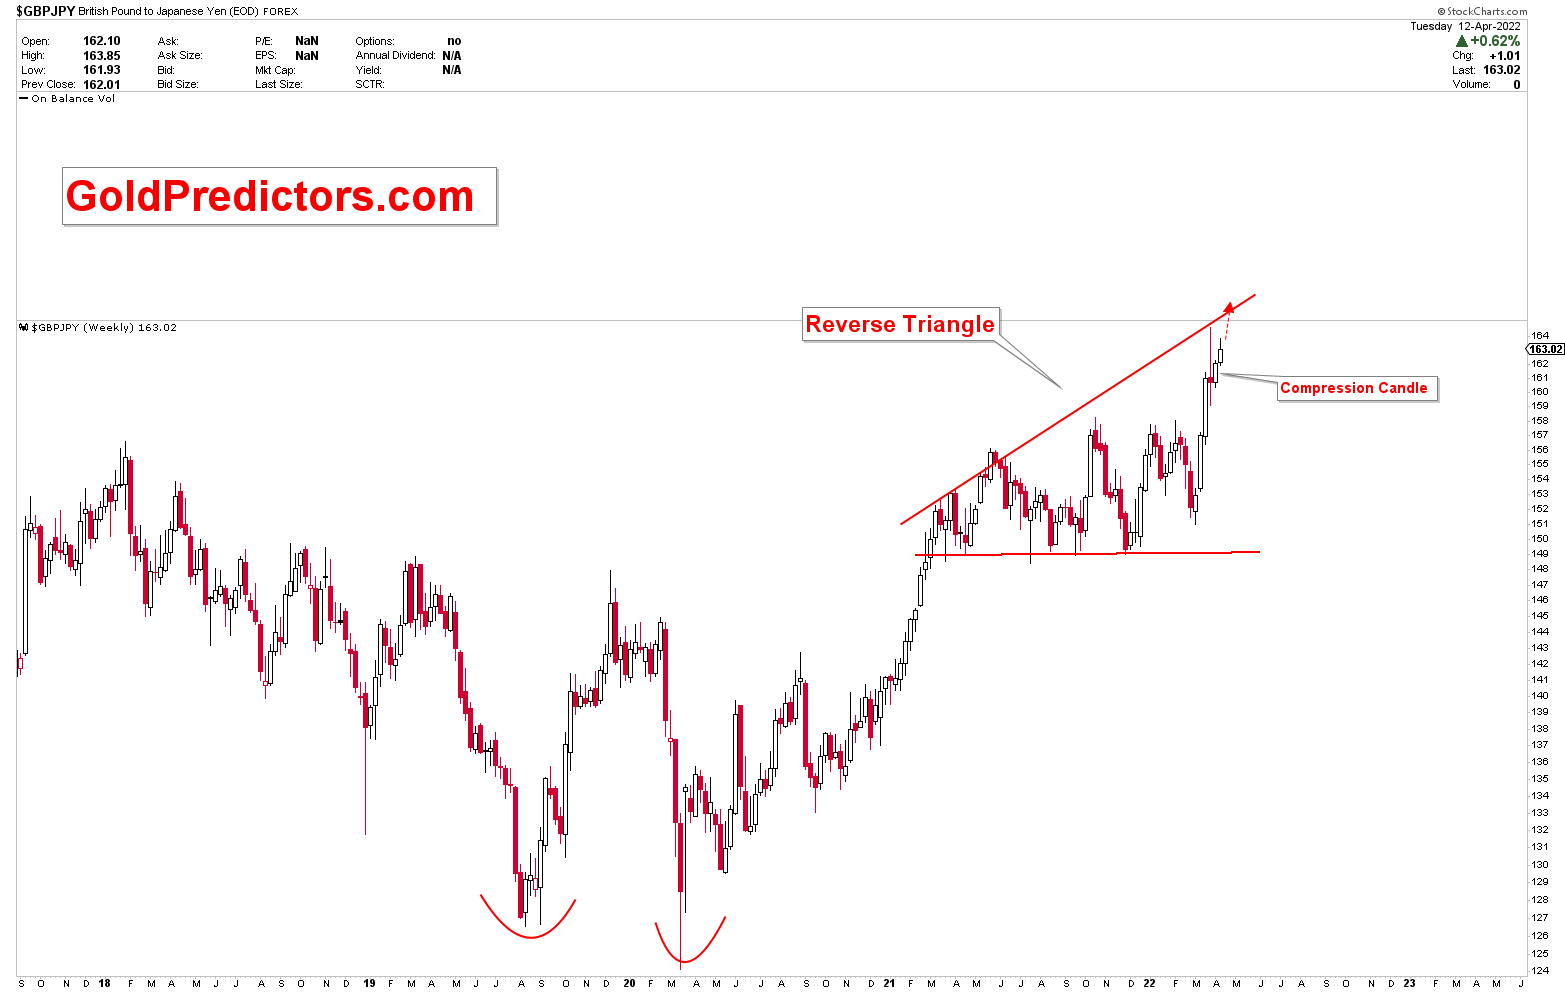
Last week, the GBPJPY produced an inside week bar known as a coiling or compression candle. This indicates that a massive rally is on the way if the recent highs are breached. The weekly chart pattern shows a reverse triangle with very close resistance. However, there are no signs of a reversal, and any new highs could spark the next rally.
Based on the discussion above, it is clear that the Japanese Yen remains the weakest currency on the board in terms of fundamental outlook. The technical picture in Japanese Yen pairs also confirms the Yen’s bearish phenomenon. GBPJPY remains the currency pair poised to benefit from the Japanese yen’s weakness and ignite its rally. According to the technical charts, the short term price is overbought and trading at recent resistances; however, the production of compression candles indicates that any break to new highs will cancel out the short term pullback in the pair.
