The Expanded Volatility in USDJPY | Gold Predictors - Forecasting Gold Prices

New York

London

Sydney

Tokyo

Log In

  • Register
  • Lost your password?
gold predictorsgold predictorsgold predictorsgold predictors
  • HOME
  • ABOUT US
    • About Us
    • Social Networks
    • Industry Links
    • Testimonials
  • RESEARCH
    • Scientific Trade Strategies
    • Gold Hub
    • Gold Importance
    • Silver Importance
  • GOLD HUB
  • GOLD ANALYSIS
    • Gold Analysis
    • Technical Analysis
      • Trend Identification
      • Phase Identification
      • Important Levels
      • Volatility Measurement
    • Gold Cycle
      • Short Term Cycles
      • Medium Term Cycles
      • Long Term Cycles
    • Price Action Analysis
      • Phase Identification
      • Historical Pattern Identification
      • Candlestick Pattern Identification
    • Fundamental Analysis of Gold
    • Gold Related Markets Analysis
    • Gold Seasonal
  • TRADING METHODOLOGY
    • Gold Analysis
      • Technical Analysis
      • Gold Cycle
      • Price Action Strategy
      • Fundamental Analysis
      • Gold Related Markets Analysis
      • Gold Seasonal
    • Measure Signal Strength
      • Weak Signal
      • Strong Signal
      • Confirmed Signal
    • Trading Decision
    • Trading Rules
      • Basic Trading Rules
      • Gold Predictors Trading Rules
    • Trade Examples
    • Performance
  • LIVE CHARTS
  • MEMBERSHIPS
    • Free Membership
    • Premium Membership
    • SignUp
  • MEMBERS AREA
    • Free Article
    • Premium Article
    • Trading Signals
    • Long Term Signals
    • Forex Reports
    • Crypto Reports
  • FOREX REPORTS
  • HELP
    • FAQ
    • Contact Us
Login / Register

The Expanded Volatility in USDJPY

0
Published by admin at April 20, 2022
Categories
  • FOREX REPORTS
  • Free Articles
Tags

Inflation boosted US Treasury rates, and an active Federal Reserve rhetoric campaign, along with the dangers of a stalled but still deadly Ukraine conflict and the Bank of Japan’s (BoJ) presumably perpetual liquidity policy, created a near-ideal situation for the dollar versus the yen with expanded volatility in the USDJPY pair. The USDJPY has jumped more than 1,000 pips within two months and trading above the roof of resistances.

When President Christine Lagarde refused to modify monetary policy, the European Central Bank (ECB) aided the dollar’s cause, although without expressly mentioning the Yen. Citing the very serious risk posed by the Ukraine crisis to economic development, the bank maintained its base and deposit rates despite eurozone inflation of 7.5%. The ECB’s bond purchase program is set to continue until August but at a reduced level. Rate rises will be considered only after the bond withdrawal. The Dollar Index increased by 2.1% in April and by 3.9% since last year.

USDJPY Outlook

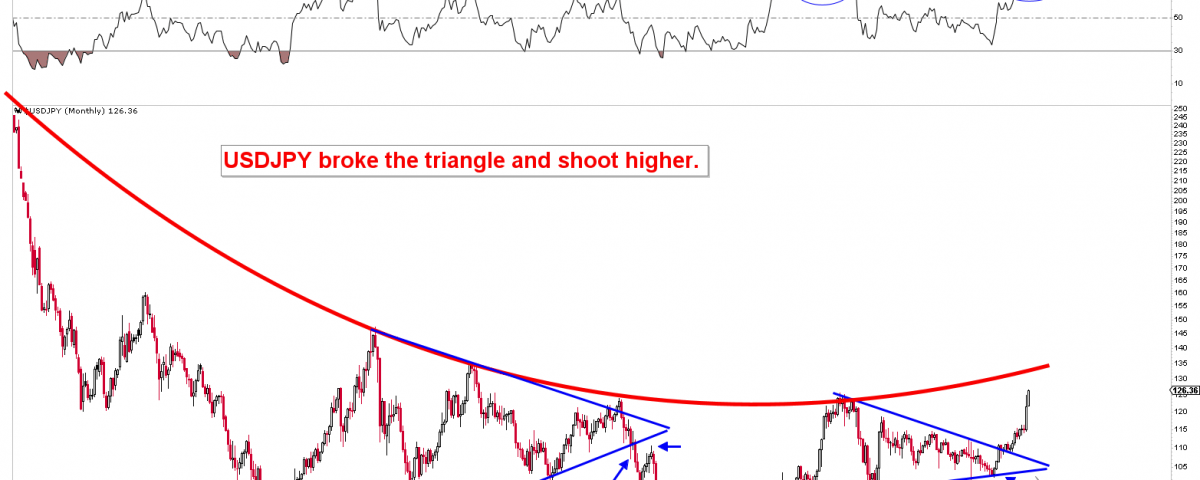
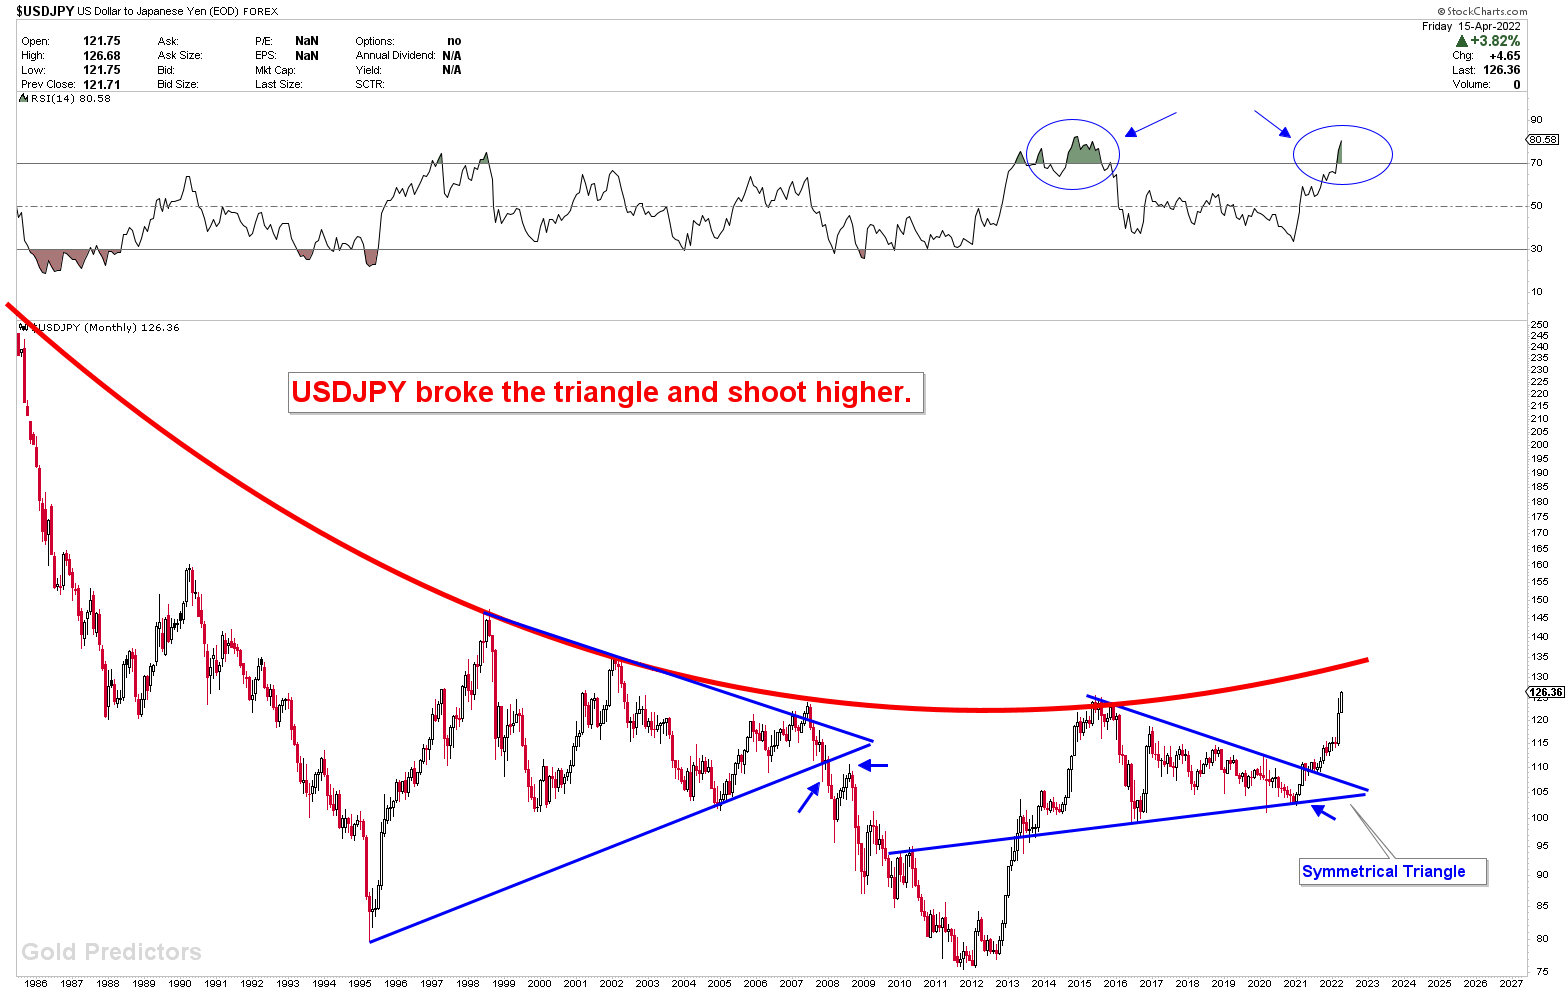
The monthly chart below shows a breakout from the symmetrical triangle, which sent prices skyrocketing. When prices broke out of the symmetrical triangle, the pair gained over 1,000 pips. The pair’s rise can be seen on the daily and weekly charts, which show increased volatility in the instrument. While the pair is trading near a long-term significant barrier, the price is still looking higher ignoring the long term resistances.

A Caution to trader who are looking for Long Side. Be Careful!

Expanded Volatility in USDJPY

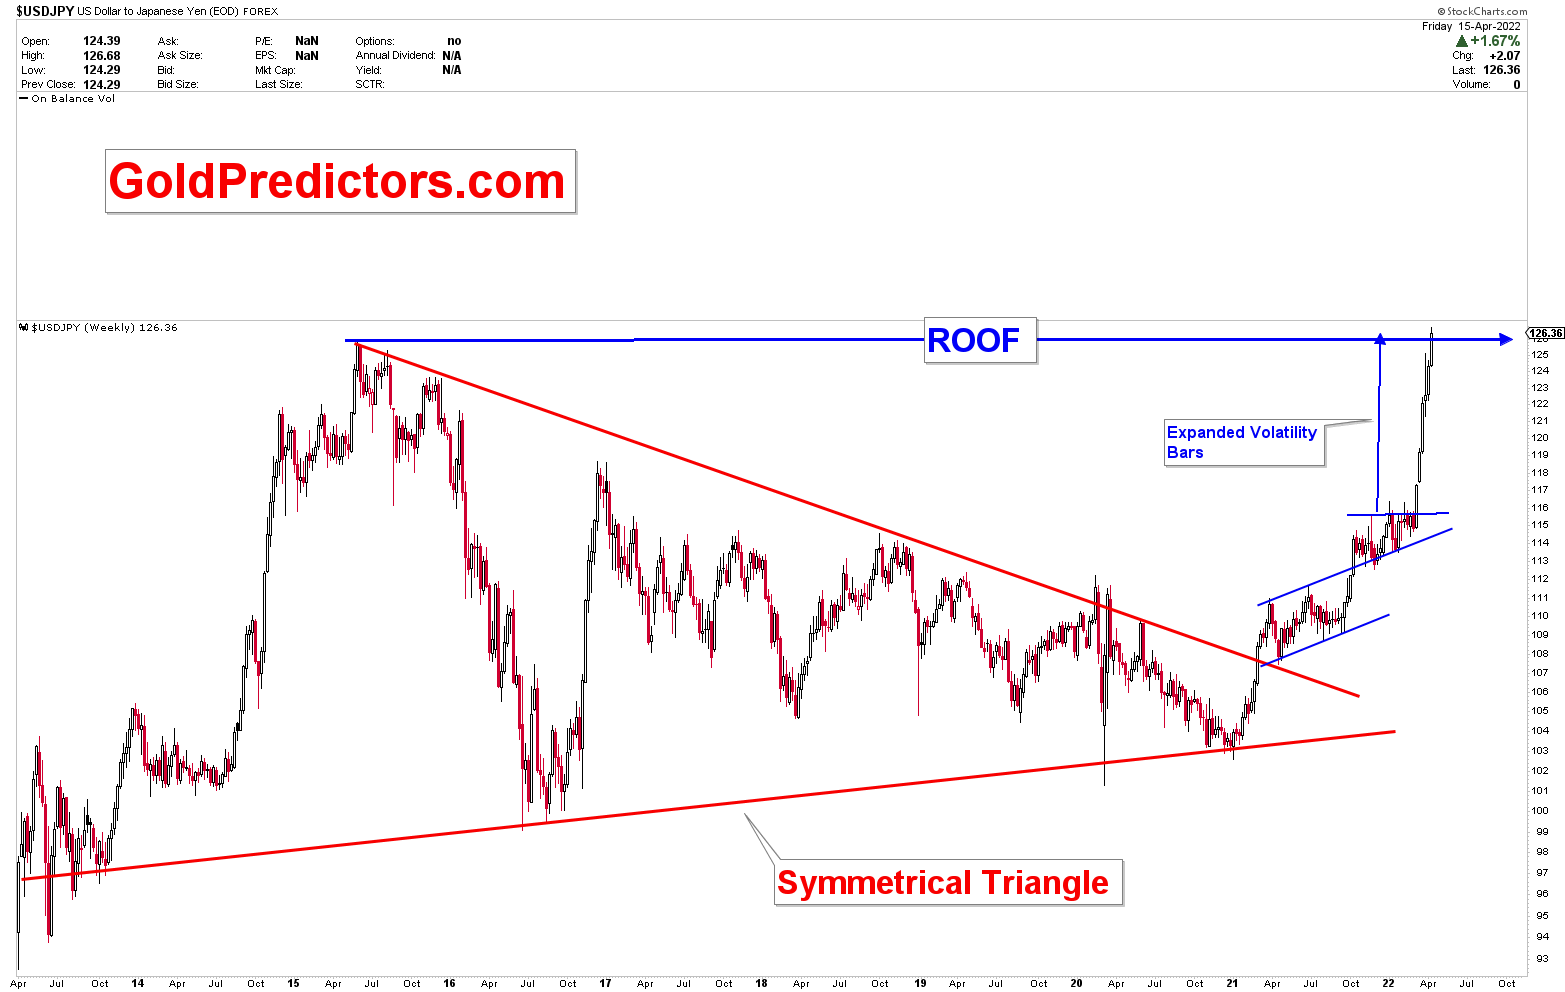
On the weekly chart, the symmetrical triangle on the monthly USDJPY chart can be seen where the breakout occurred. The price moved in blue channels after breaking out of the triangle to stabilize the breakout. The price moved with massive volatility to nearly 1,000 pips after breaking out of the blue triangle. Four weekly candles show the expanded volatility in the instrument. This massive volatility pushed the USDJPY through the monthly and quarterly resistance levels. The pair will likely try to break through the roof before reversing lower to consolidate for a few weeks. Traders are advised to remain cautious during this expanded volatility.

Please subscribe to the link below to receive free updates.

Free Membership

Related posts

silver pattern
May 9, 2025

Silver Bullish Patterns Signal Move Toward $50


Read more
gold pattern
May 8, 2025

Gold Breaks Multi-Decade Resistance as Gold/Silver Ratio Nears Historic Turning Point


Read more
gold pattern
May 7, 2025

Gold Price Breakout 2025: Long-Term Patterns Point to $4,000 and Beyond


Read more

Comments are closed.

ABOUT US

  • About Us
  • Social Networks
  • Industry Links
  • Testimonials
  • Terms & Conditions

TECHNICAL ANALYSIS

  • Technical Analysis
  • Trend Identification
  • Phase Identification
  • Important Levels
  • Volatility Measurement

CYCLE ANALYSIS

  • Gold Cycle
  • Short Term Cycles
  • Medium Term Cycles
  • Long Term Cycles

PRICE ACTION ANALYSIS

  • Price Action Analysis
  • Phase Identification
  • Historical Pattern Identification
  • Candlestick Pattern Identification
© 2017 Gold Predictors. All Rights Reserved.
  • Remember Me
    Lost your password?
    Dont have an account?Sign Up