Silver Squeeze & Gold Coils
Silver squeeze and gold coils; Reddit’s group of traders began to focus on Silver.
According to the Wall Street Journal (29 Jan 2021),
“Nerds versus Wall Street” battle resulted in retail investors acting in unison to collectively even the playing field against these large institutional traders for the first time in history. However, up until this week, their focus was purely on different stocks such as GameStop and AMC. This week Reddit’s group of traders began to focus on one commodity in particular, and that is silver. The power of many can be clearly illustrated in yesterday’s move in silver futures which gained as much as 7% and 4.39% in trading today” Wall Street Journal
The Growing Silver Squeeze
Silver is the industry’s best thermal and electrical conductor and is nowadays so affordable that prices offer investors an excellent chance for the next few years. Because of its special properties, approximately 50% of silver mined annually goes to industrial use (instead of jewelry, cutlery and coinage), and recently increasing electronic demand has an impact on the overall demand for silver. On the other hand, Silver is the next-generation demand for solar power, which impacts the future of silver.
Investors mobilized on social media to concentrate on the silver market following massive short squeeze in stocks such as GameStop, AMC and Blackberry. The one was Reddit. Investors engagement in social media has caused Silver’s sharp boost. This created a demand for silver, while retail investors continued to buy physical metals over the weekend. This hype in the silver market forced many dealers to discontinue orders because of heavy demands and price uncertainty. The overall phenomena have placed considerable pressure on supply and the Covid crisis has not just ended, and additional global lock-down are additional factors, which can lead to silver squeeze.
“Significant Volatility and Price Uncertainty will make MOVEMENTS in Both Directions” Gold Predictors
Our analysis, which we have been discussing for last year, describe the exact phenomena to happen in terms of Huge Volatility. In Gold and Silver, we were extremely bullish, leading the way with an overall G/S ratio to crash. Let’s start to look at the charts to find the best way to enter these markets.
In previous update, we have clearly stated the GOLD DECISION Week. We described that the last week of January 2021 is a decision week, as something was going to develop and change. The big days of 27 JAN and 29 JAN were mentioned as well on social media. That’s because of big divergences in the economical cycles that pointed to it and technical analysis supported that as well. While Gold did not decide anything. ( Read until the end “how GOLD COILS”). However, Silver changed the WAY, while there was a big turn in global stocks last week. The following chart is taken from the last article, which shows the formation of BULLISH BIRD. Why we call it a bullish bird? It is because, after a strong historical bottom in March 2020, it is producing a COMPLEX INVERTED HEAD & SHOULDER BOTTOM. This price action is very rare and when price exceeds 30 level, Silver may fly into the air. However, please check (at the end) which level to watch for supports if Silver gets higher. After all, the current market situation makes it easy to push through the barriers.
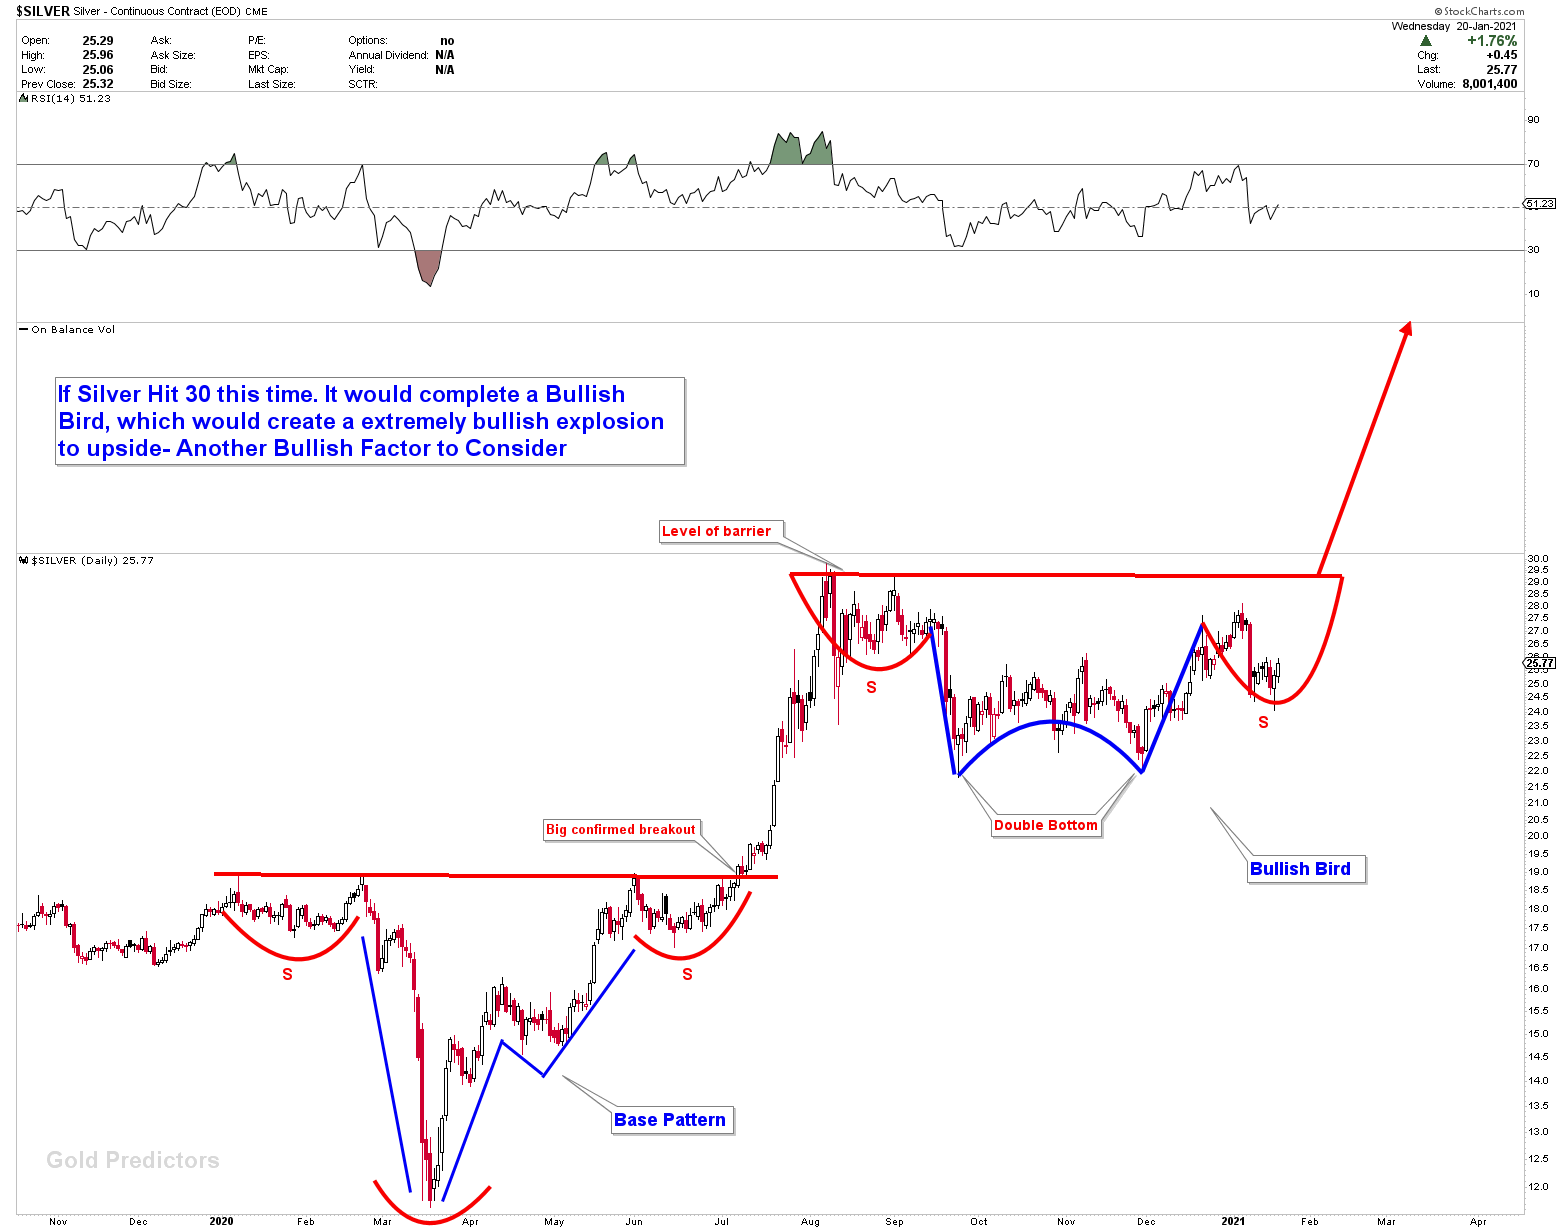
We are Long In Silver At 25.22, taken as short-term trades, Please Expect Frequent Signal Alerts as the time enters into the best trading period of the year.
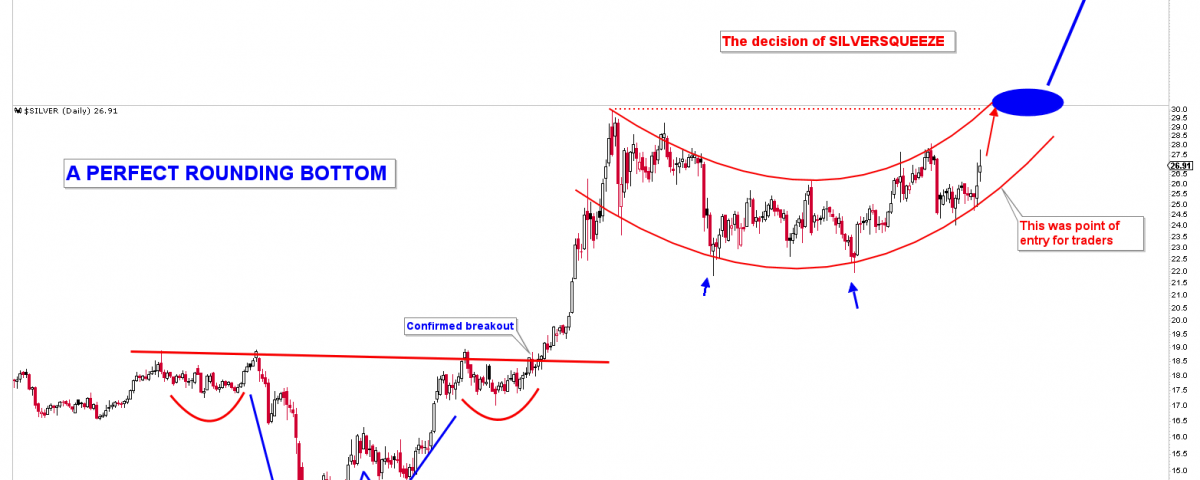
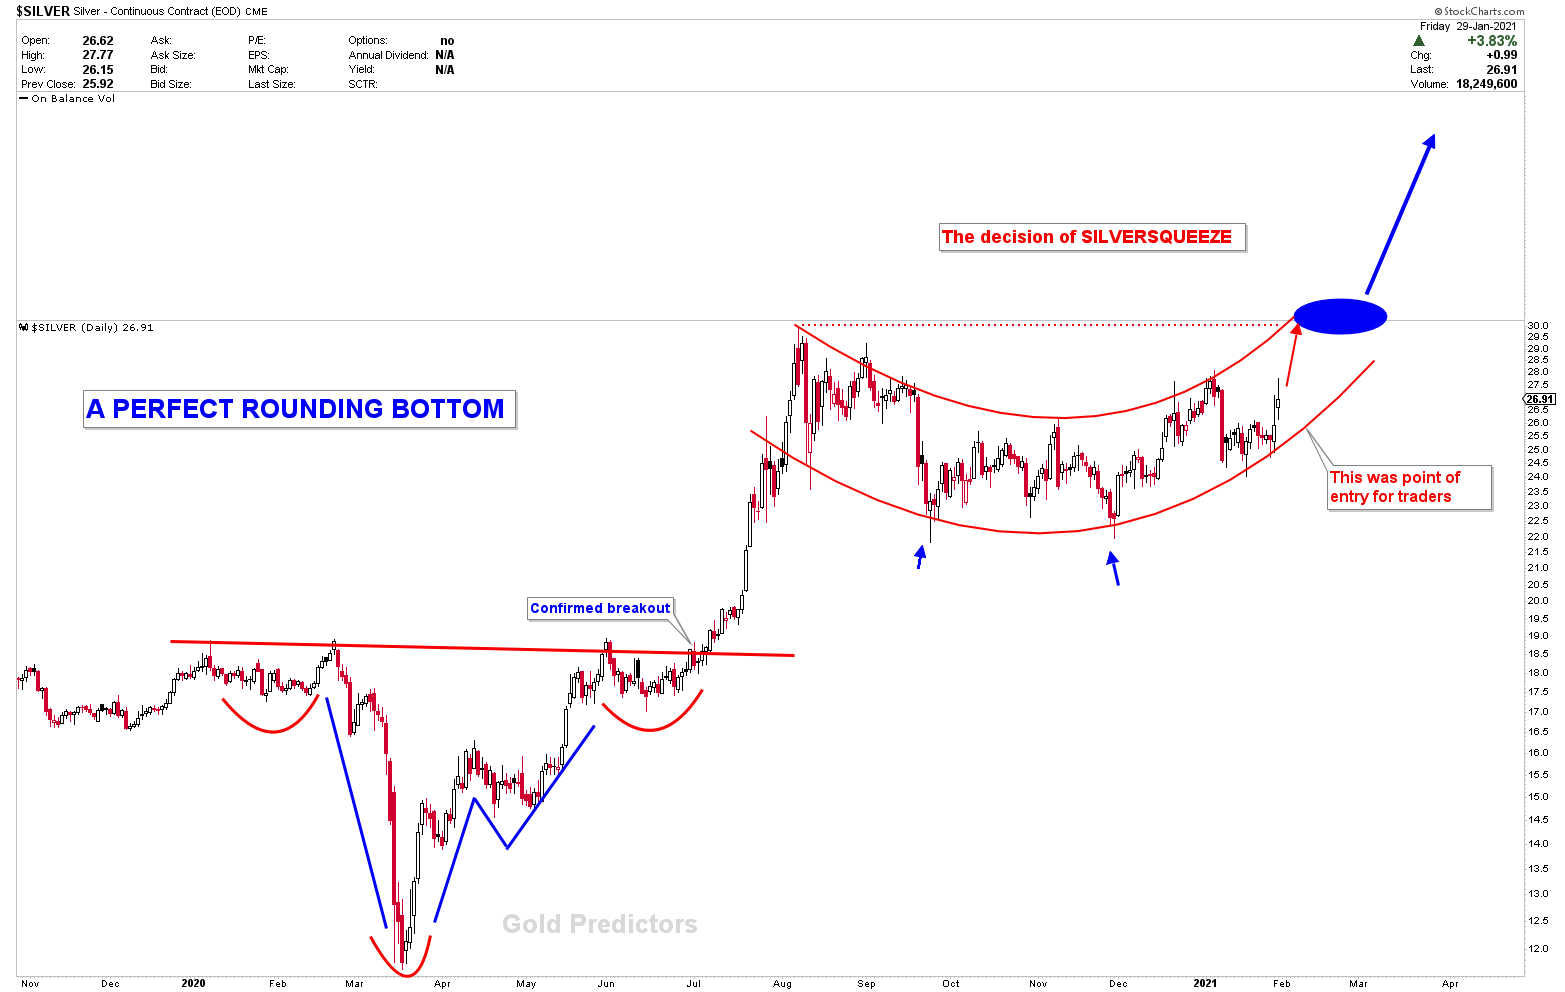
Another Silver chart shows a Perfect rounding bottom. This kind of rounding bottom is very rare to see and suggest that Silver will explode through all barriers.
“Until gold breaks our 1875 number, big ranges might develop. The gold technical outlook remains same as the last Article” Gold Predictors
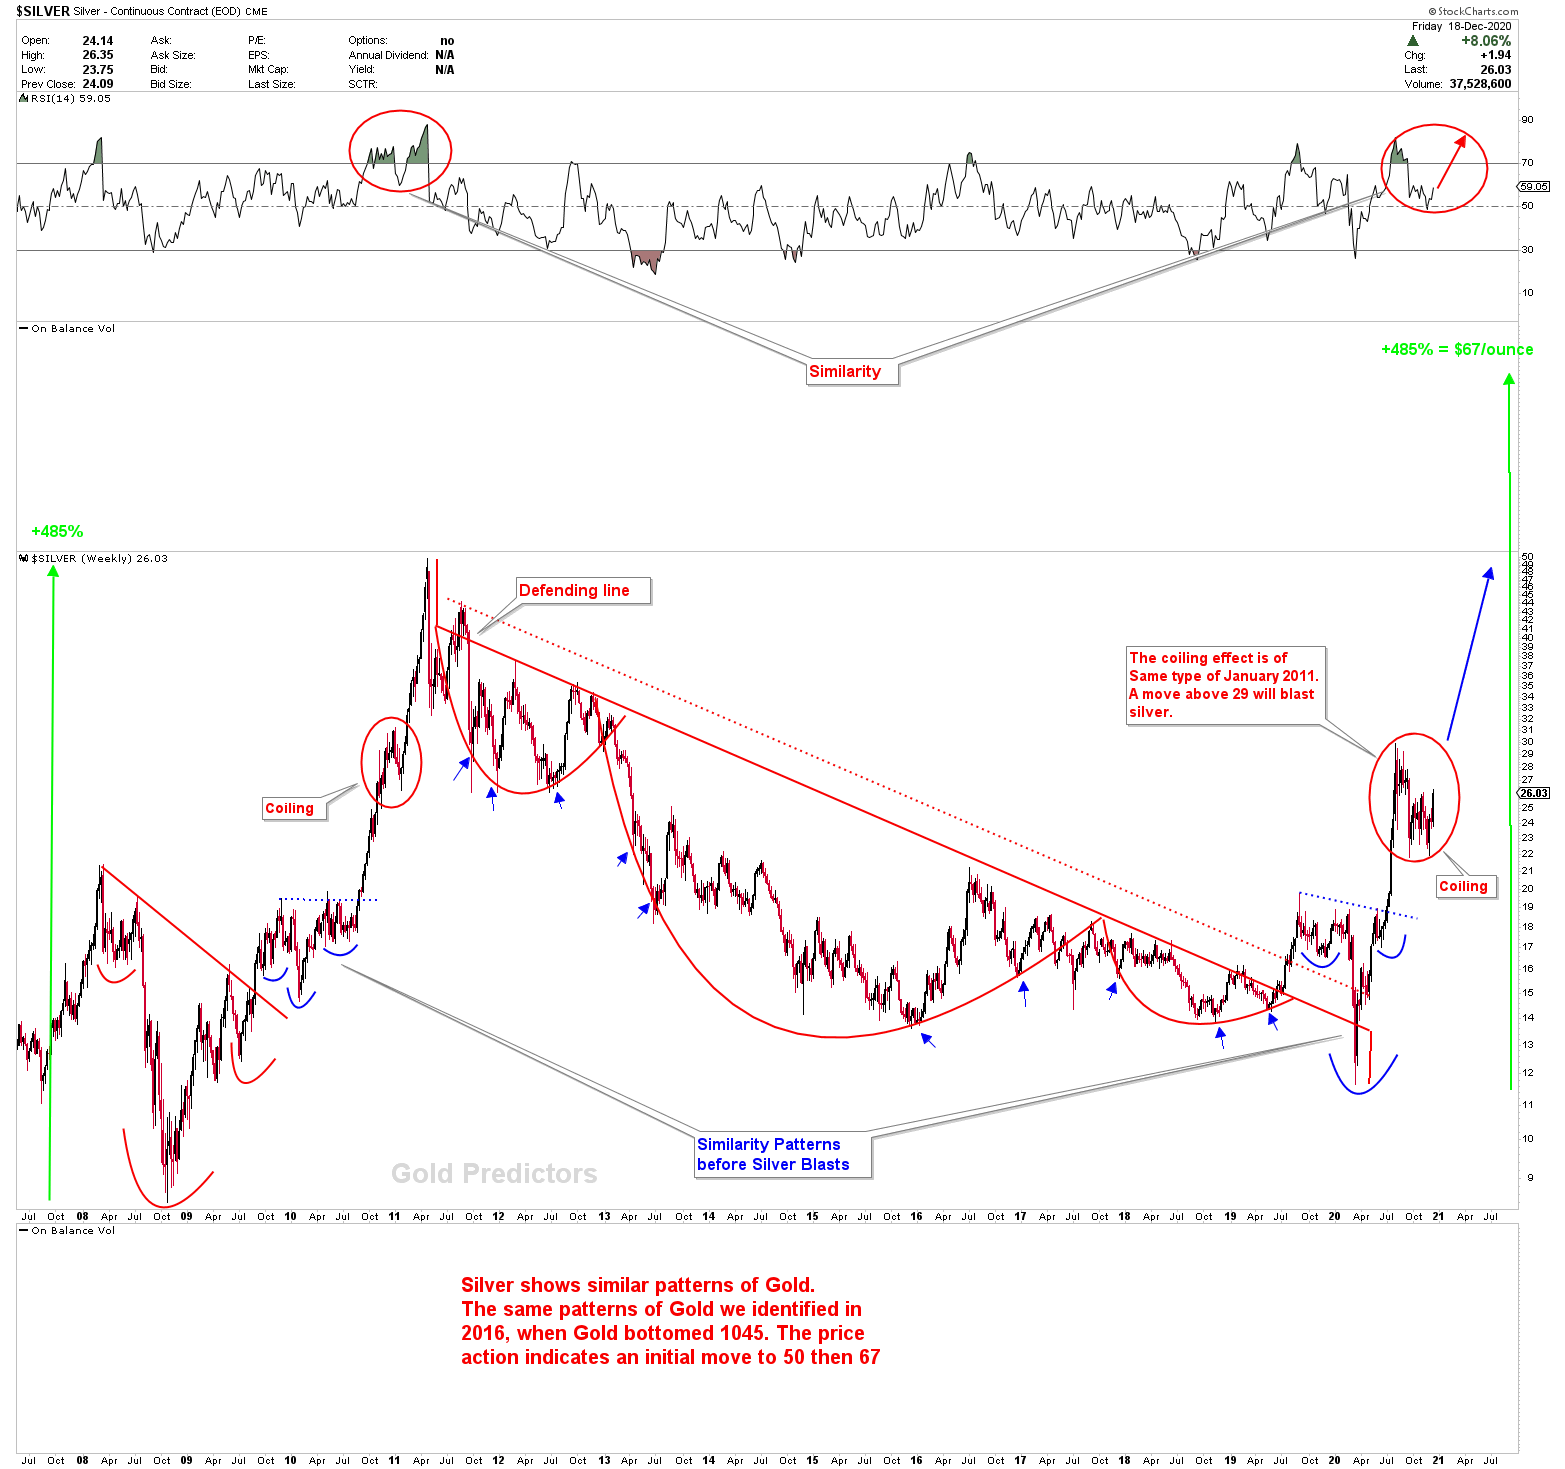
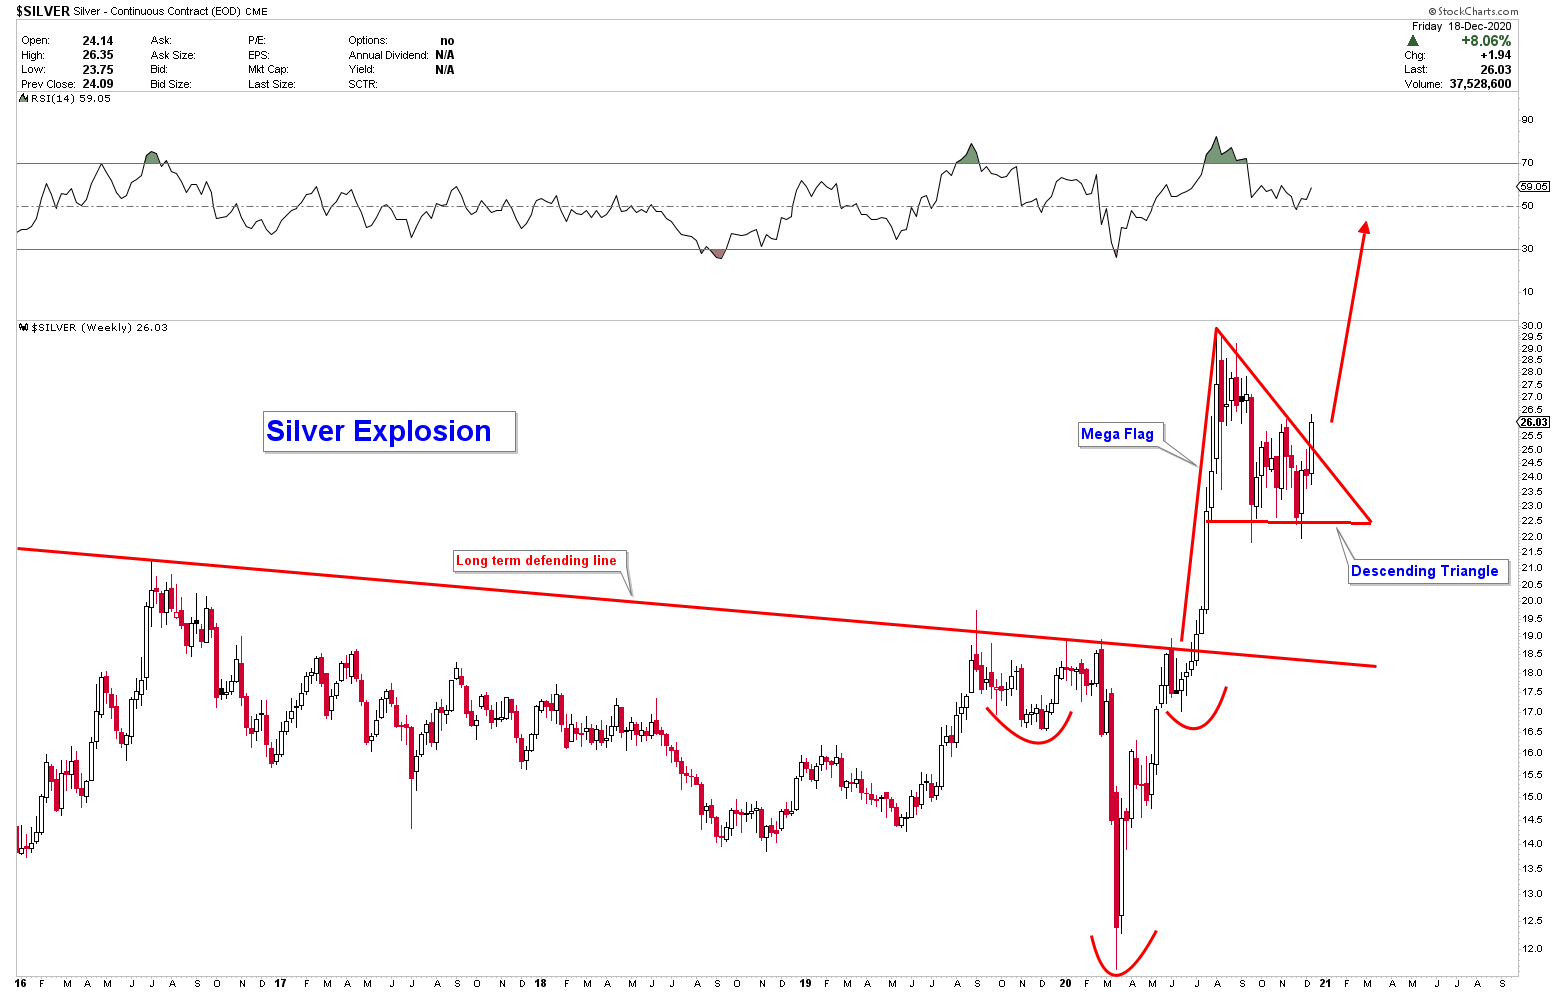
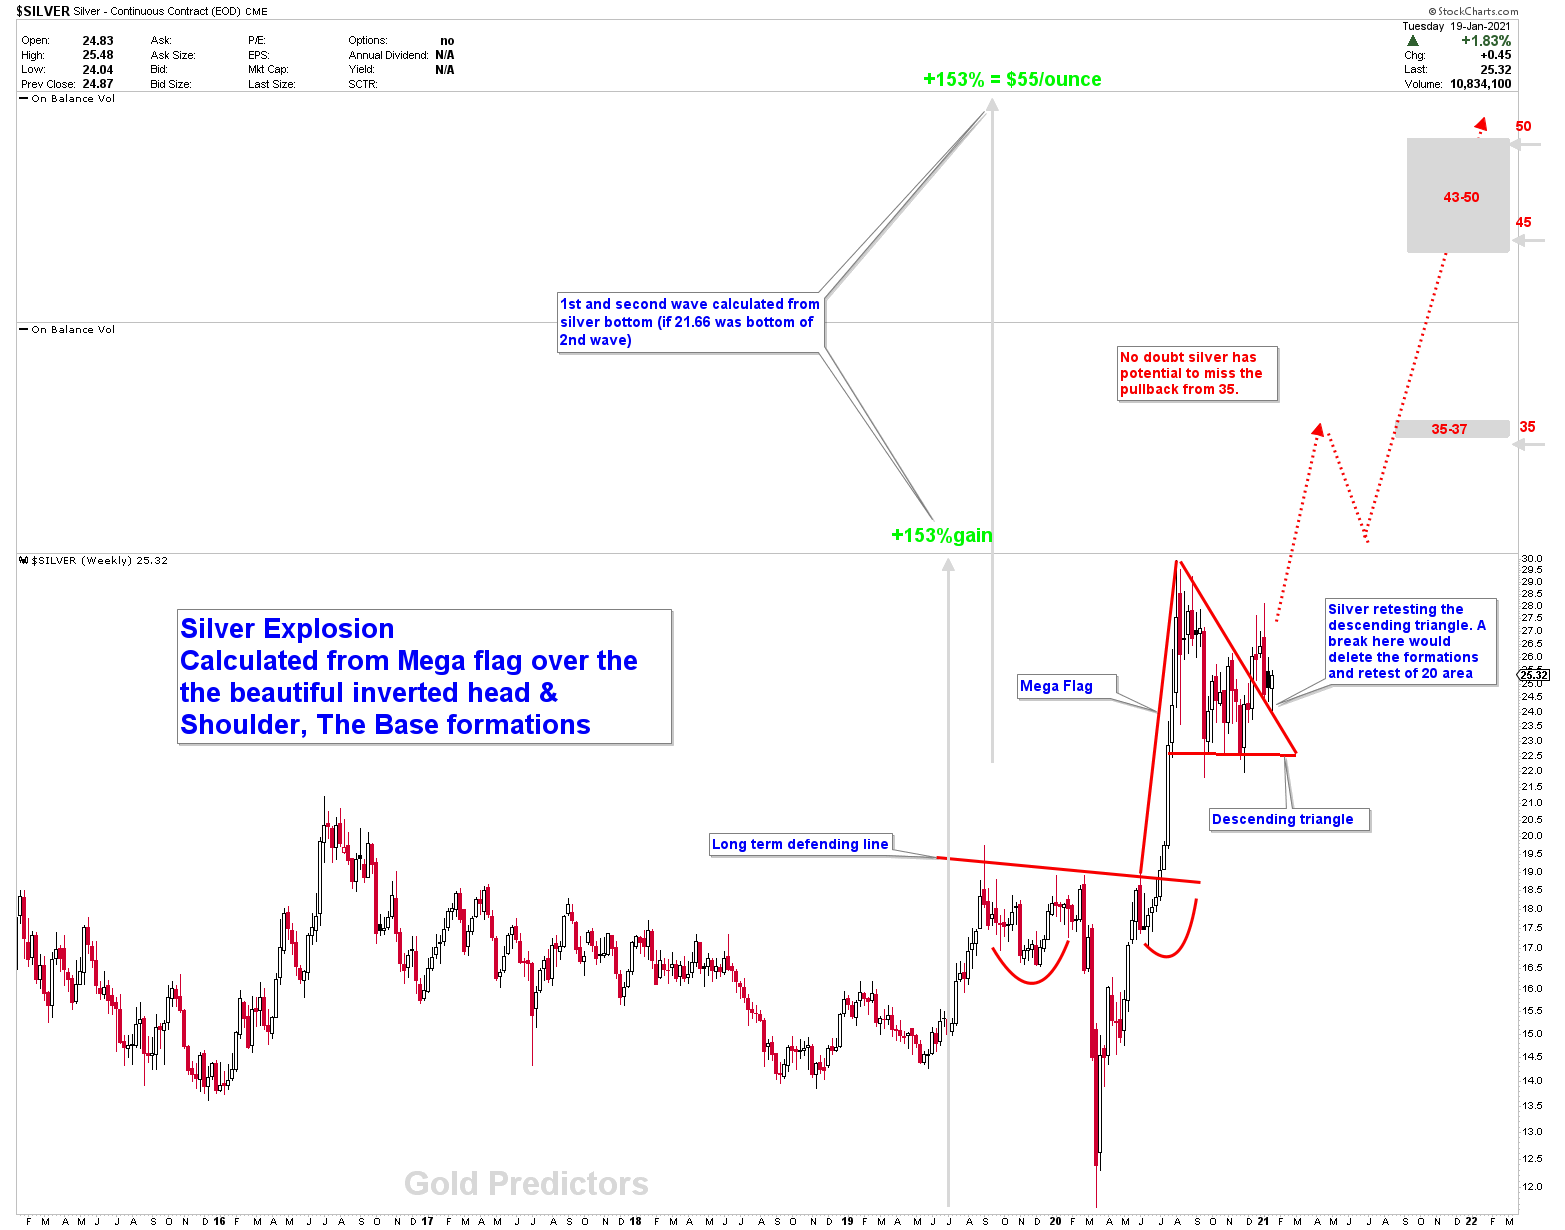
Let’s look at the OLD weekly chart below, we have been discussing since September 2020. The August 2020 pullback in Silver from level 30 was similar to the pullback of 2010, when Silver spin and run to to 50. Silver currently goes through same underlying process and may explode in similar fashion of 2010/2011. The defending lines and the blue inverted head and shoulders have similarities and suggest a move higher. If this pattern is exactly the same and Silver wants to increase it up to 485%(with deviations) from the bottom of 2020 which would bring Silver to $67 {Following Silver price has gained 485% (with deviations) in price from the bottom of the 2008 bottom to the 2011 top}.
Lets have a look on another Silver daily chart, which was posted on 30 November 2020, when silver hit the lower flag line and closed with a wick on the last day of November 2020. This is when Gold traded in 1765 and we executed a Buy Signal in Gold at 1770. To read there, please click here. The chart was good and, as we said, the low was good on 30 November.
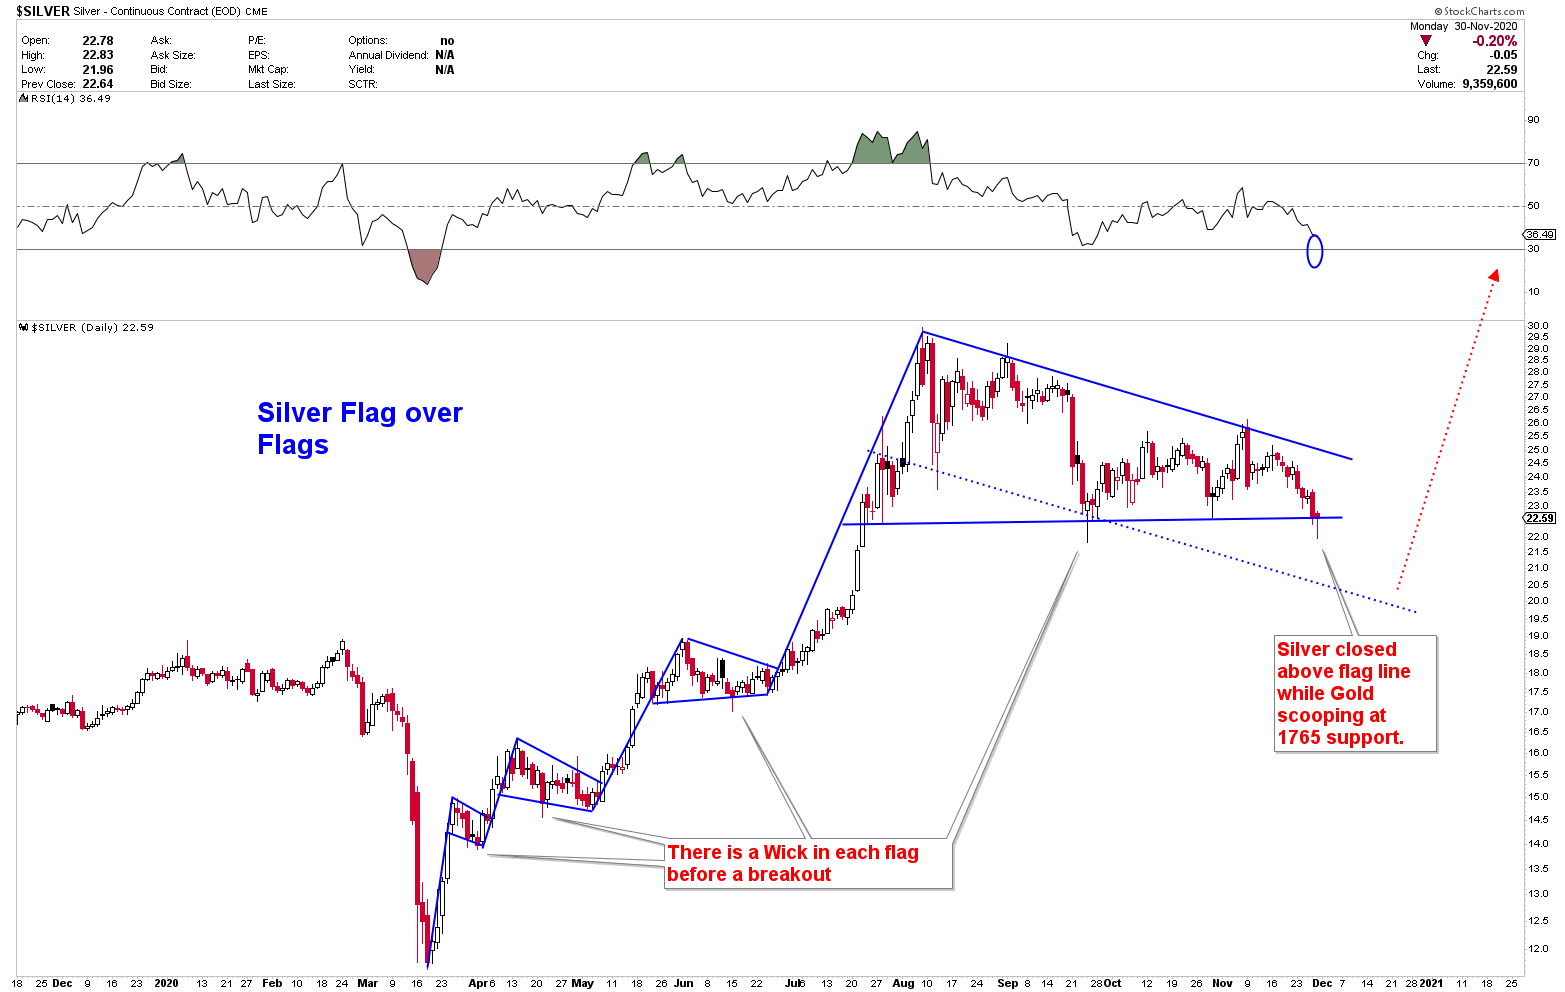
“We have been looking for 22.90 LOW in Silver Since August 2020 pullback started. At the moment of writing, there was No Weekly close below 22.90” Gold Predictors
And this is the reaction to Silver price, the next day.
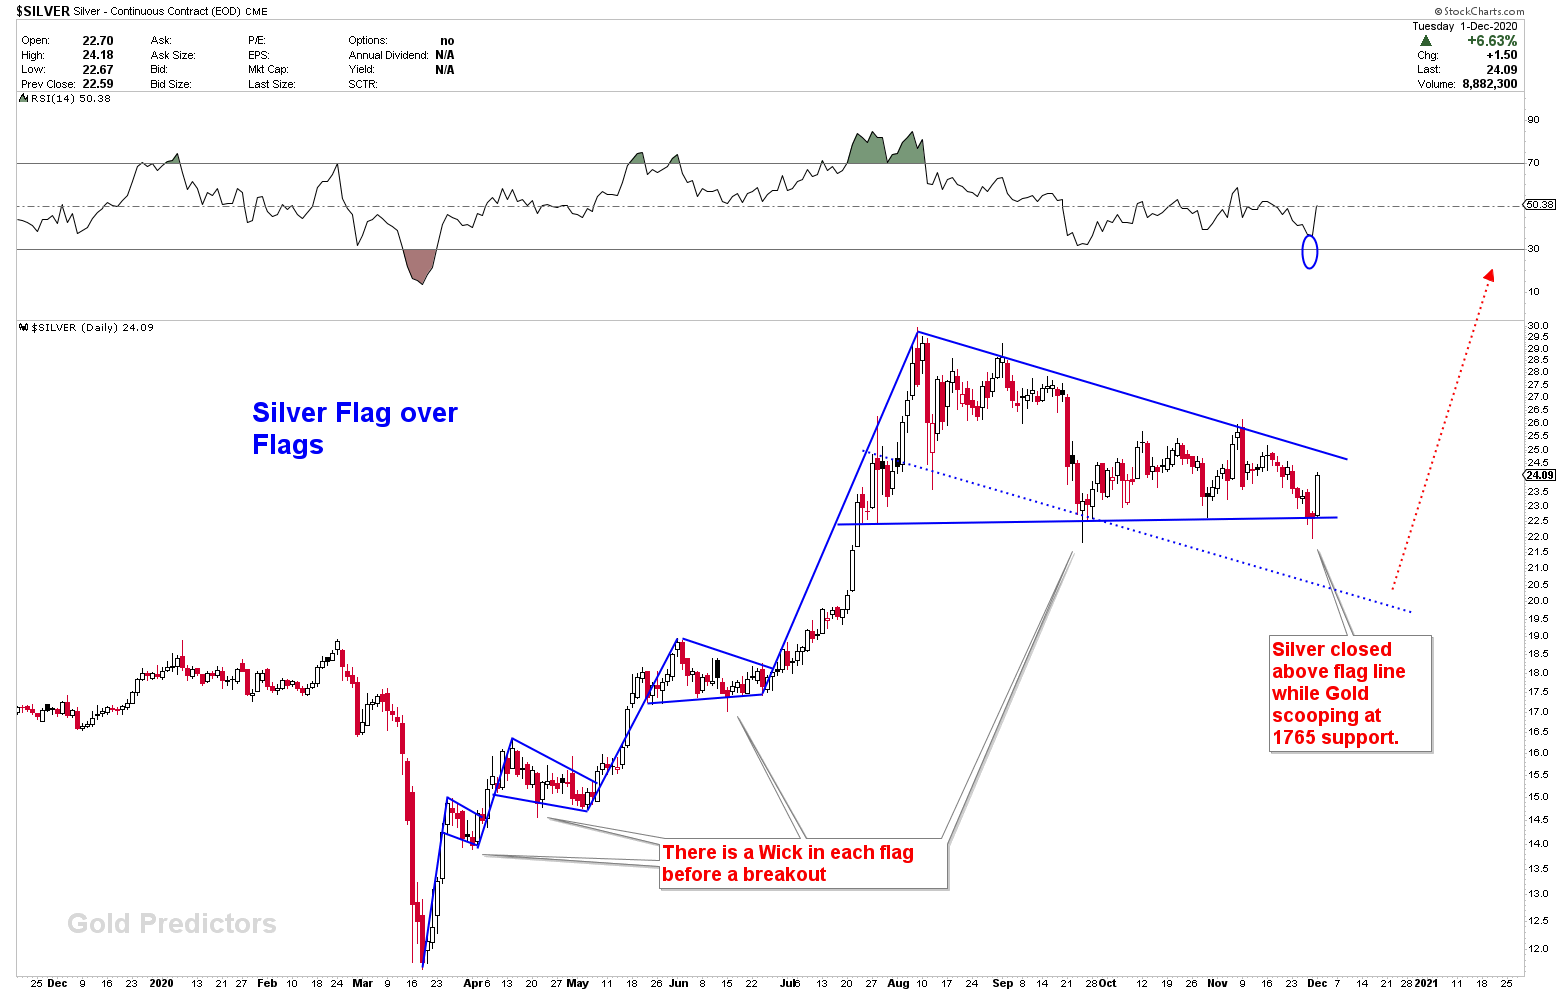
We have been discussing about Silver for a long time, and the time came when Silver broken the Flag, A pullback to the flag was exact touch which served as a buying opportunity as seen in the Figure below.
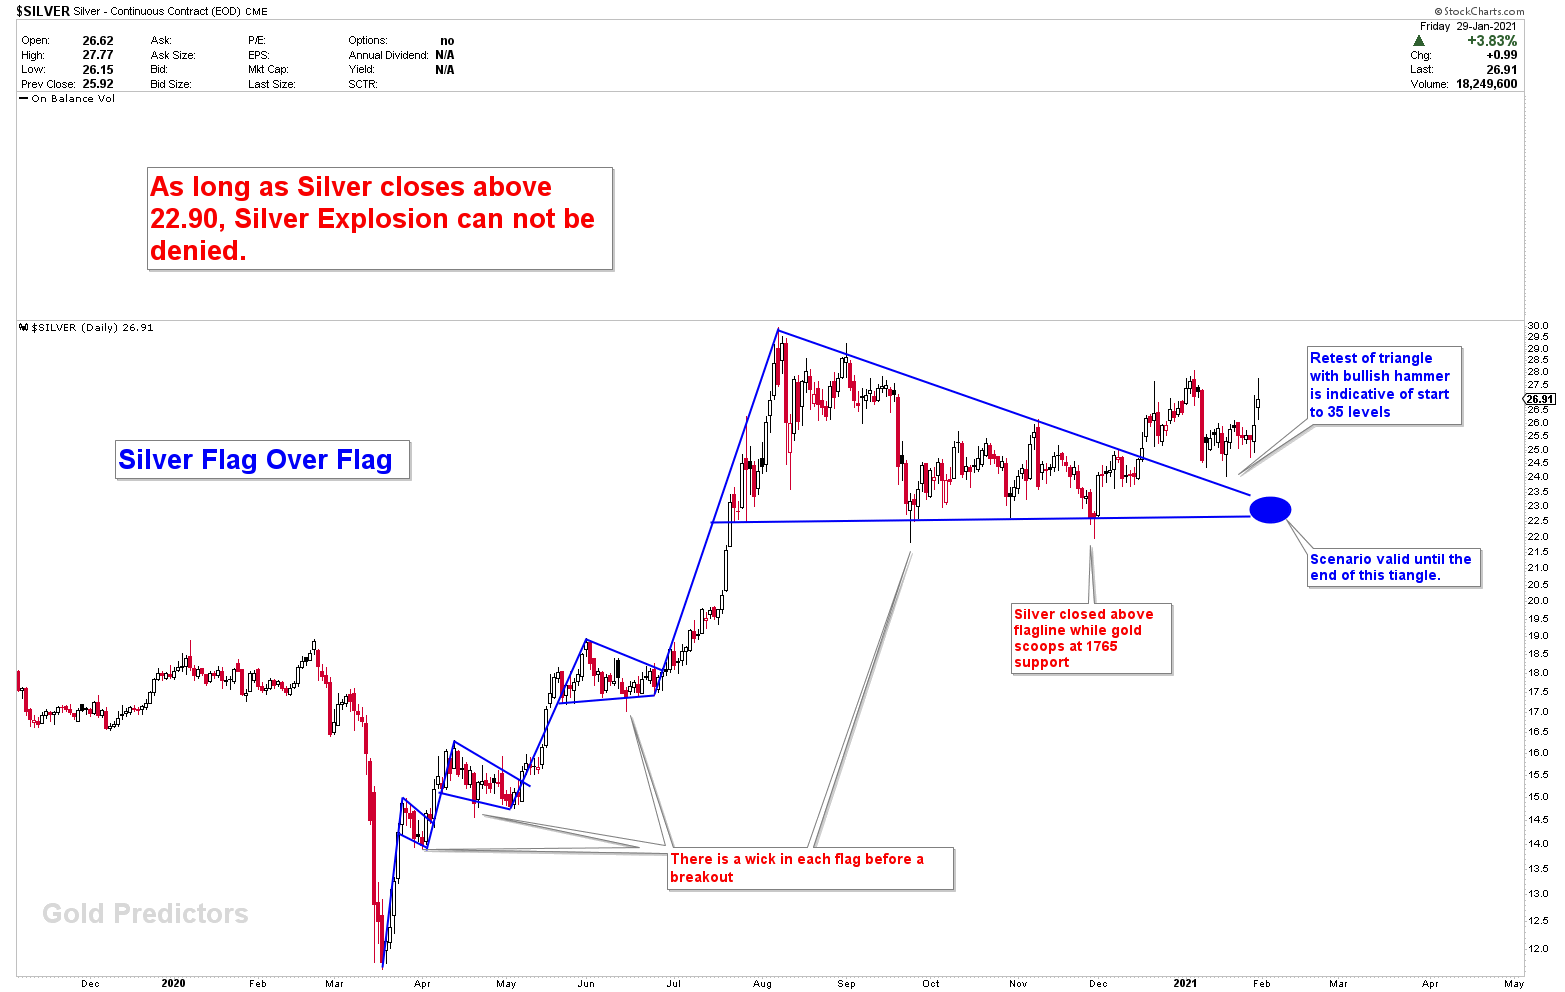
Lets have another look on the patterns that silver has been suggesting to us for last 5 months. These all patterns suggests that Silver Squeeze has no surprise for us. This chart was presented when Silver broke the descending triangle and looked very bullish. And we clearly mentioned that Silver is going to explode in December.
After breaking the descending triangle, silver came back to touch it and produced a clear hammer giving us a strong buy signal. This OLD diagram has not changed and still indicates targets. Silver will continues to fly in the air after a break of 30.
Kind Note for Members! Please expect frequent trading updates. There might be many signals from Feb to July. Remember! The time of March 2020? The same thing might happen again.
Gold Coiling during Silver Squeeze
The rest of the content is reserved for premium members…


