Silver Quarterly Close Signals Major Breakout Ahead

Silver recently achieved its quarterly close for Q3 2024 above $30. However, it is not the highest quarterly close in history. Silver still has much more potential to rise towards the record levels. Recent quarterly data suggests that the trend remains bullish, with targets between $40-$50. While $50 is an all-time high, the resistance is likely to occur at the red trend line in the chart below. This resistance serves as the neckline of the cup-and-handle pattern. The Q3 2024 silver quarterly close suggests that a major breakout may be on the horizon.
Currently, gold has reached record levels, but Silver has not yet done so. Silver is expected to accelerate faster than gold when it breaks through this key level, resulting in a historic move. This is because, during bull markets, Silver typically outperforms gold. The chart below illustrates that Silver gained approximately 10,900% from the 1930s to the 1980s. The historic price moves and the cup and handle formation have created a strong bullish pattern for the silver market.

Understanding the Factors Behind Silver’s Bull Runs
The rally in silver prices from the 1930s to the 1980s was influenced by economic factors, changes in monetary policy, and supply-demand dynamics. During the 1930s, the global economy was recovering from the Great Depression, and Silver was relatively undervalued. The introduction of the Silver Purchase Act of 1934 by the United States government further contributed to its price rise. This act aimed to increase silver reserves, thereby boosting prices as the U.S. Treasury actively purchased large quantities of the metal. In addition, the price of Silver was supported by its use in coinage and industrial applications. Moreover, geopolitical tensions during and after World War II created supply chain uncertainties, increasing prices.
The silver market saw a significant rally in the 1970s and early 1980s. This rally was driven by inflationary pressures, investor speculation, and the Hunt brothers’ attempted market cornering. Rising inflation and concerns over the U.S. dollar’s stability during the 1970s led investors to seek alternative assets. These assets include precious metals, like gold and Silver. The Hunt brothers, a pair of Texas oil tycoons, further amplified the rally by buying large quantities of Silver. This was to control the global supply, pushing prices to unprecedented levels. This speculative bubble peaked in 1980, causing Silver to briefly surge to around $50 per ounce. After this surge, silver resulted in a sharp correction when regulatory actions and market forces burst the bubble.
The Road Ahead for Silver
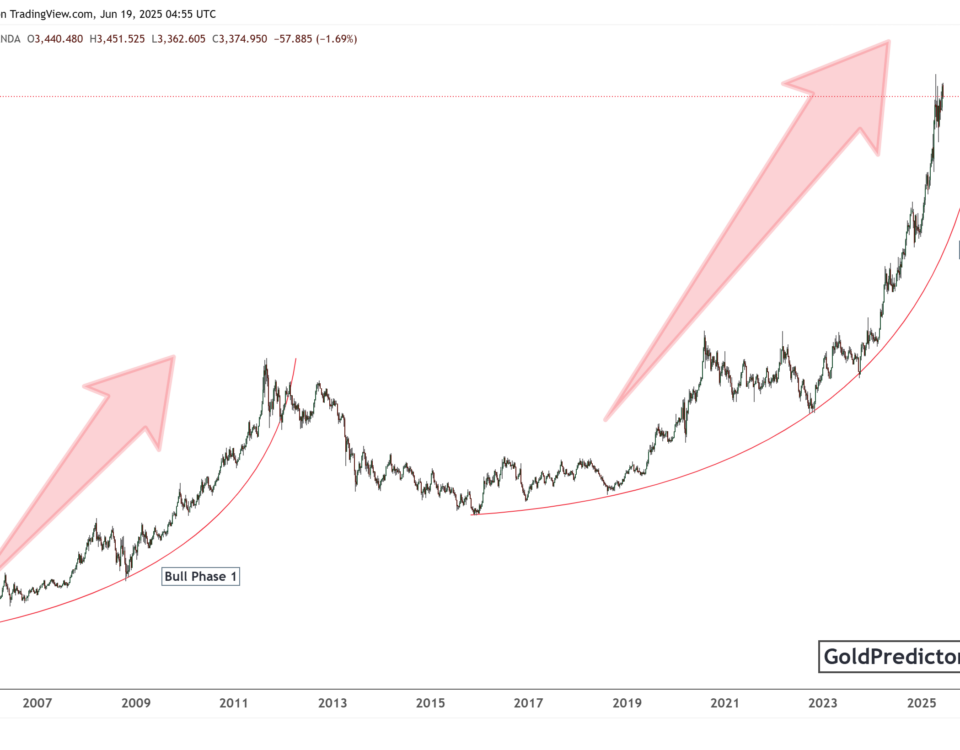
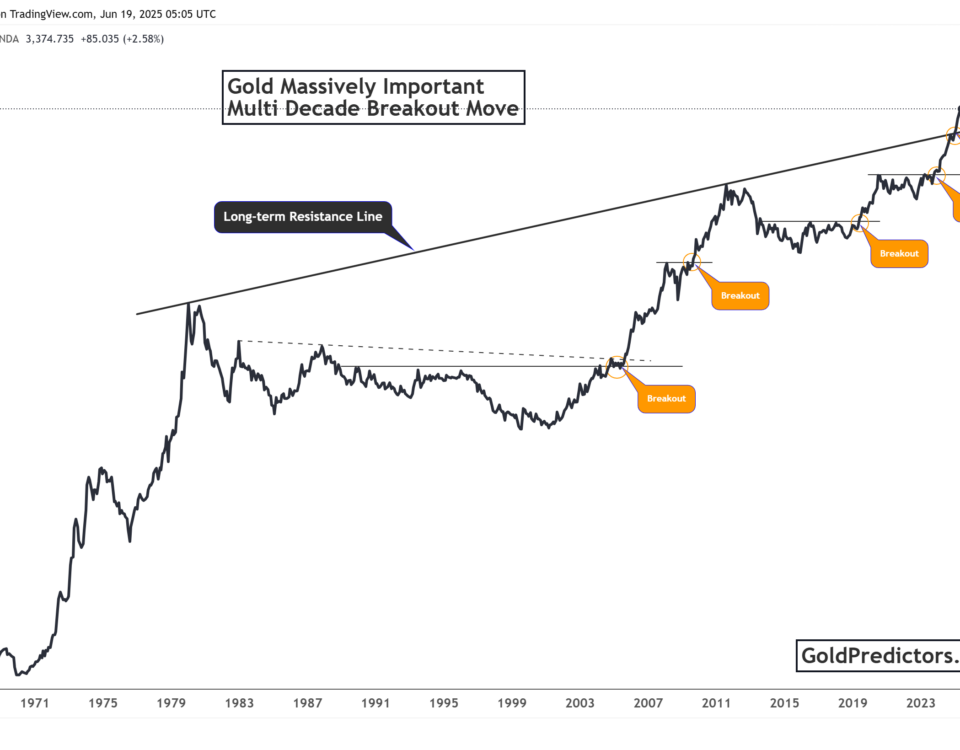
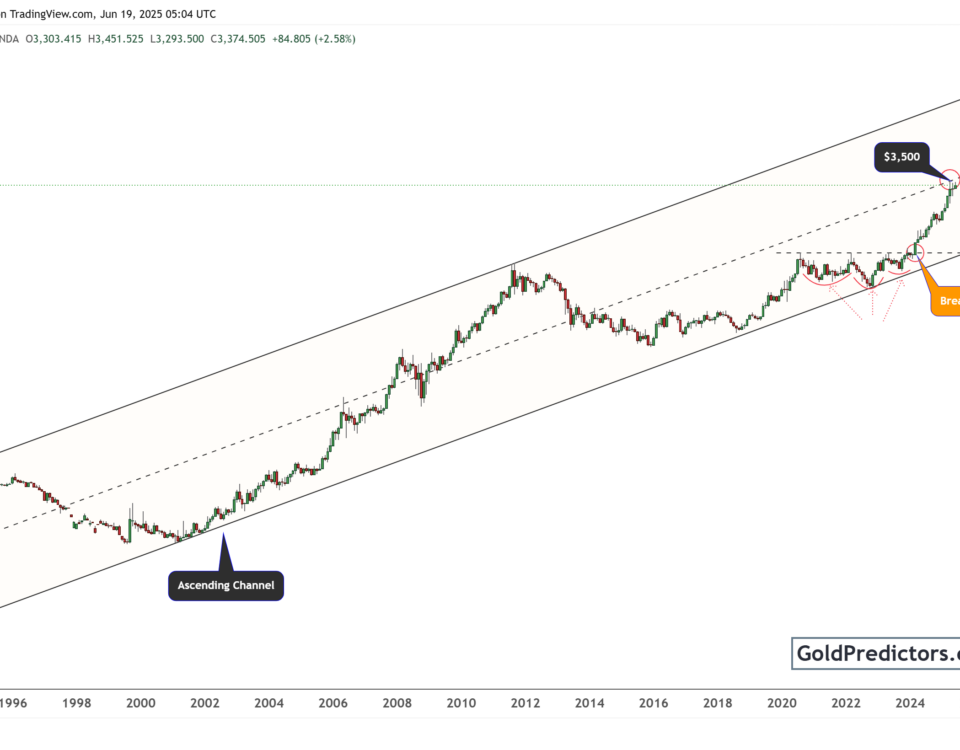
The chart below shows that Silver has formed a cup-and-handle pattern. A breakout above this pattern could lead to a price surge similar to what occurred in the 1940s. When calculating the 10,900% move from the bottom in 1992, Silver can reach as high as $400 in the next few years. While this is a dramatic move, it is still possible based on the historical price action of Silver.

This silver rally could be due to the increased industrial demand, global economic uncertainty, and its role as a store of value. Silver is a critical component in emerging technologies such as solar panels, electric vehicles, and electronics. Therefore, the demand for Silver will likely grow significantly, driving higher prices. Moreover, during economic instability or inflationary pressures, Silver is often seen as a safe-haven asset. The ongoing geopolitical tensions and supply constraints—stemming from mining limitations and potential disruptions—may also contribute to price surges. Furthermore, as the world transitions to green energy and technology-intensive industries, the metal’s dual role as an industrial and monetary asset could amplify its volatility. This could make Silver prone to sharp upward moves during bullish market cycles.
Q3 2024 has closed strong, but significant resistance lies between $40-$50. Therefore, Q4 2024 is likely to encounter challenges at these levels. The $30 mark also serves as the yearly pivot, indicating that a year-end close above this level in 2025 is required. A yearly close above this level will trigger a strong surge in the silver market for the next few years.
Conclusion
In conclusion, Silver’s historical price patterns and dual role as an industrial and monetary asset position it for potential explosive rallies in the coming years. Forming a cup-and-handle pattern could lead to a significant price surge, similar to past bull markets. Factors such as increasing industrial demand, economic uncertainty, and its appeal as a safe-haven asset make Silver a compelling investment in the coming decades. While gold has recently hit record highs, Silver has lagged, indicating room for substantial growth. This growth will likely appear once it breaks through key resistance levels. If history repeats itself, Silver may reach previous all-time highs and potentially surpass them. The break above all-time highs will induce a significant surge in the silver market based on the bullish price developments. The $50 in spot silver market remains the key level. The Q3 2024 close above $30 indicates a major breakout above $50 might be on the horizon.
To receive gold and silver trading signals, please subscribe using the link below.


