


Silver is Ready for Next Price Surge

- CPI data today will significantly influence the Federal Reserve’s monetary policy decisions.
- Softer inflation could bolster expectations of a Fed rate cut, weakening the US Dollar and potentially boosting silver prices.
- Strong inflation may delay rate cuts, supporting the Dollar and exerting downward pressure on silver prices.
- Silver has formed a strong bottom in the short term, with technical patterns suggesting a potential rally towards $32.50 and higher, particularly if key resistance levels are breached.
The expected increase in the US Consumer Price Index (CPI) at 3.1% YoY in June, slightly lower than May’s 3.3% increase, and the steady annual core CPI inflation at 3.4%, are key indicators for the Federal Reserve’s monetary policy decisions. This inflation data could significantly influence the Fed’s stance on a potential rate cut in September, thereby affecting the valuation of the US Dollar. A confirmed softer inflation reading might bolster expectations of a Fed rate cut, potentially weakening the US Dollar. This scenario would be favourable for the silver market, as a weaker Dollar generally boosts the attractiveness of silver as an investment, driving demand and potentially increasing prices. Conversely, if inflation remains strong, the Fed might delay rate cuts, which could support the Dollar and exert downward pressure on silver prices.
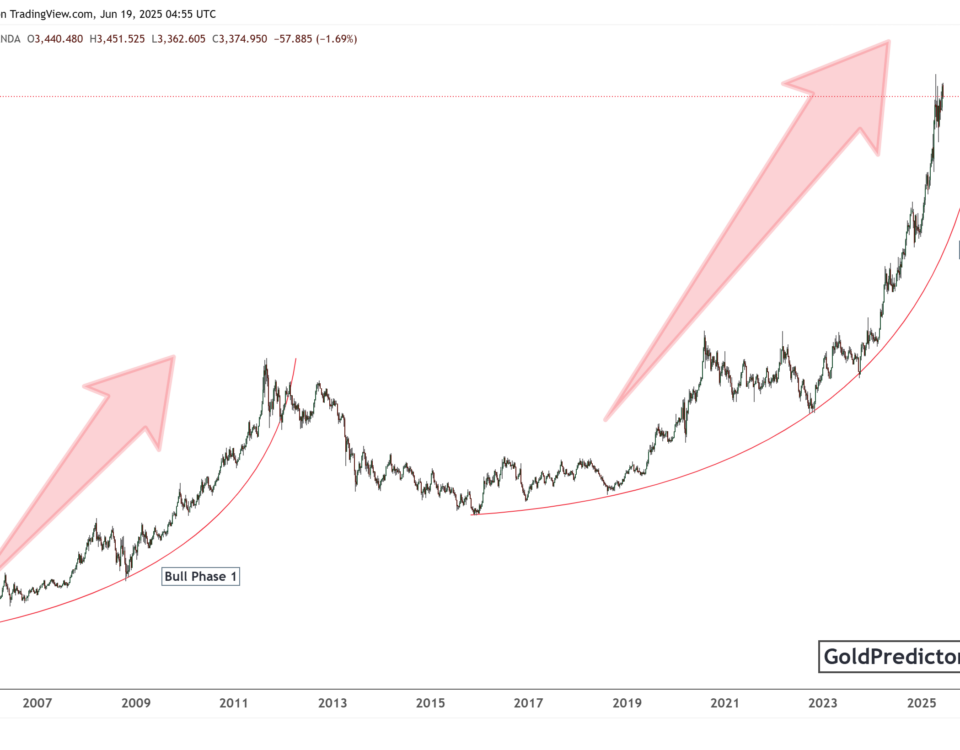
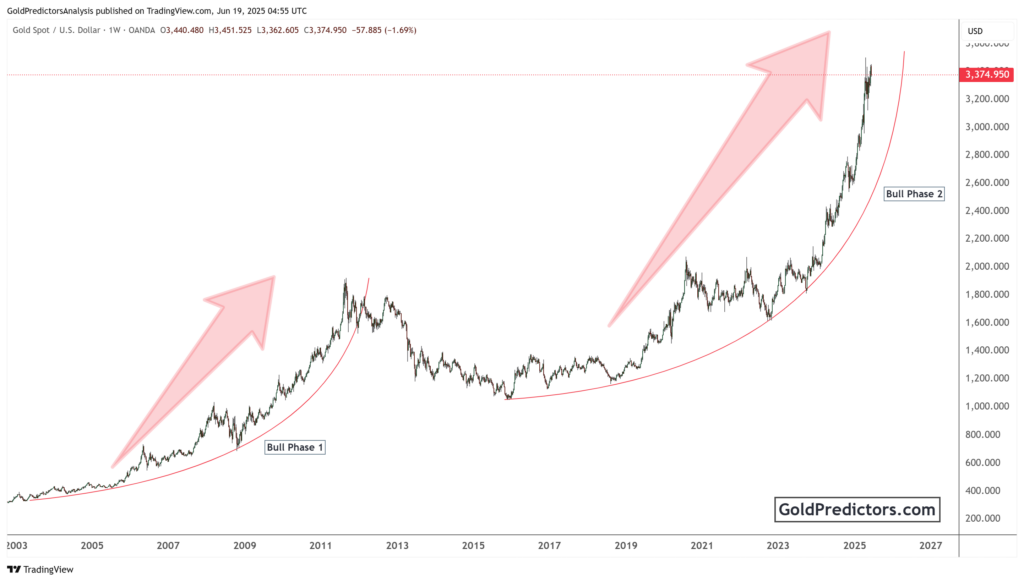
However, silver has emerged from a strong bottom formation in the short term which indicates that the next significant price rally is likely to start from here. The cup formation below highlights that the fluctuations of May and June have set up the bottom, and July will further stabilize the prices, with August potentially seeing a surge in prices. The cup also highlights the trend line, which serves as a barrier before today’s CPI release. A break above this trend line will initiate the next surge in silver prices towards $32.50 and higher.

This bullish price structure is further clarified by the hourly chart, which shows the formation of an ascending broadening wedge pattern that started in the last week of June 2024. This pattern has demonstrated a quick reversal, marked by the blue arcs in the chart below. These arcs point towards the $31.20 level, and a break above this level will initiate the next surge to $32.50 in the short term. Overall, this pattern indicates that prices have begun the next rally to higher levels.

Bottom Line
In conclusion, the CPI data today will significantly influence the Federal Reserve’s monetary policy decisions. Silver shows a strong bottom formation, with technical patterns indicating a potential rally, especially if prices break key resistance levels, pointing towards a surge to $32.50 and higher in the short term.
To receive gold and silver trading signals and premium updates, subscribe using the link below.