


Silver Bullish Patterns Signal Move Toward $50
Silver (XAG/USD) has entered a technically significant phase after forming one of the most powerful bullish reversal patterns in technical analysis—the cup and handle. This classic formation spans over a decade and highlights the growing momentum in silver’s price structure. In this context, this article discusses the technical patterns from both the long-term and short-term charts in order to assess the next move for silver prices.
Long-Term Bullish Pattern in Silver Suggests a Move toward $50
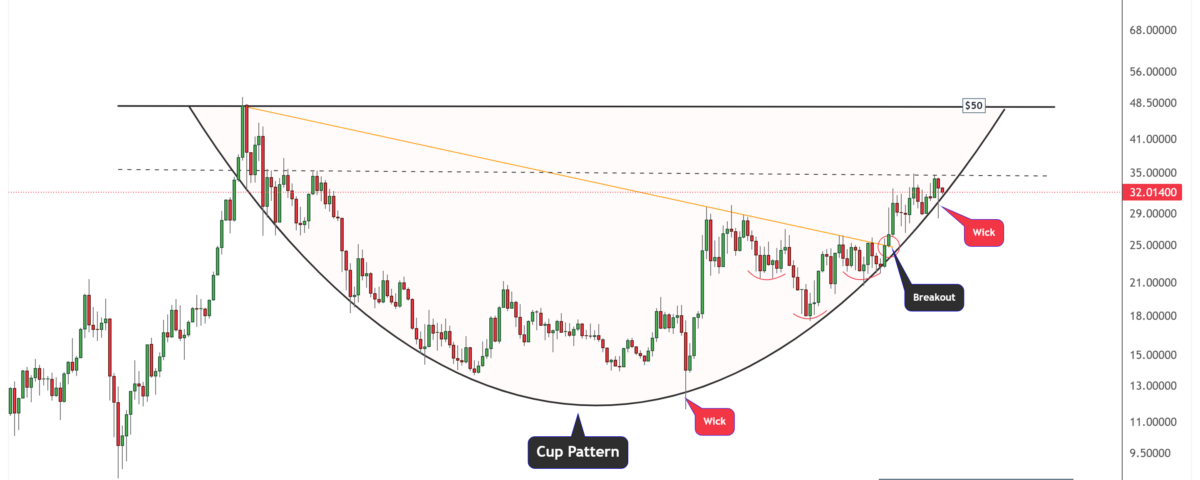
The silver chart below shows a powerful long-term monthly view of silver. A textbook cup pattern has developed since the 2011 peak near $50. Following the sharp decline after the 2011 high, silver consolidated in a wide base, forming the rounded bottom of the cup between 2013 and 2020. This prolonged sideways action helped build a strong support foundation.
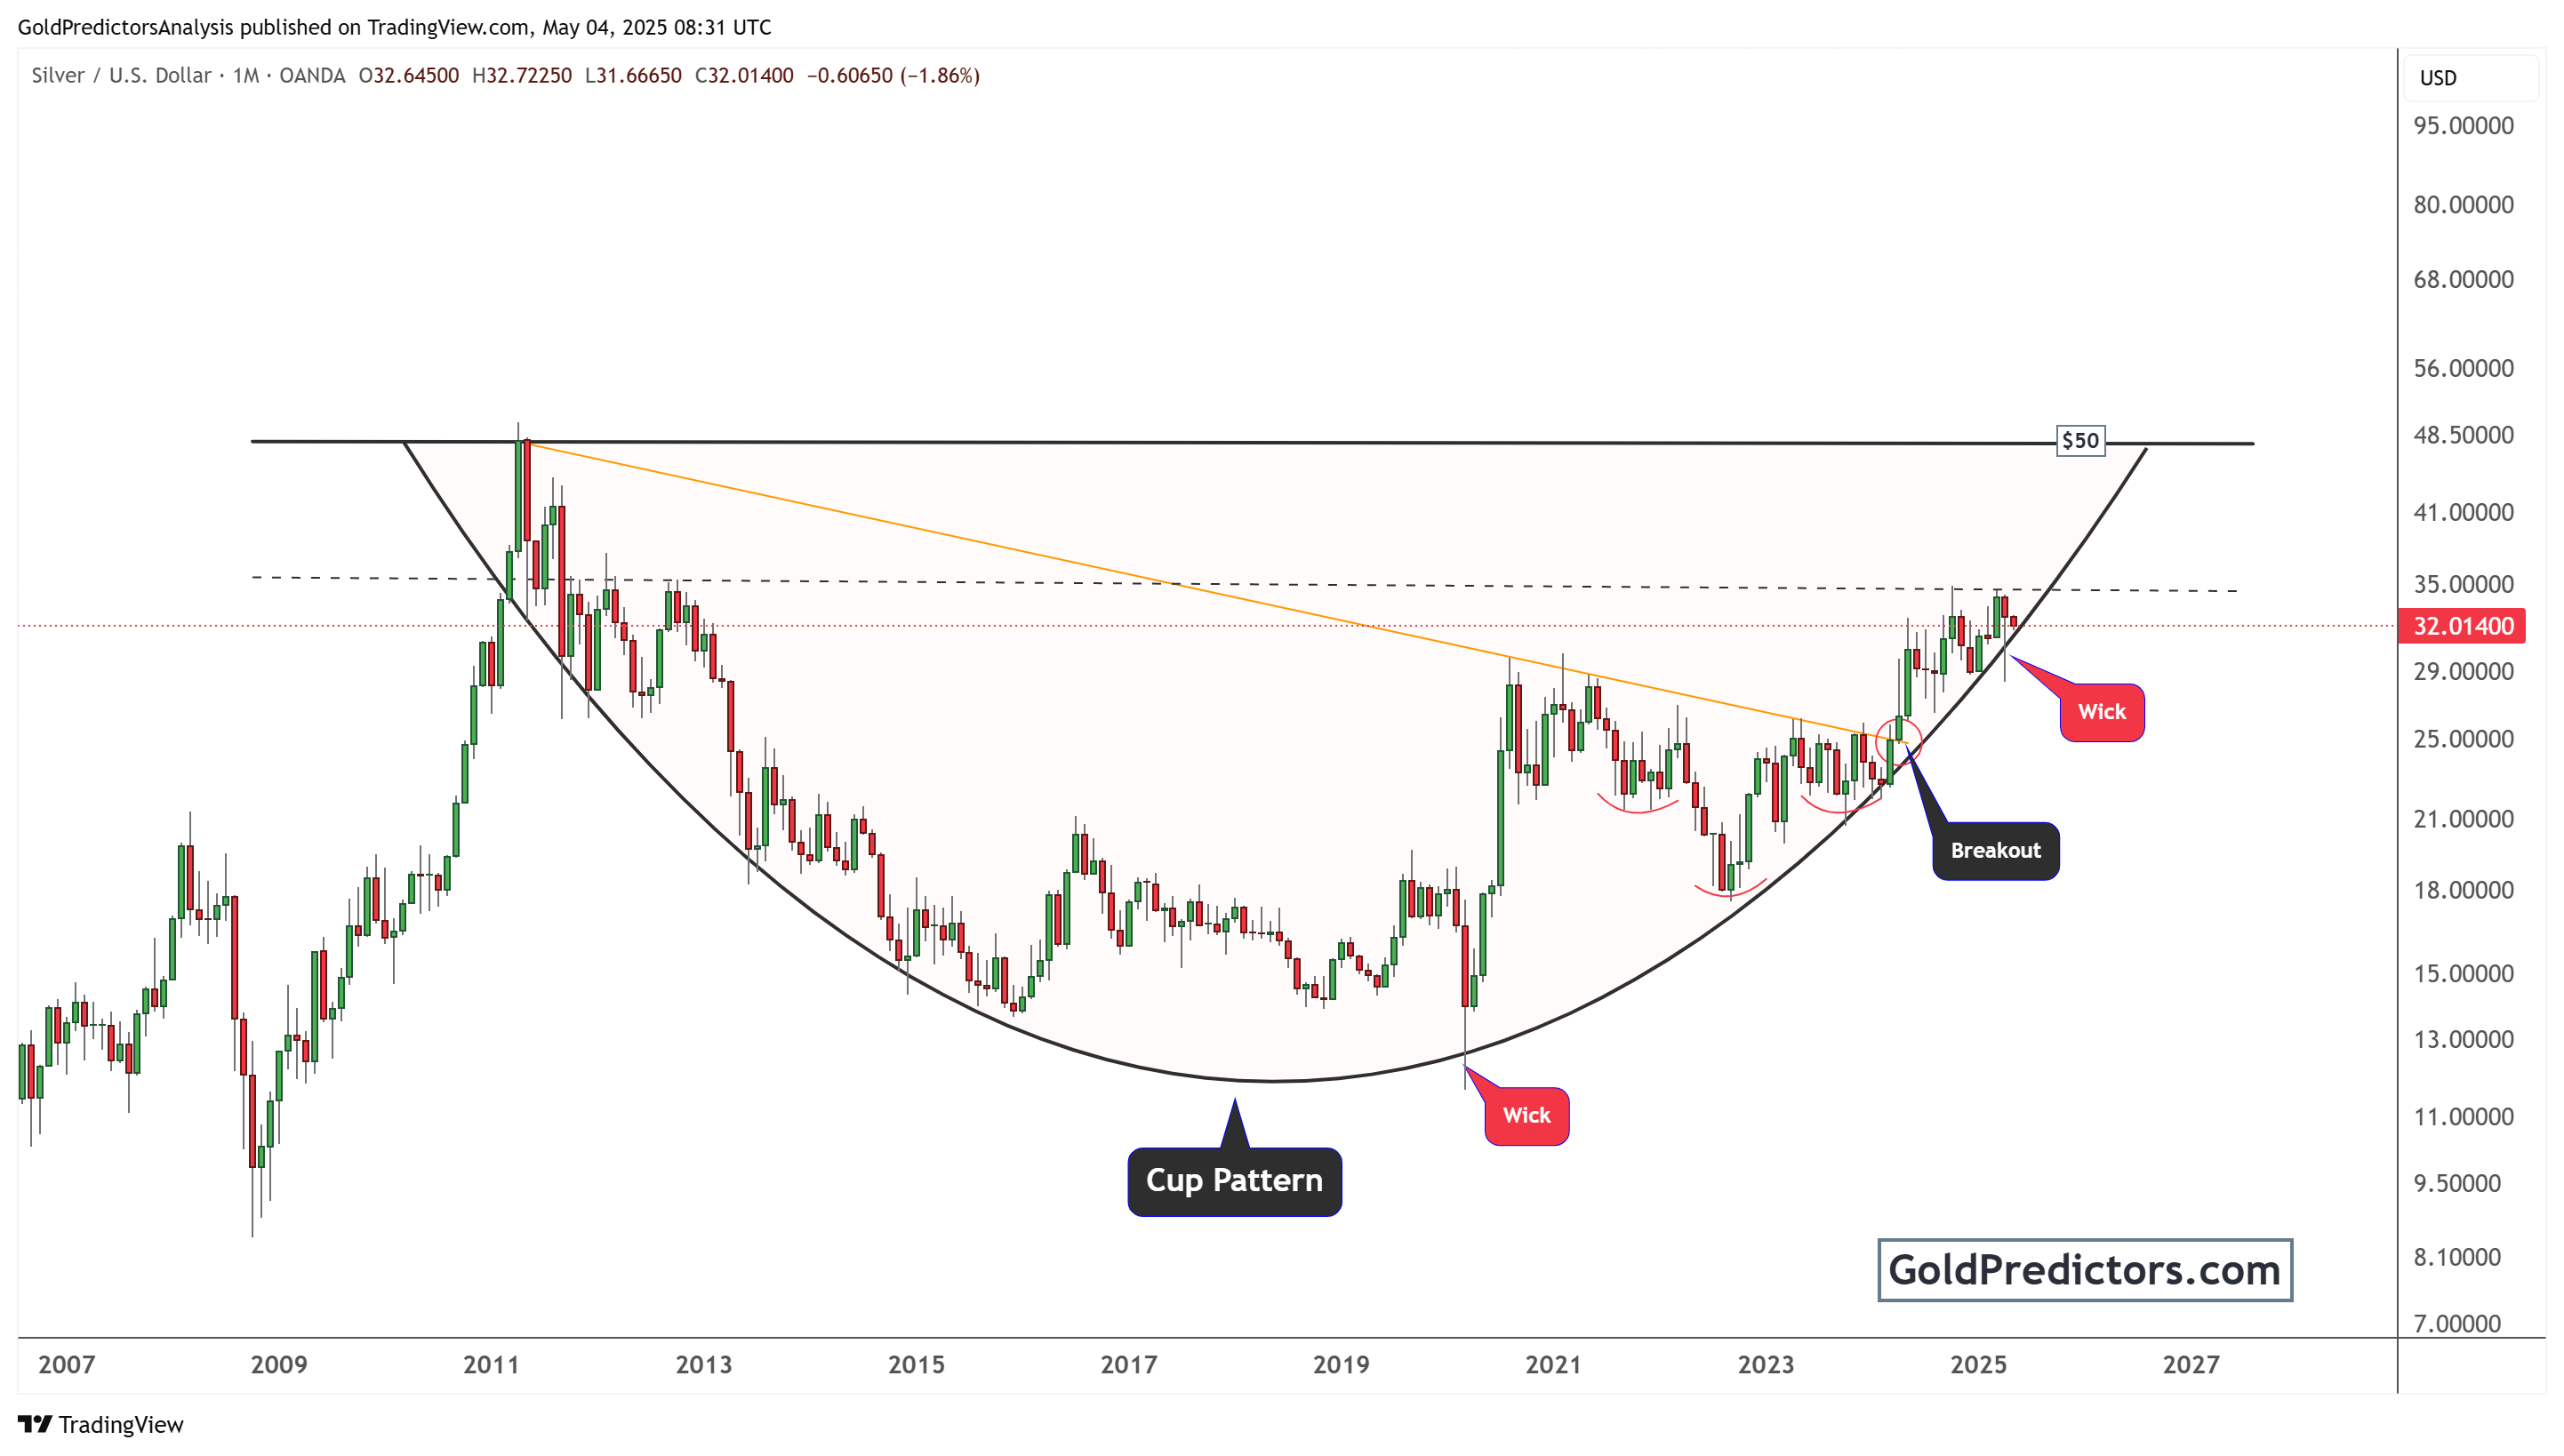
In 2020, silver attempted a breakout with a sharp wick to the upside, but it failed to sustain the momentum. A subsequent correction created the handle portion of the cup. This handle is crucial as it helps to flush out weak hands and consolidate gains before a breakout.
In 2024, silver broke above the multi-year descending trend line, confirming the breakout point around $26. This breakout occurred with strong bullish candles and higher volume, supporting the move. After the breakout, silver has formed a wick near the $35 area, indicating short-term resistance. However, the pattern suggests a breakout above this wick could trigger a major rally to the $50 level.
This chart aligns with classical technical analysis. The depth of the cup projected upward from the breakout zone implies a target that matches the previous all-time high. The breakout above a multi-year resistance also signals a structural change in the long-term trend.
Silver’s Daily Chart Reveals Inverse Head and Shoulders Patterns
The chart below shows a daily view of silver’s price action over the last five years. The chart shows a series of inverse head and shoulder patterns, which are bullish reversal setups. These patterns acted as springboards for upward momentum as silver kept testing the downtrend resistance.
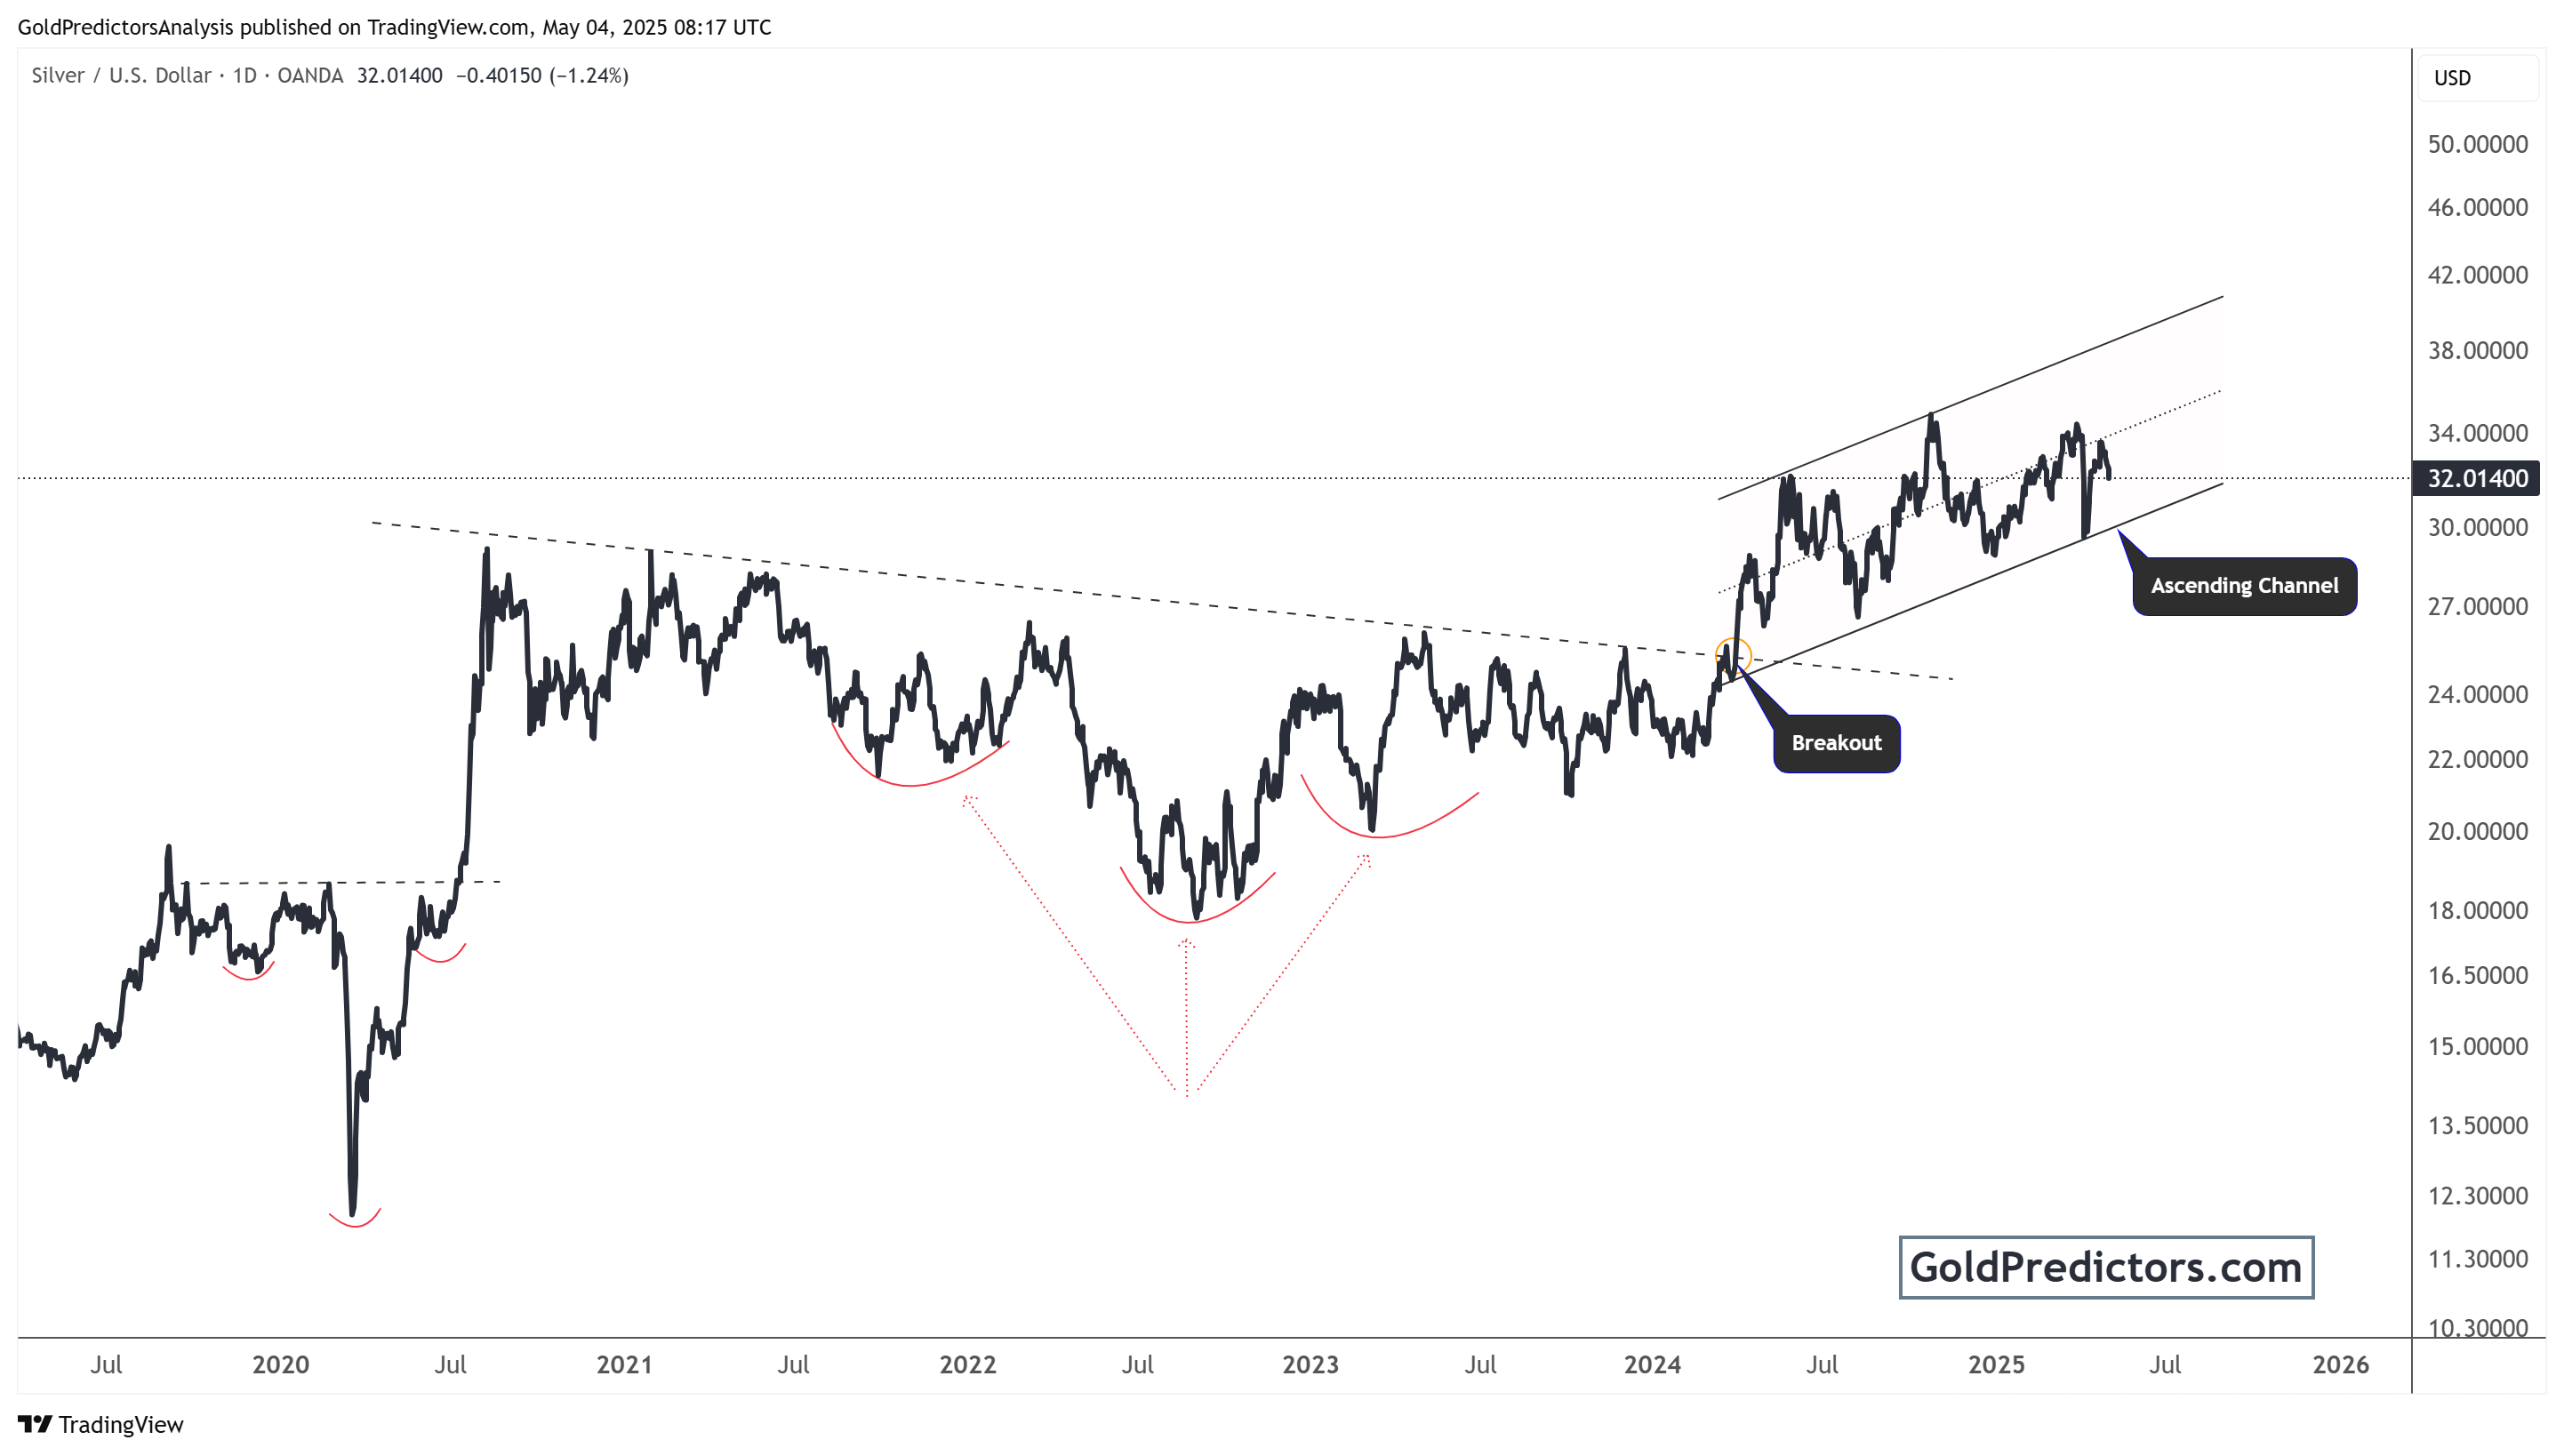
After the breakout in late 2023, silver has entered into an ascending channel, marked by higher and lower lows. This channel is a bullish continuation pattern and typically forms during strong trends. Silver’s ability to remain within the channel and bounce off the lower boundary multiple times suggests strong buying interest on dips.
The daily chart also confirms the momentum behind the breakout from the long-term cup and handle pattern. Each pullback is getting shallower. The higher lows align well with the channel’s lower boundary, supporting the continuation of the bullish trend.
This multi-timeframe confirmation strengthens the case that silver is in a sustained uptrend and may attempt a run toward the psychological $40 and $50 zones.
Silver Bullish Patterns Confirm Higher Price Targets
Silver has finally broken free from its long-term consolidation. The emergence of cup patterns signals a significant shift in momentum. The ascending channel seen on the daily chart reinforces this bullish trend.
Silver is technically strong, with $35 acting as immediate resistance and $50 as the long-term target. If the price stays within the ascending channel in the short term, pullbacks should be considered buying opportunities. Consequently, long-term investors and traders could see this as a strategic entry point into the precious metal. Furthermore, as inflation, monetary policy, and industrial demand continue to influence the market, technical patterns suggest that silver may be setting up for a historic move toward all-time highs.
Gold Predictors Premium Membership
Get exclusive short-term and swing trade ideas with precise entry levels, stop-loss, and target prices, including justification and analysis — all delivered directly via WhatsApp.
Our premium service includes deep technical analysis on gold and silver markets. We cover cycle analysis, price forecasting, and key timing levels.
Members also receive a weekly market letter with detailed analysis, commentary from our Chief Analyst, including actionable insights, trade timing, and direction forecasts for gold and silver.
Stay ahead of the market — join our premium community today.


