Golden Trades of 2020
By end of September 2020, the biggest golden trades were +$267/ounce and the worse trade was -$38/ounce. The largest trade in silver was +$5.75/ounce. Two months left to end the year. Let’s see if there’s another major trade to compare. A ($1150/ounce) of gold profit, if traded with 1 lot of trade size, generates a total of (USD 115,000)which is huge profit.
There are just 3 months left to finish the year 2020, as we approach the last quarter of the year. There has been a lot of uncertainty and liquidity this year on the economy, and here is how we deal them by using our golden trades. With $1149/ounces in gold and $15.1/ounce in silver for the year 2020, we remain very bullish for the year so far. Let’s have a look on some of our trade’s entry and exits. Please click here to see the whole history and trading performance.
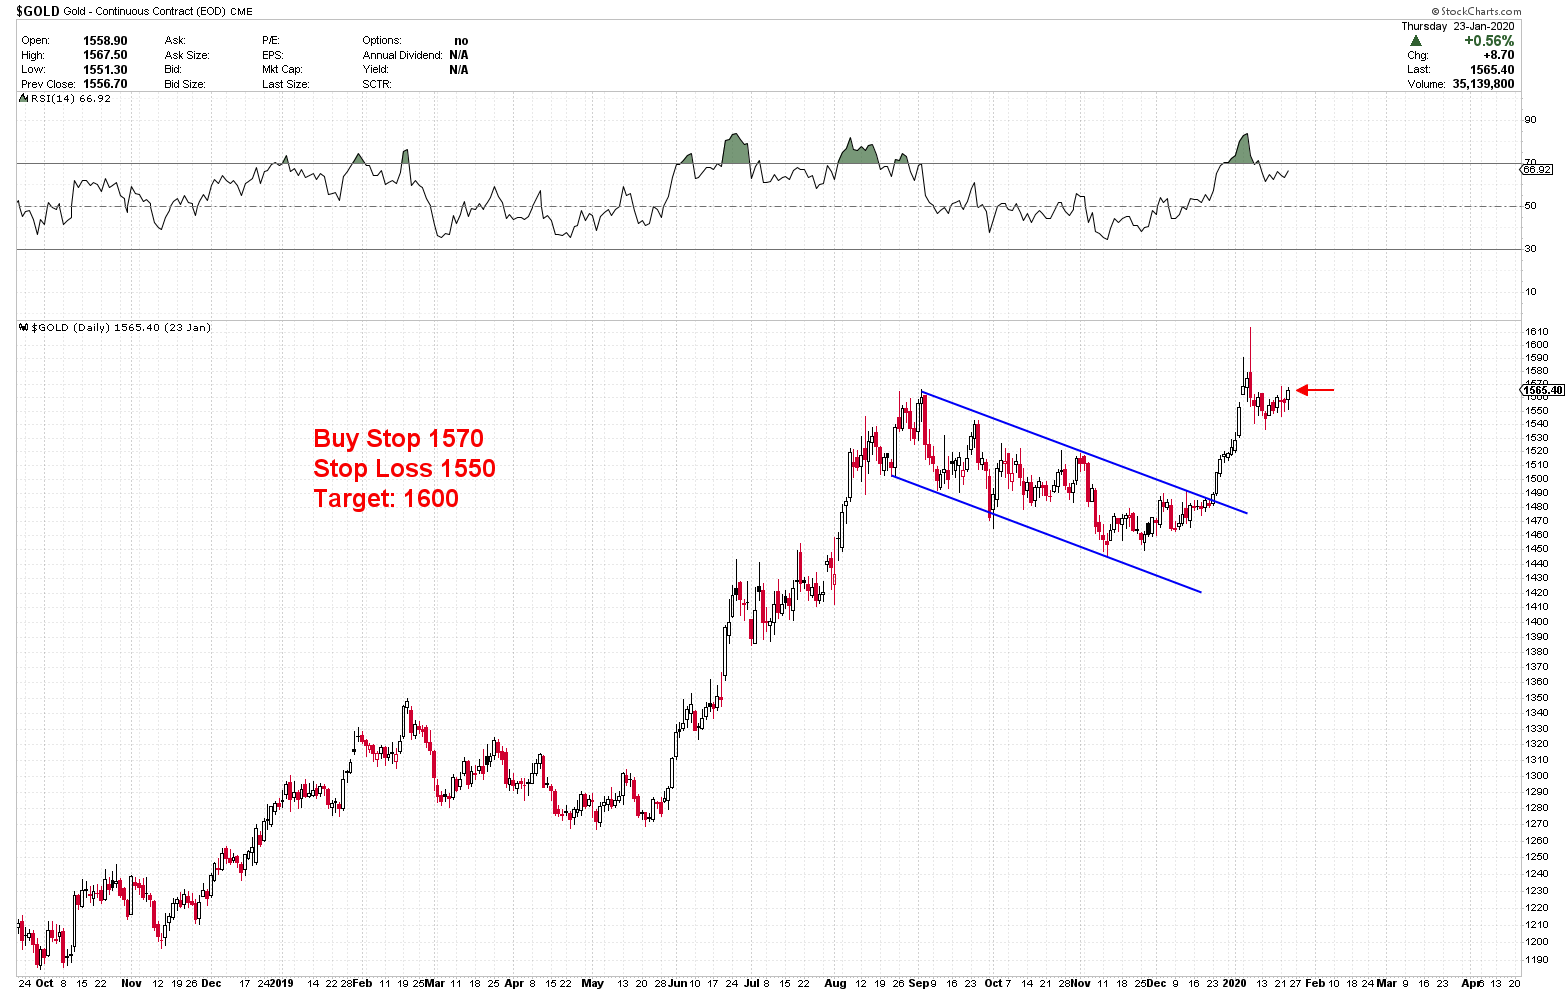
On 23 January 2020, we advised gold to be bought at 1570 using pending order. The order was also filled. The trade stopped at $20 loss, but prices increased after the trade stopped. The analysis were 100 % accurate, but the stop loss was not sufficient. Trading means making profits, not increasing number of positive trades. The only way to be successful in this profession is to control your emotion and to manage your capitals.
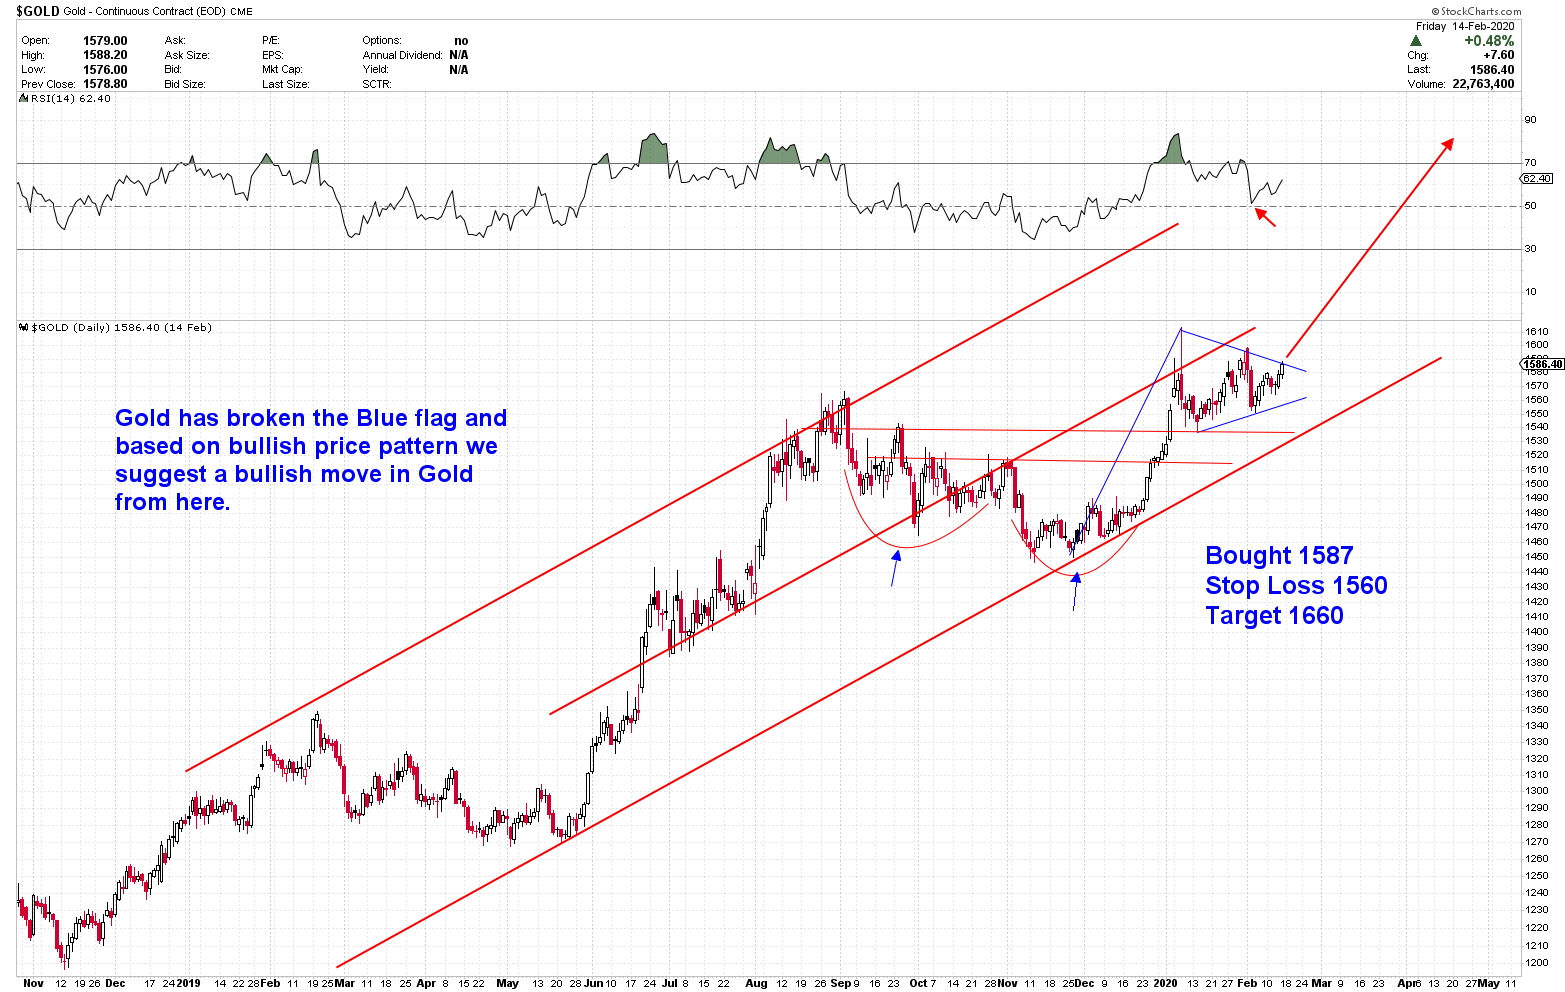
The trade was taken on 17 February 2020 to buy gold in 1587 as there was a strong reason to go a long way. The prices reported to significantly rise and the bull flag formation was broken up with a historical bottom formation. Afterwards, the trade produced a huge gain of +$73/ounce.
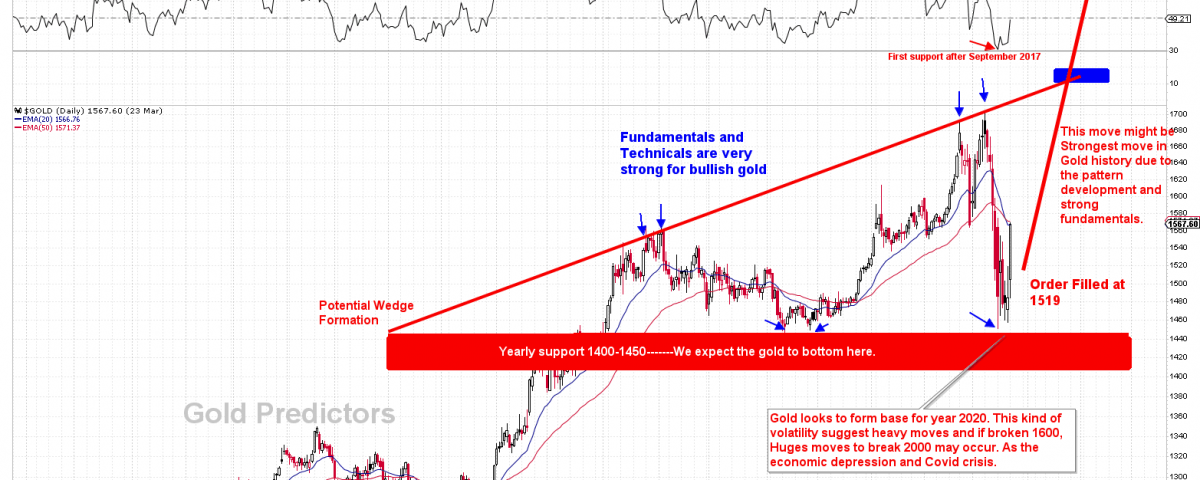
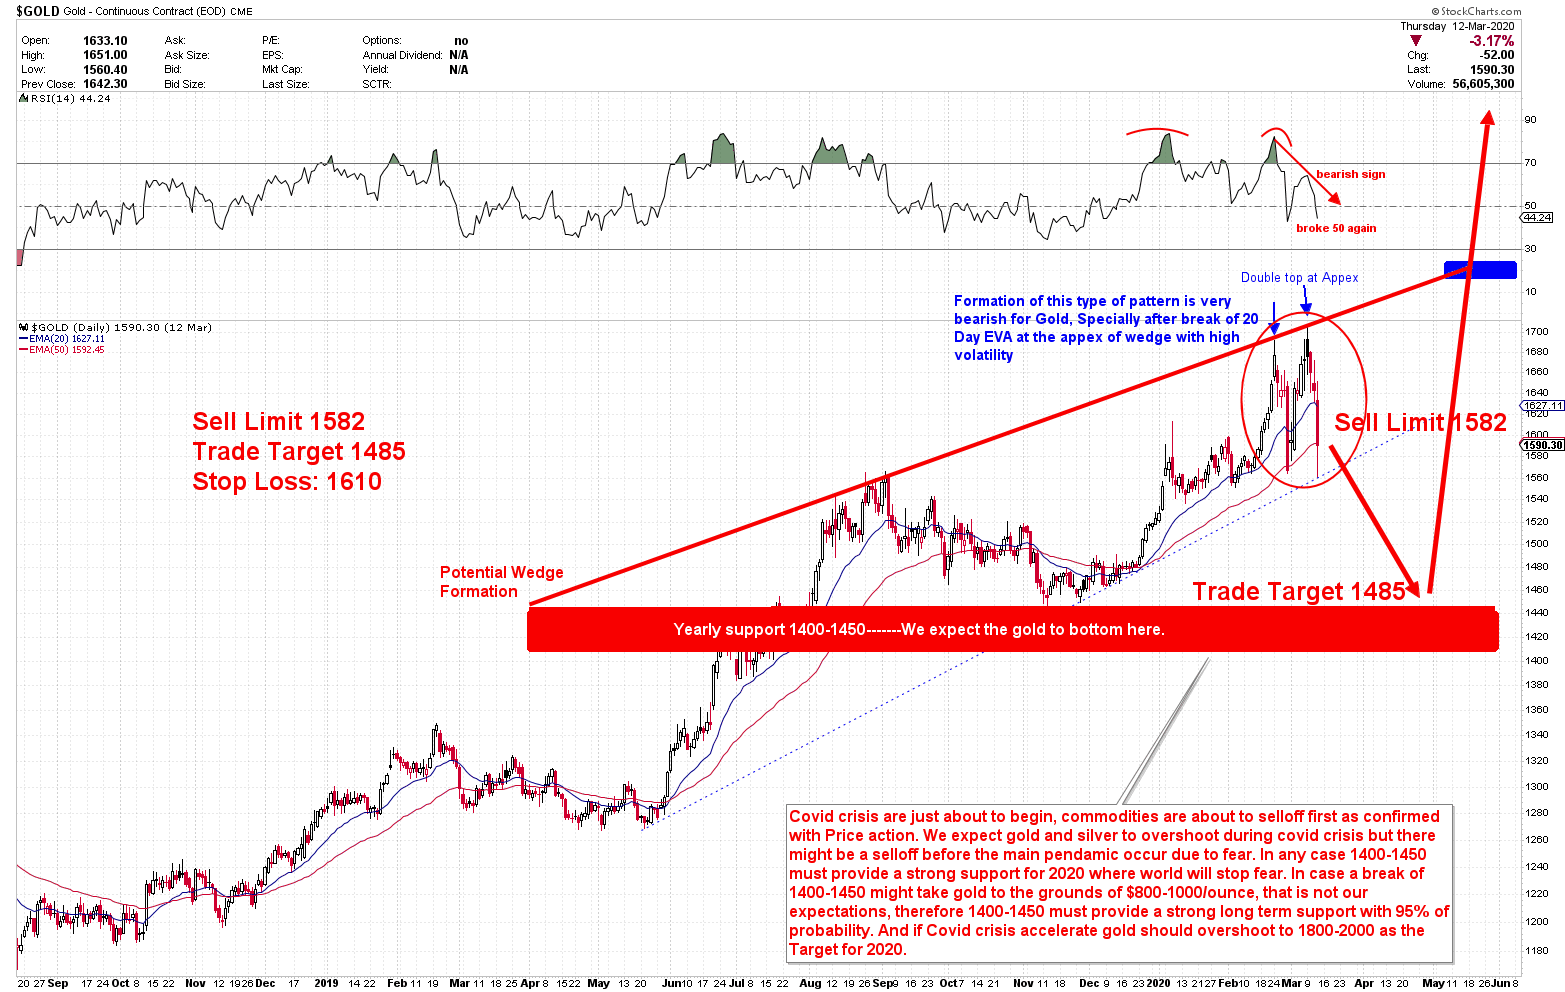
On 13 March 2020, When the Covid crisis started, the desire of gold prices were theoretically a potential wedge formation. The volatility expanded, and the price action formed a double top at the apex of wedge. As the market was fearful of Covid, the chances for a drop was significantly higher because of uncertainty and then a potential bottom formation on yearly supports. At 1582, we ended up going short gold and got +$97/ounce of big trade. The prices followed our BIG RED ARROW in the chart precisely.
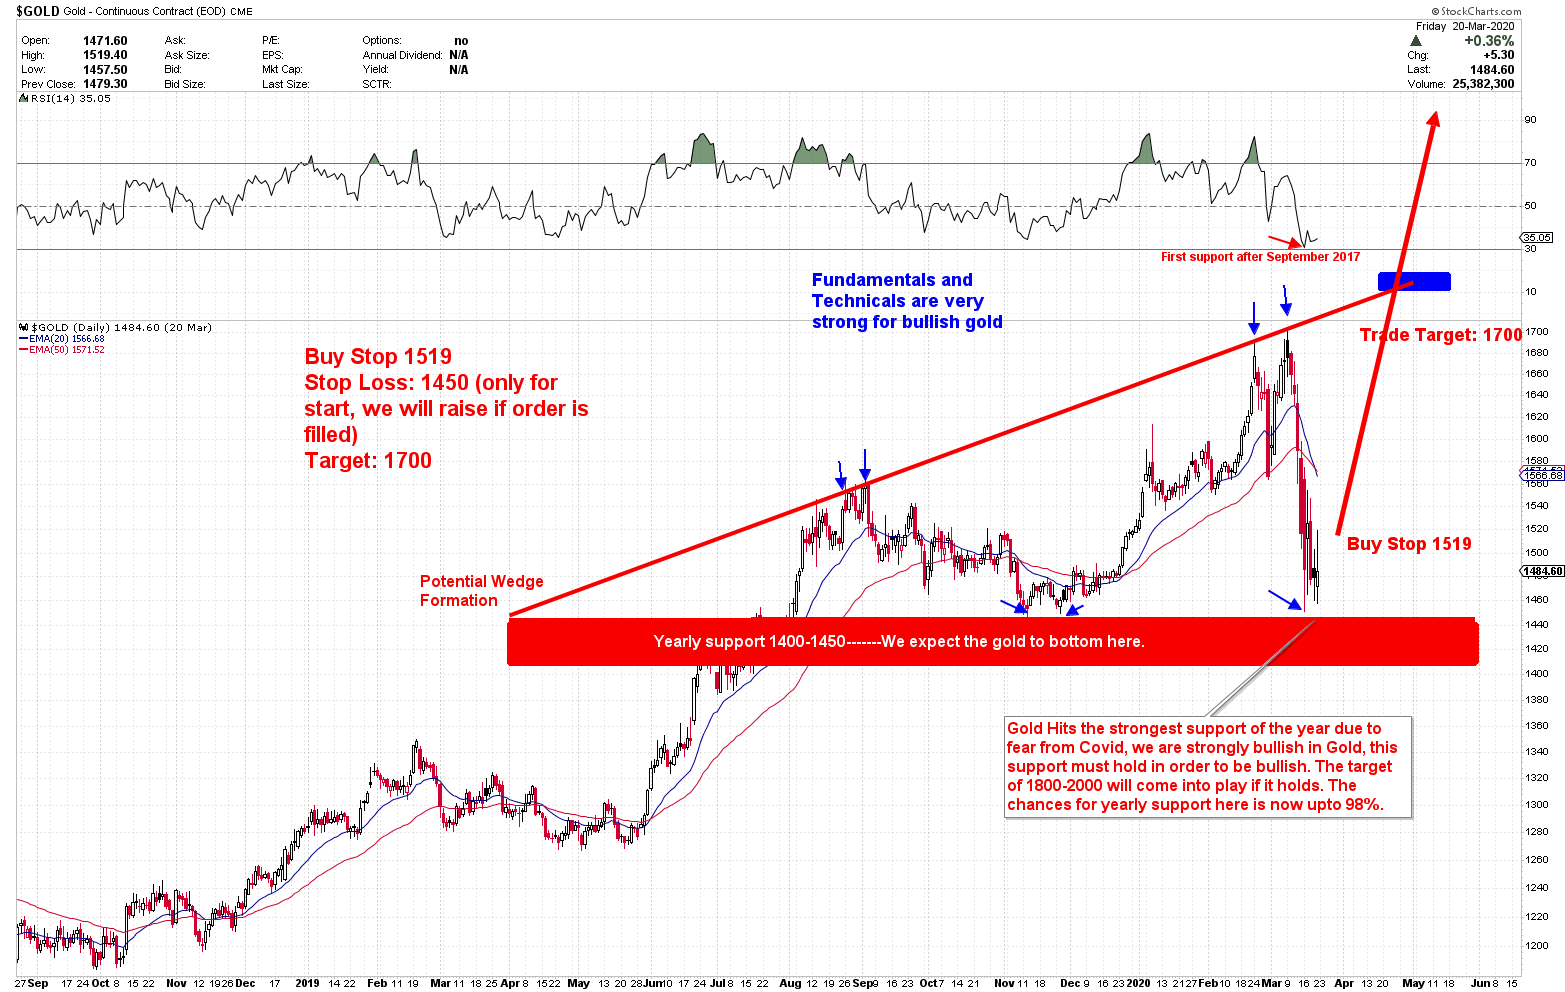
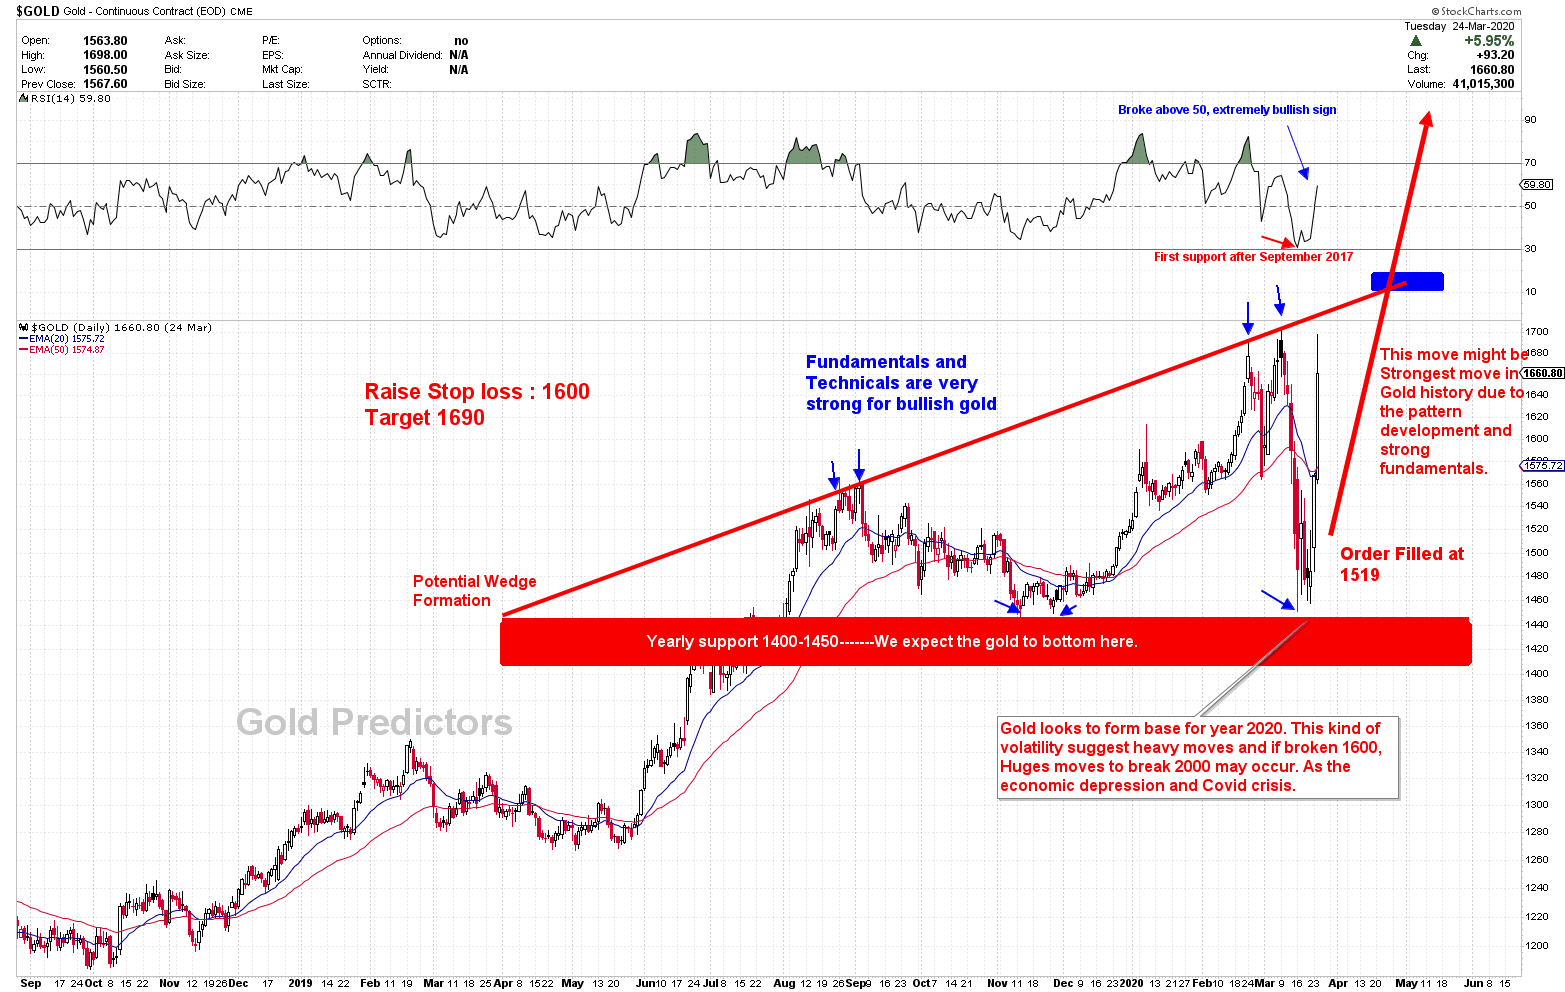
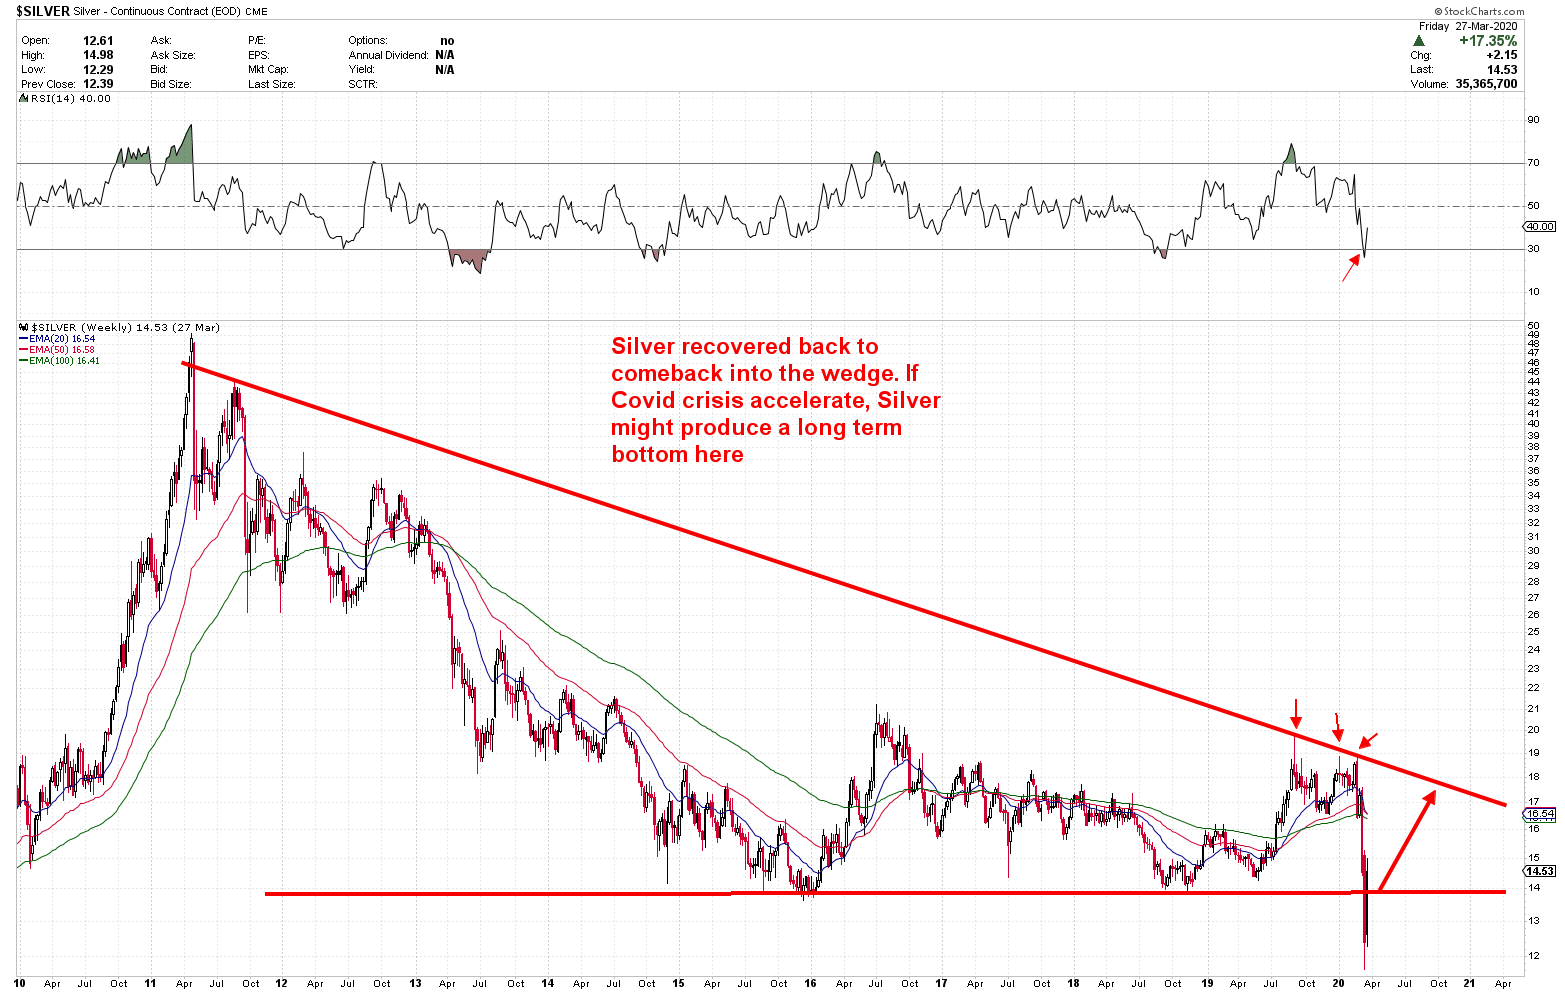
On 21 March 2020, we executed another big trade which is one of the golden trades. The prices followed the RED ARROW on the chart and targets were achieved within 6 days of trade. That is where we made fantastic profits and entered a long trade on the basis of emergence of bullish patterns of prices. As prices were trading at yearly supports between 1400 and 1450 and formed a reversal sign within the formed wedge, we all highlighted the fact that the drop in gold and silver is just a matter of virus fear and the Covid crisis will later lead to higher prices. We bought gold at 1519 by using pending order of BUY STOP 1519 with a clear objective of 1700. The trade led to + $181/ounce and was one of our largest trade for the short term after +$267/ounce trade.
The next day after the pending order was filled, the chart looks like as below. There we raised stop losses and targets to reduce risk and book enormous profits.
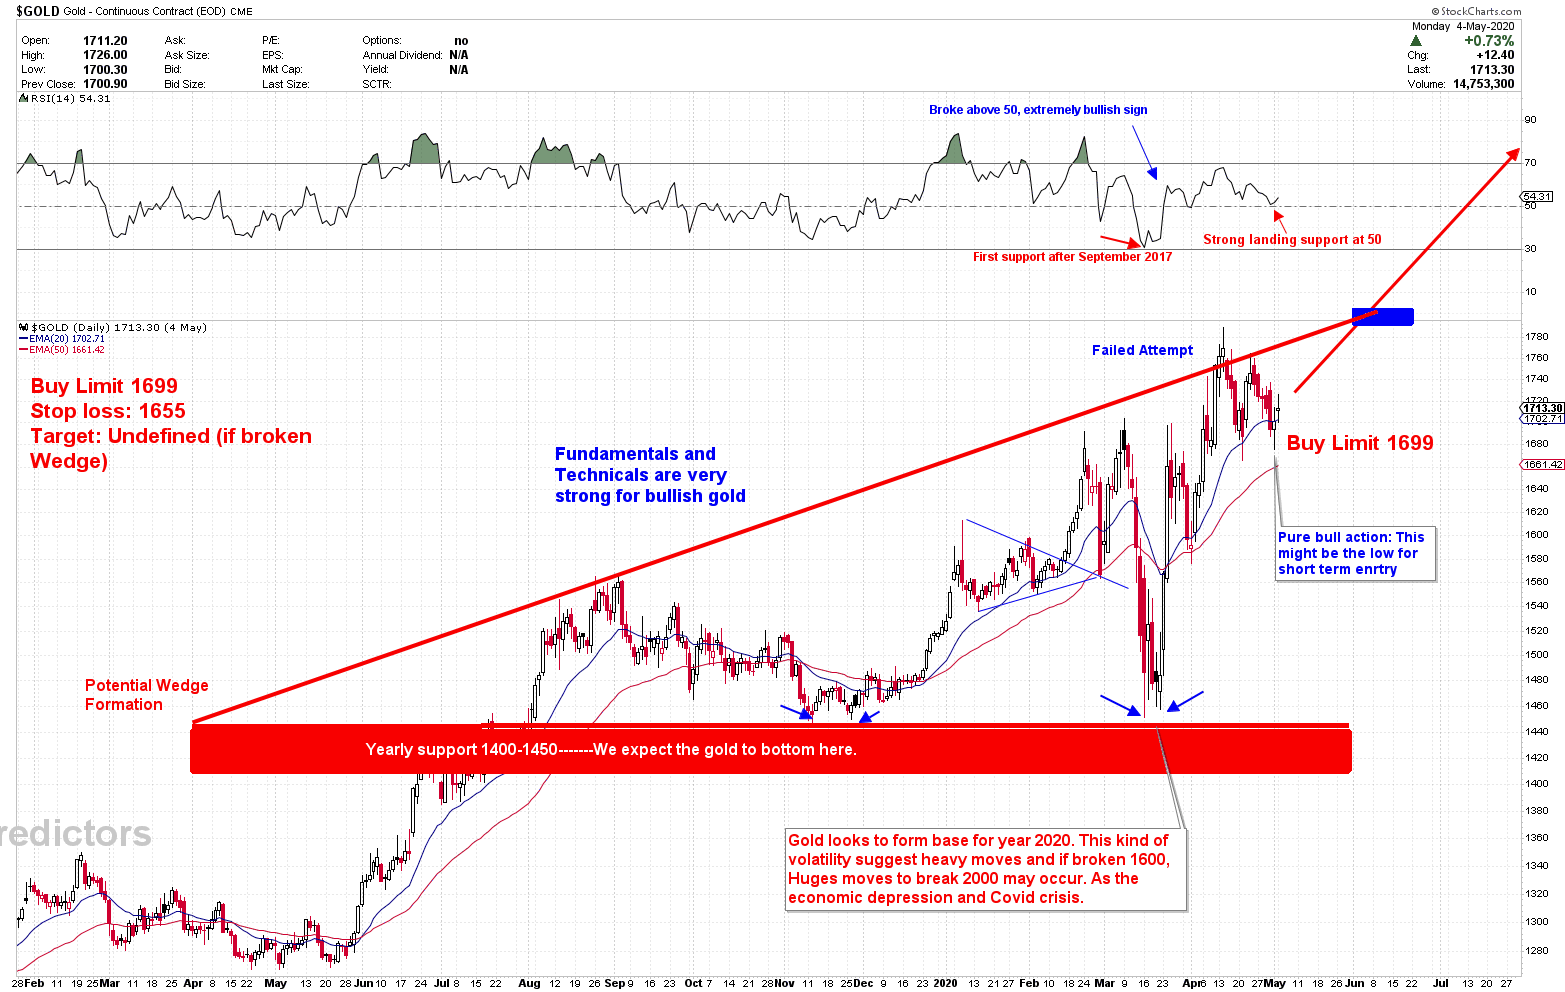
On 5 May 2020, after previous trade was carried out at 1519, prices shot much stronger and the gold roof was impacted. Gold produced another powerful signal after touching the roof at the top of wedge. That’s time when about 60 percent of the market was short of gold. Even so, we formulated and posted another Long Signal to buy at 1699, using the pending order BUY LIMIT 1699 with UNDEFINED TARGET. Even the prices were at the apex of triangle and resistance. This is one of the golden trades which contributed to a profit of +$39/ounce of gold.
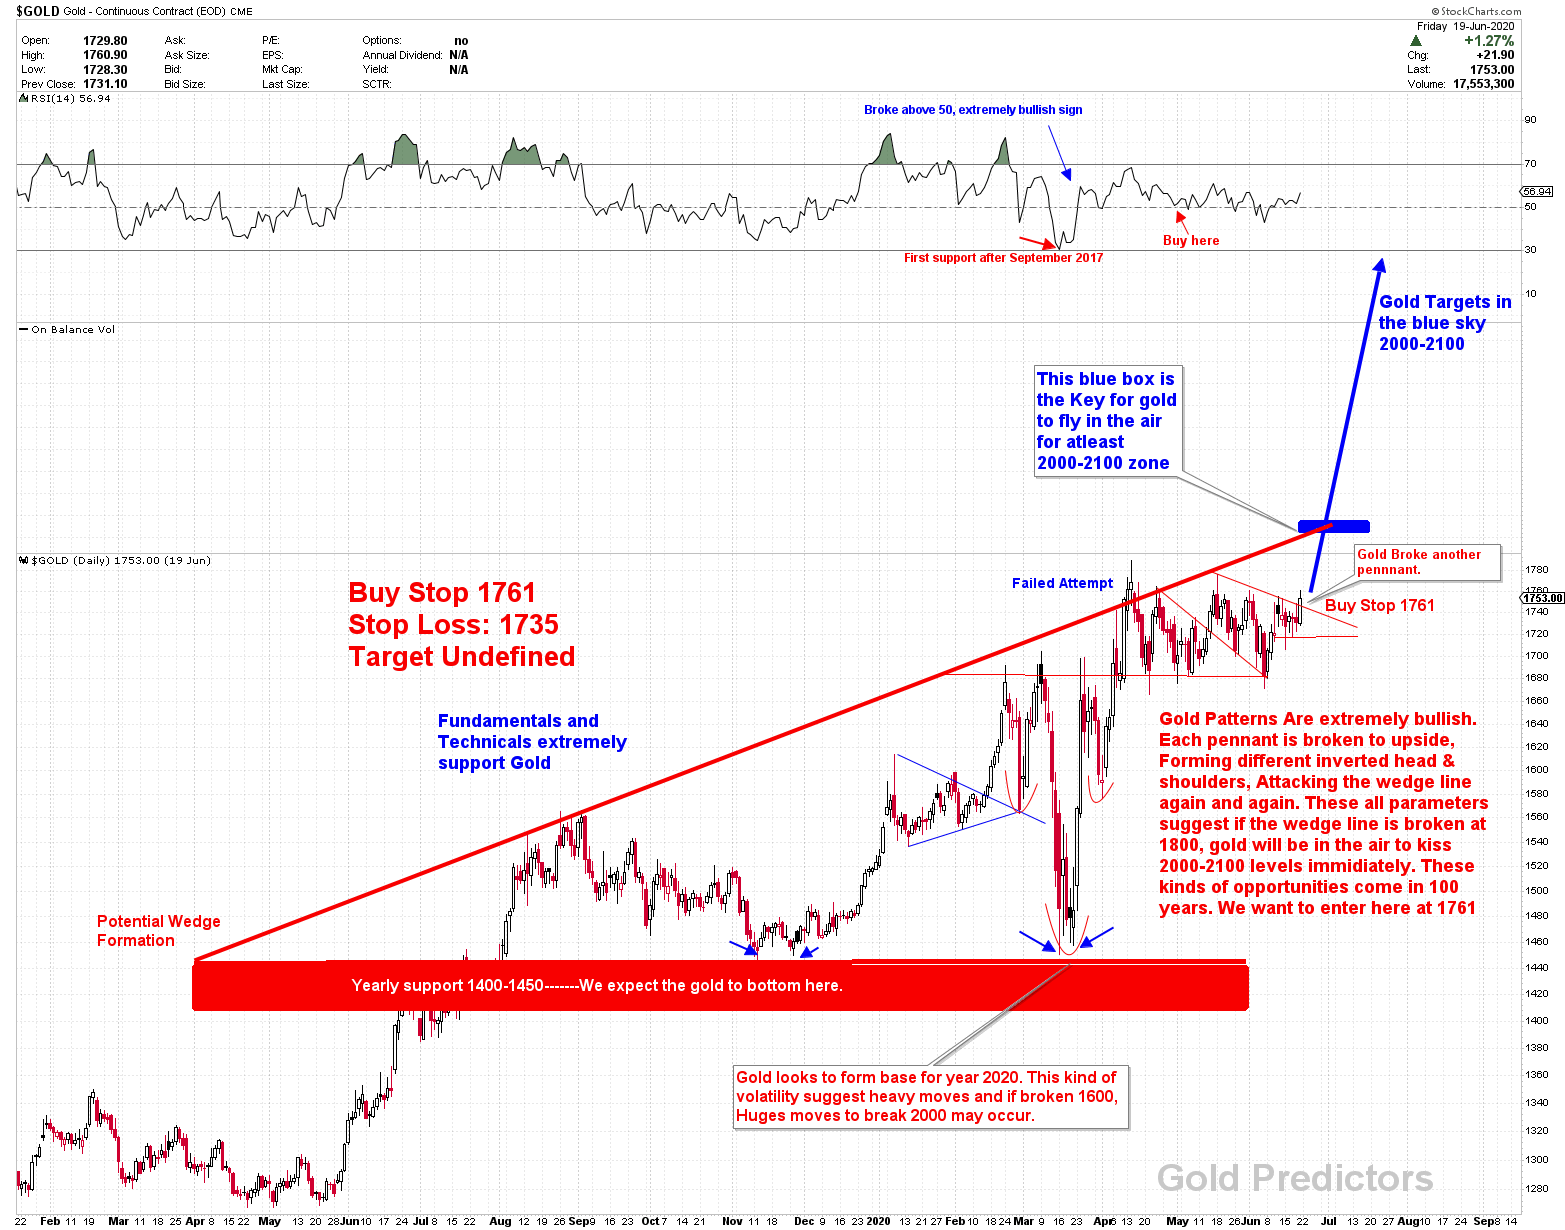
As gold was then at the resistance, the price developed a clear pattern of distortion in the barriers of gold. By the end of June, there were 70% of market participants who were short rather than long. Gold developed a historical stormy pattern with inv. H&S and then bullish pennants, and a rupture over the pennant finally confirmed the signal. We added another long trade in gold at 1761 using pending order BUY STOP 1761 with a stop loss at 1735, on 20 June 2020. After 20 June 2020, prices rose higher to the apex of the triangle and started to flood there rather than fall. Because of strong bullish trends, we did not book profit, but we executed some more positions to go long side of gold. This was one of the golden trades produced a gain of +$267/ounce. This trade was awarded the golden trade of the year 2020.
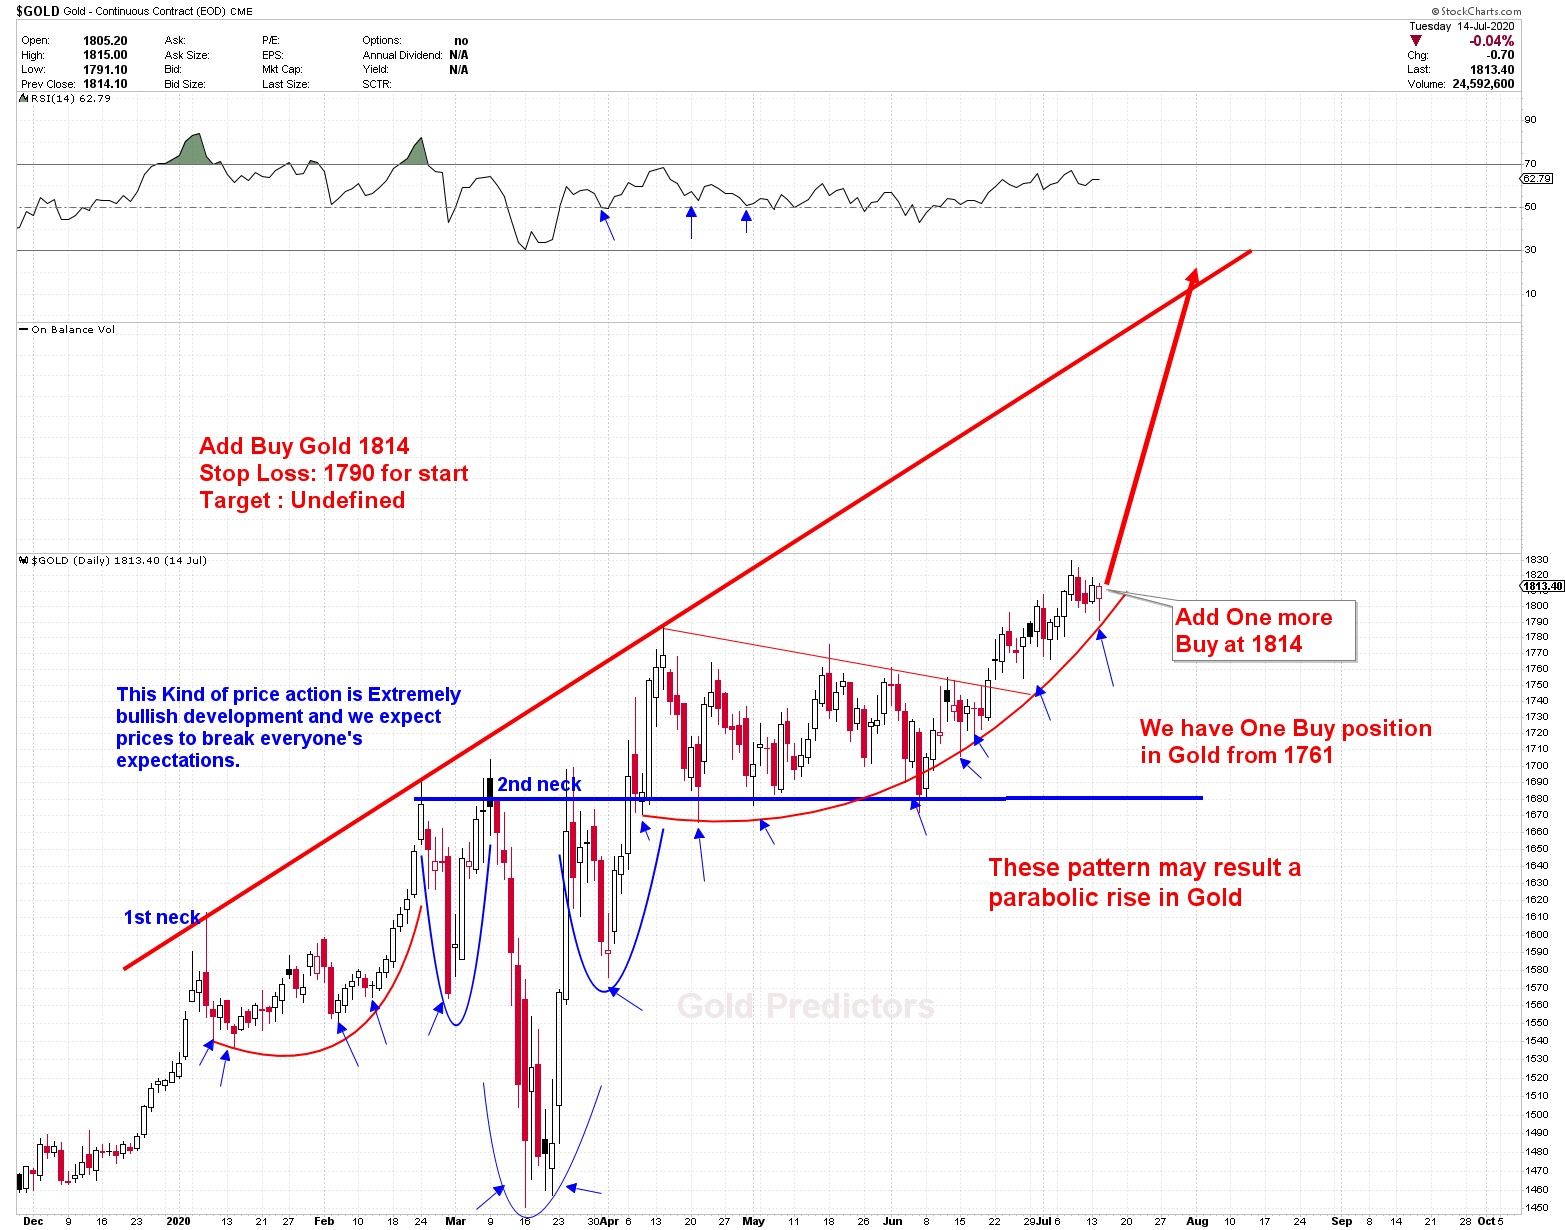
Prices congested on the resistance line, we anticipated significantly higher prices above resistance levels due to the Covid crisis. This is the time since everyone expected to resist at 1800 levels. But we executed one more trade in our portfolio to go long in gold on 14 July 2020. Markets never follow the crowd, one must think different in order to succeed the market. Although we had one trade from 1761 we went for another trade at 1814 with the same stop loss of 1735 by using a pending order at BUY STOP 1814. During that time, we drew a BLUE BOX, saying that the BLUE Box is the key for price fireworks. If the BLUE BOX opens, the price doesn’t look back and is above 2000 level in Parabolic and the key for blue box was 1820-1840. The trade generated gain of +$214/ounce and contributed to became one of the golden trade.
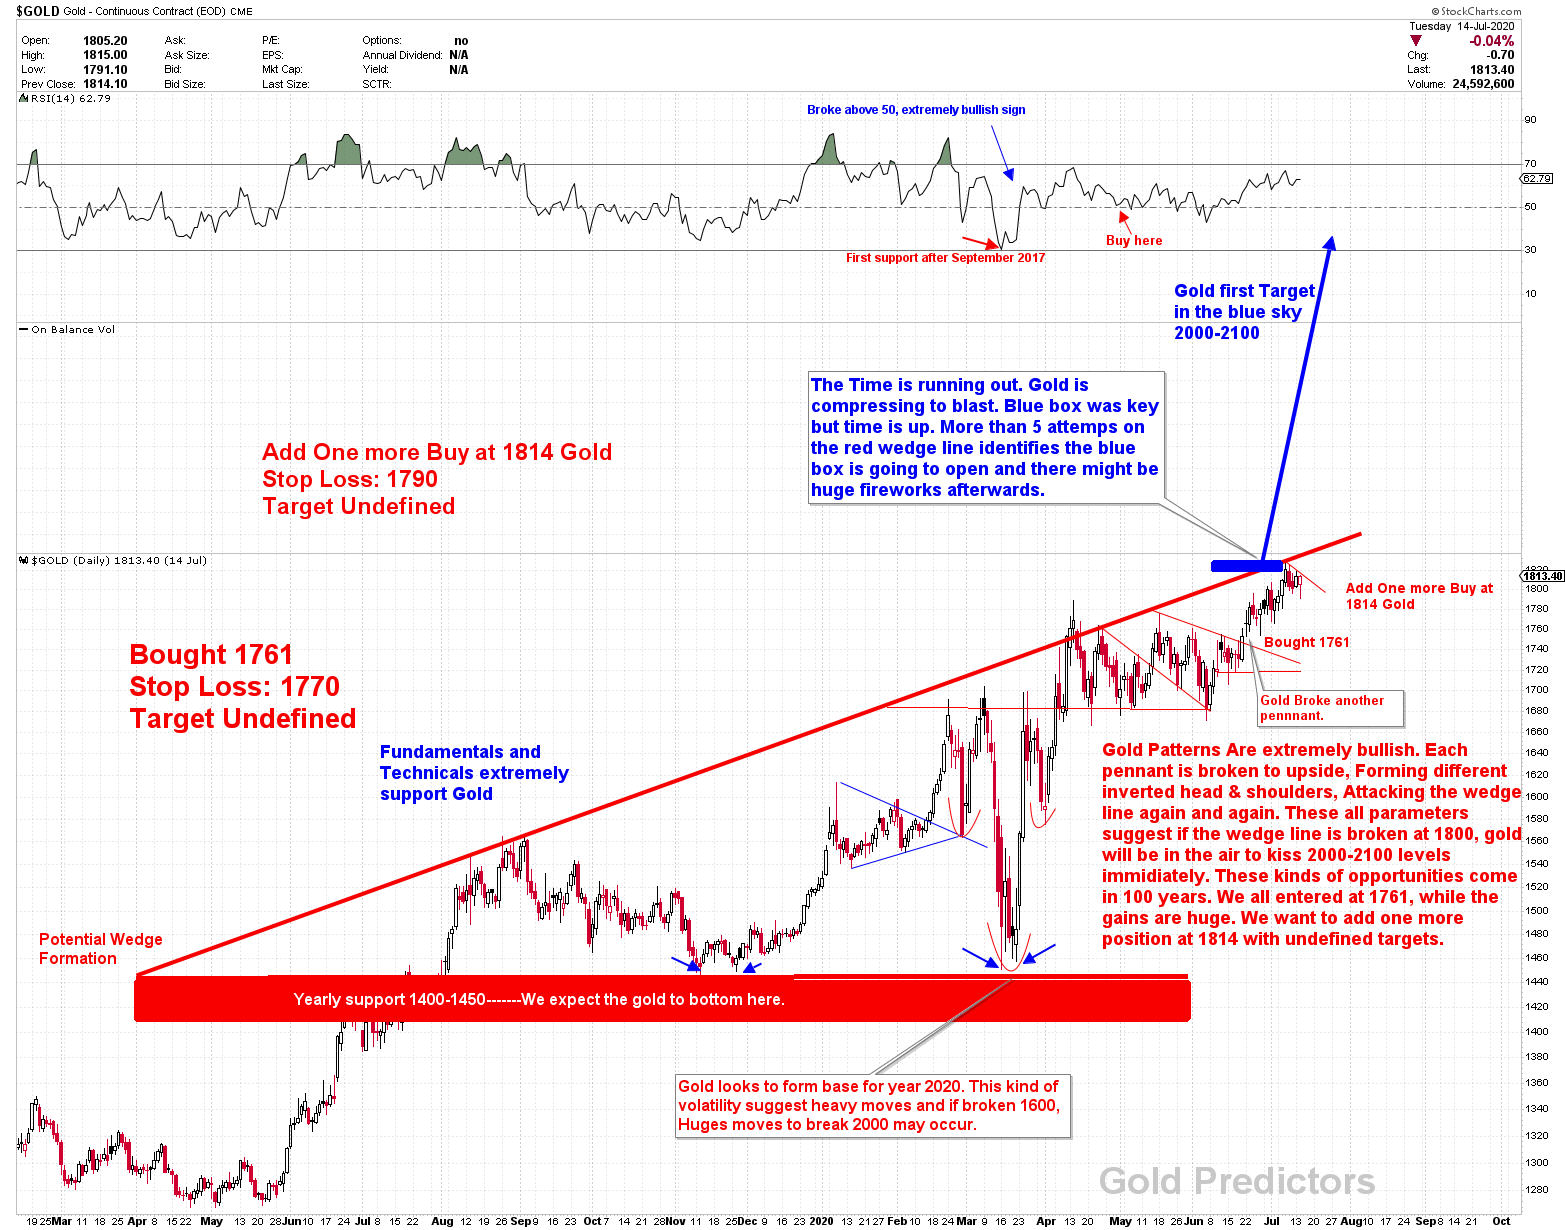
The key of blue box was 1820-1840 We see the target of this parabolic move using a new chart in the region of 2000-2100.
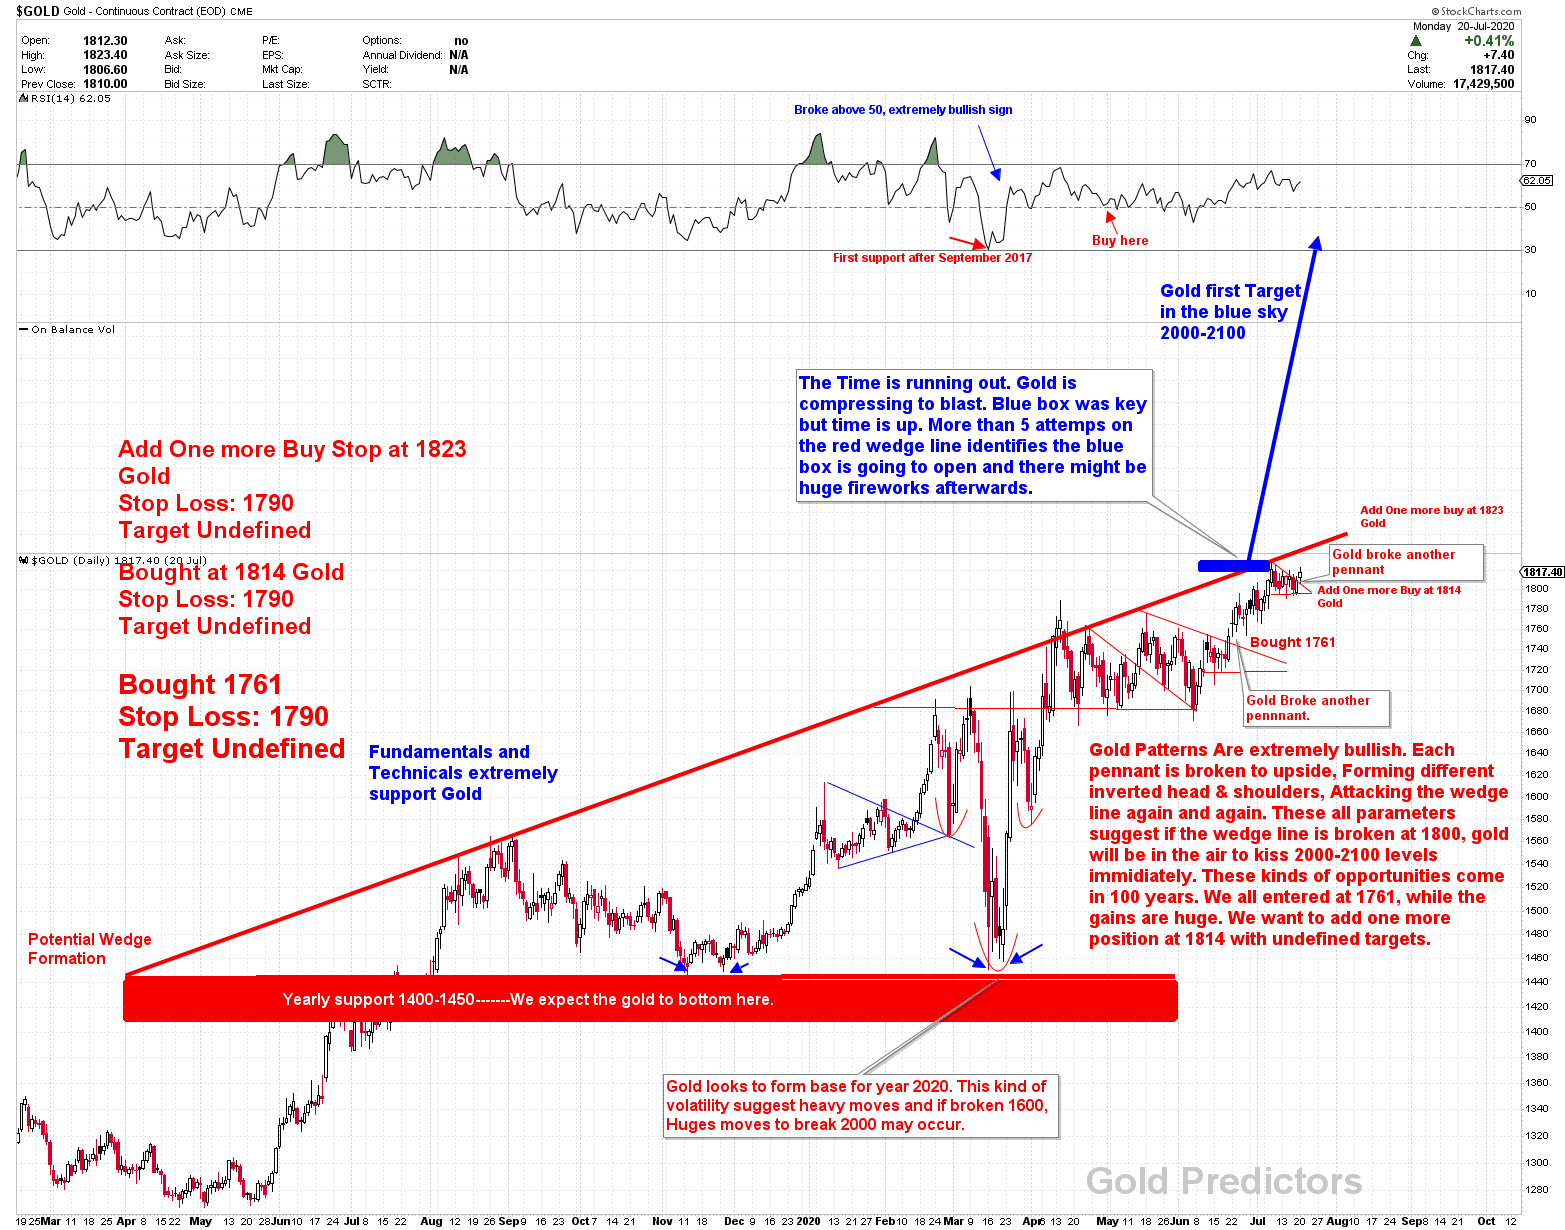
Following seven days of both trades, the prices did not rise above BLUE BOX and never drop. It further improved our research and encouraged us to go another trade on the basis of the last daily candle that indicated a bullish move ahead. We went long again with third trade at 1823. The number of pennants increased and each pennant was smaller than the previous one, that suggests price congestion, meaning that 95% of the likelihood was higher. Our pending order to BUY STOP 1823 was fulfilled on 21 July, and this time we hold 3 positions. The BLUE BOX opened with main LEVELS from the day after, and we achieved our 2000-2100 target in a powerful move. This trade contributed to +$208/ounce of profit to the portfolio and added to our golden trades.
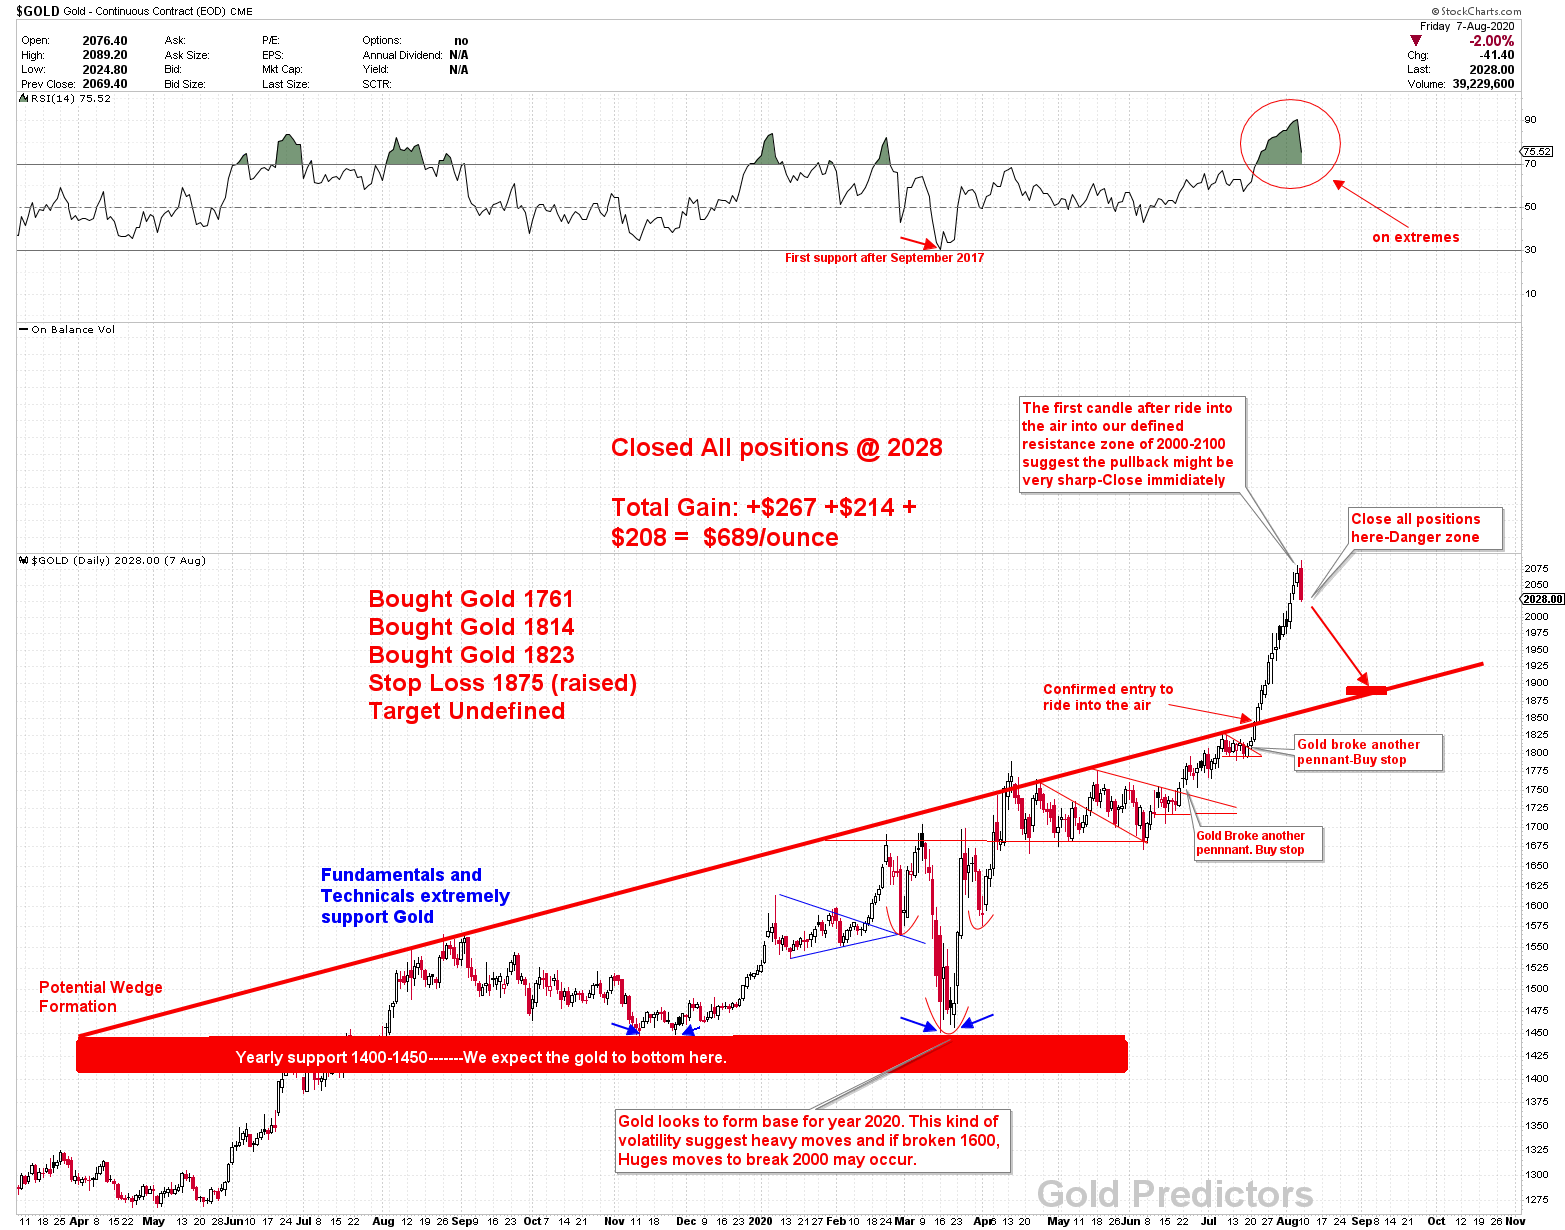
The prices rose above 1840 levels, while we keep open 3 trades. To avoid risk and profit from markets, we raised the stop-loss of all trades to 1825.
When prices reached our defined 2000-2100 targets, we have seen a reversal that our AI team engineered to book profits. After this rapid gain in prices, the daily candle was the first reversal candle and prices were highly overbought at these levels. Our AI team was confirmed by the 2000-2100 resistance, and we closed all positions at 2028. The next daily candle was an inside daily bar after closing all positions at 2028. This shows the reverse coiling effect and was indeed a short signal. But we really did not execute this trade and ignored it, because after such huge profits traders are encouraged to relax mind. The confirmed signal indicated a move to the BLUE BOX, which broken at 1840 levels. This happens and so far the bottom is 1848.
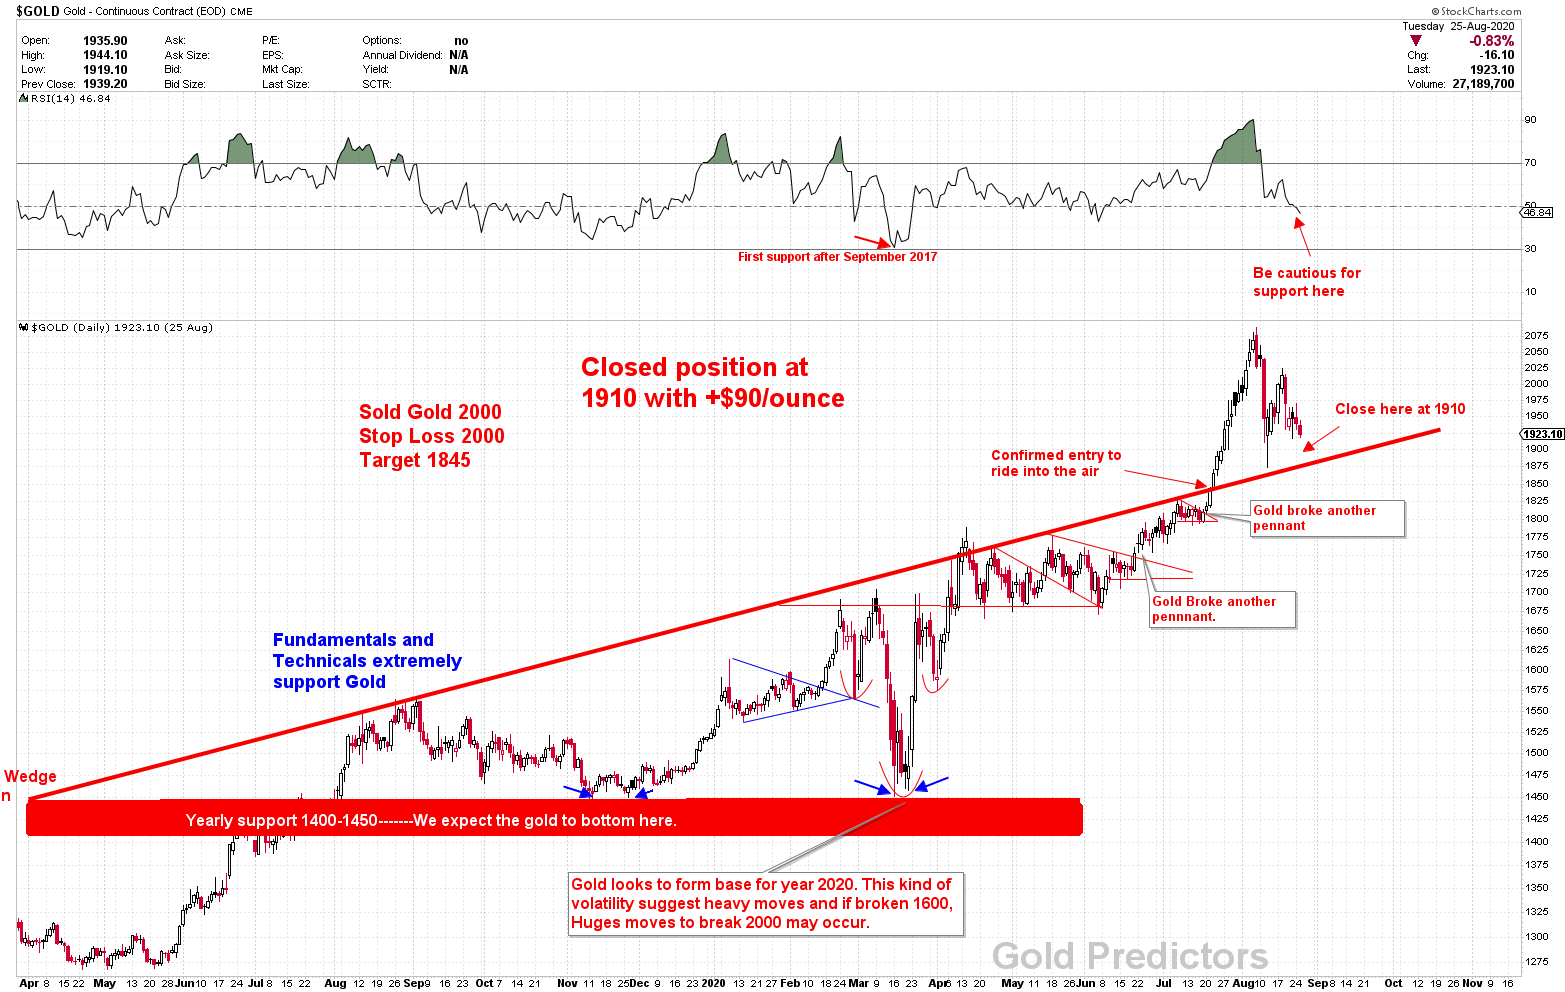
When the BLUE BOX bounced back to the 2000 resistance, we sold gold again at 2000 with the 2025 stop loss.
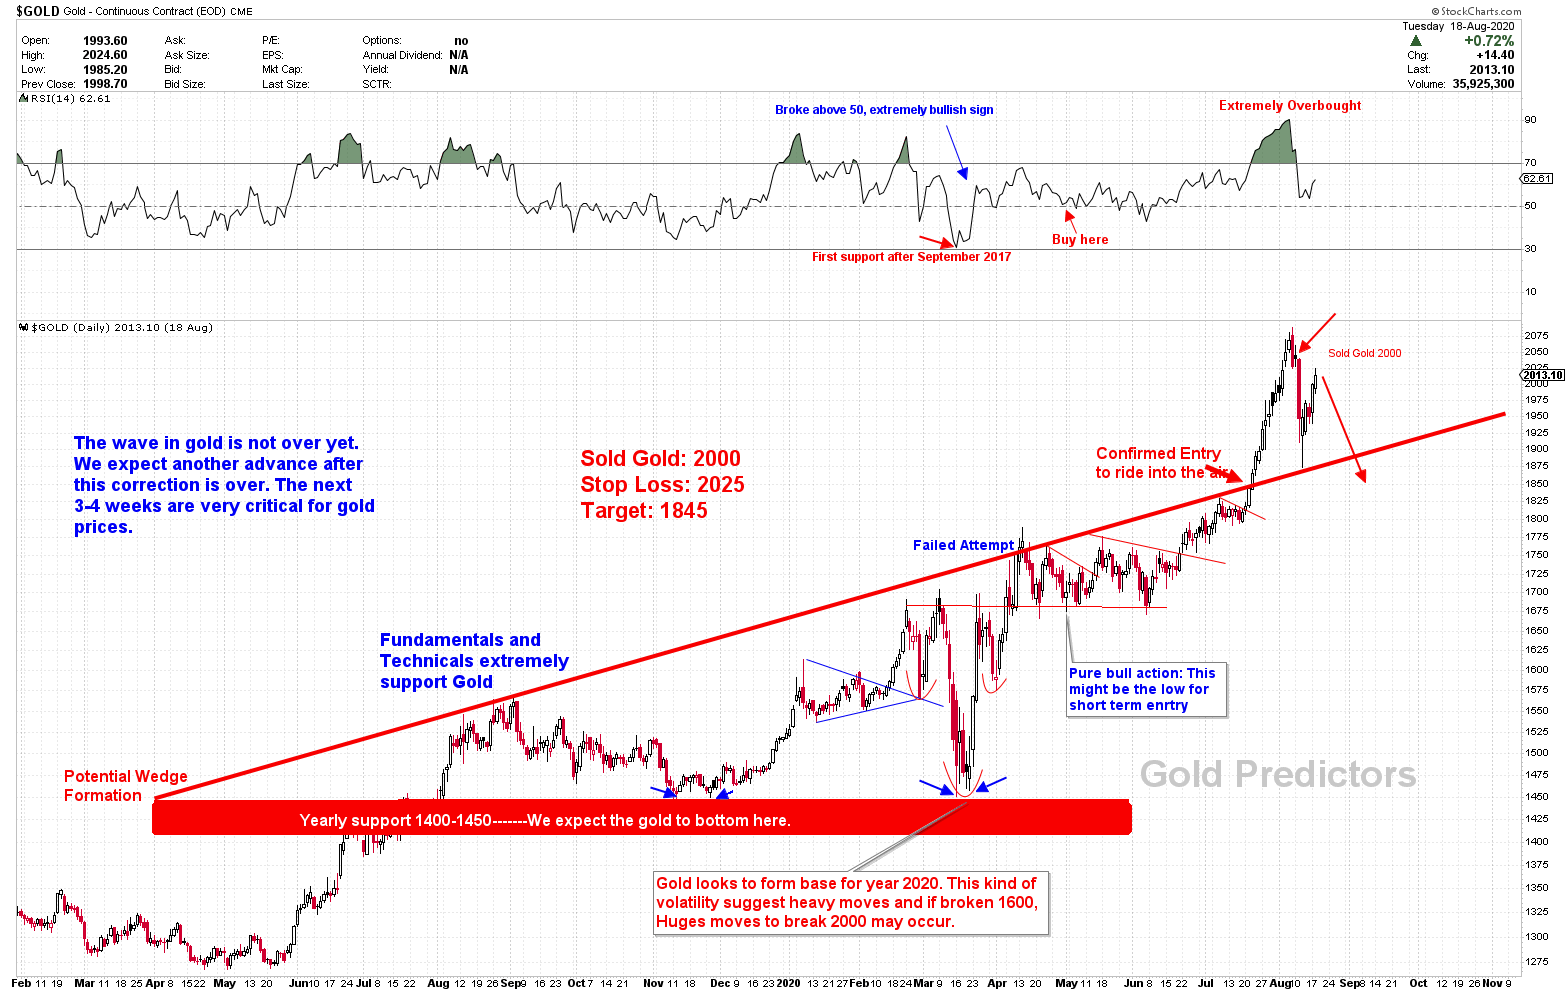
The price fell according to expectations and contributed to another enormous profit from a trade. This was one of the golden trades which produced a gain of +$90/ounce
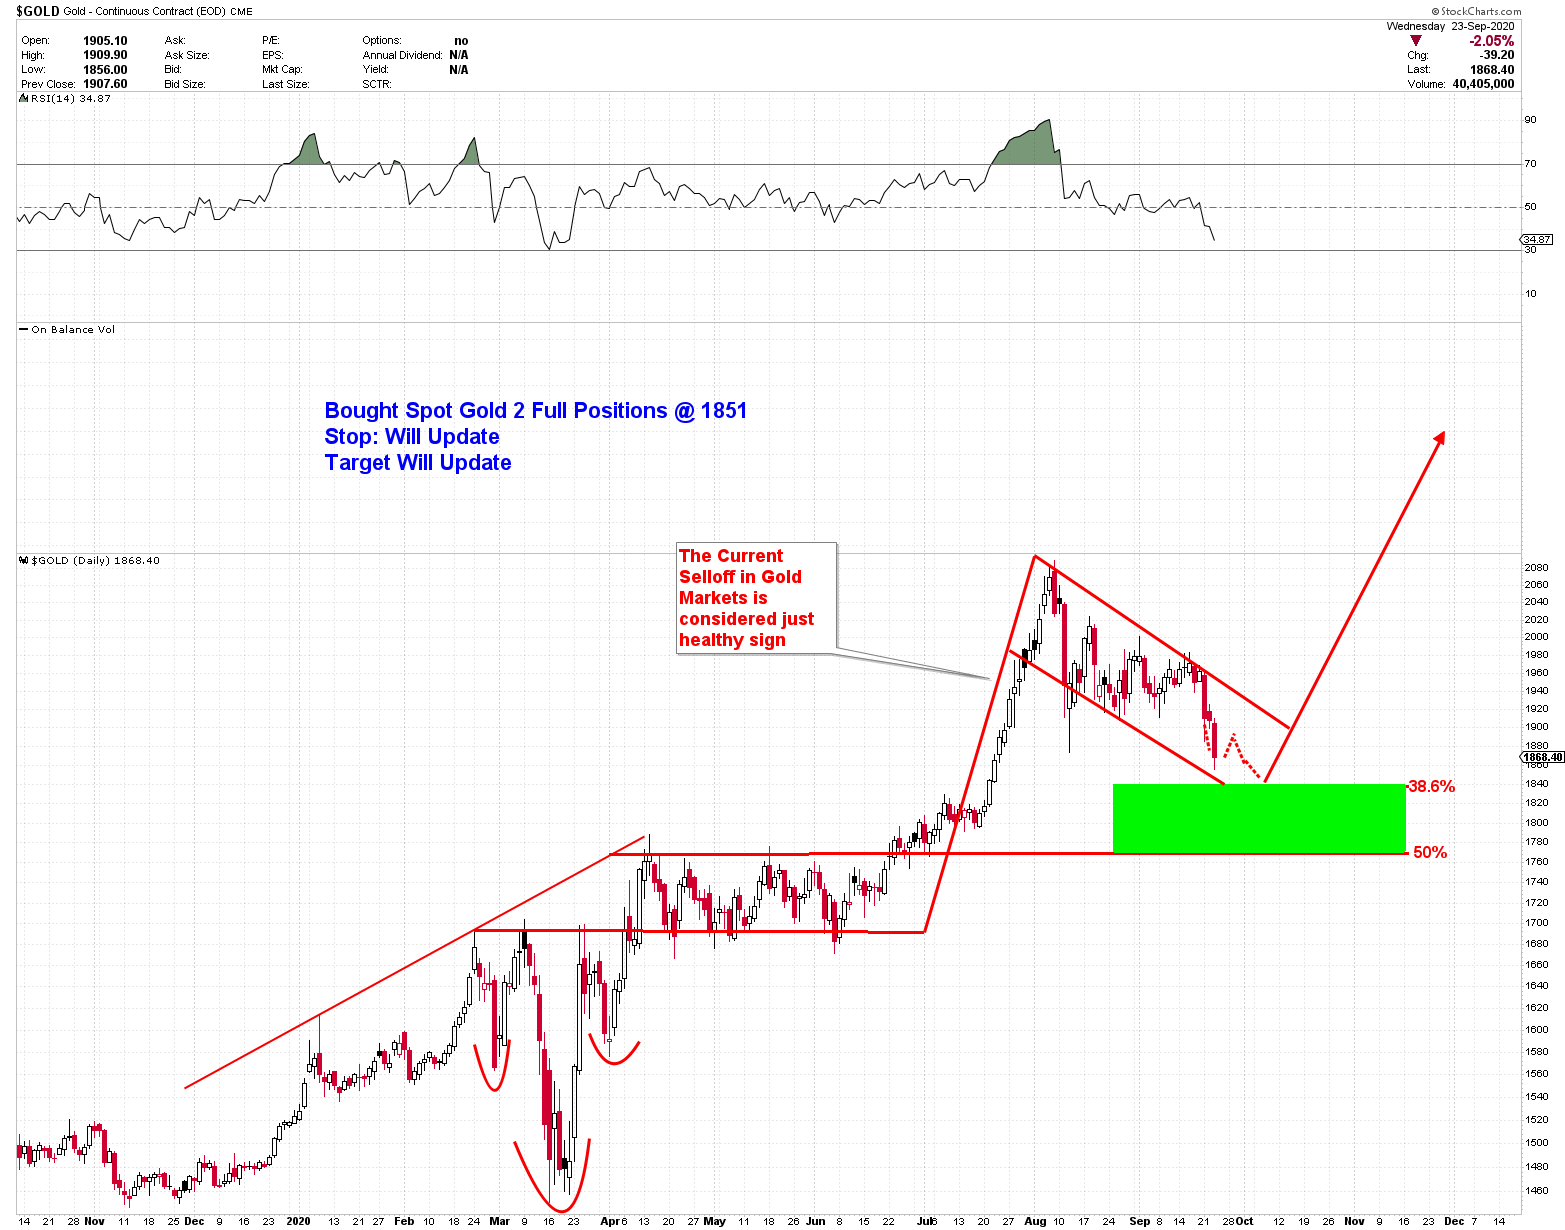
On September 23, 2020, we placed the pending order in spot gold in 1851 with 2 full positions. The order was filled on 24 September 2020 and gold low was just $3 below our pending order in 1848 precisely. GoldPredictors isn’t trying to pick tops or bottoms , but it happens because of the accuracy of analysis. One of the positions was closed in 1901 and second position is opened with raised stop loss. The one positions produced a gain of +$50/ounce
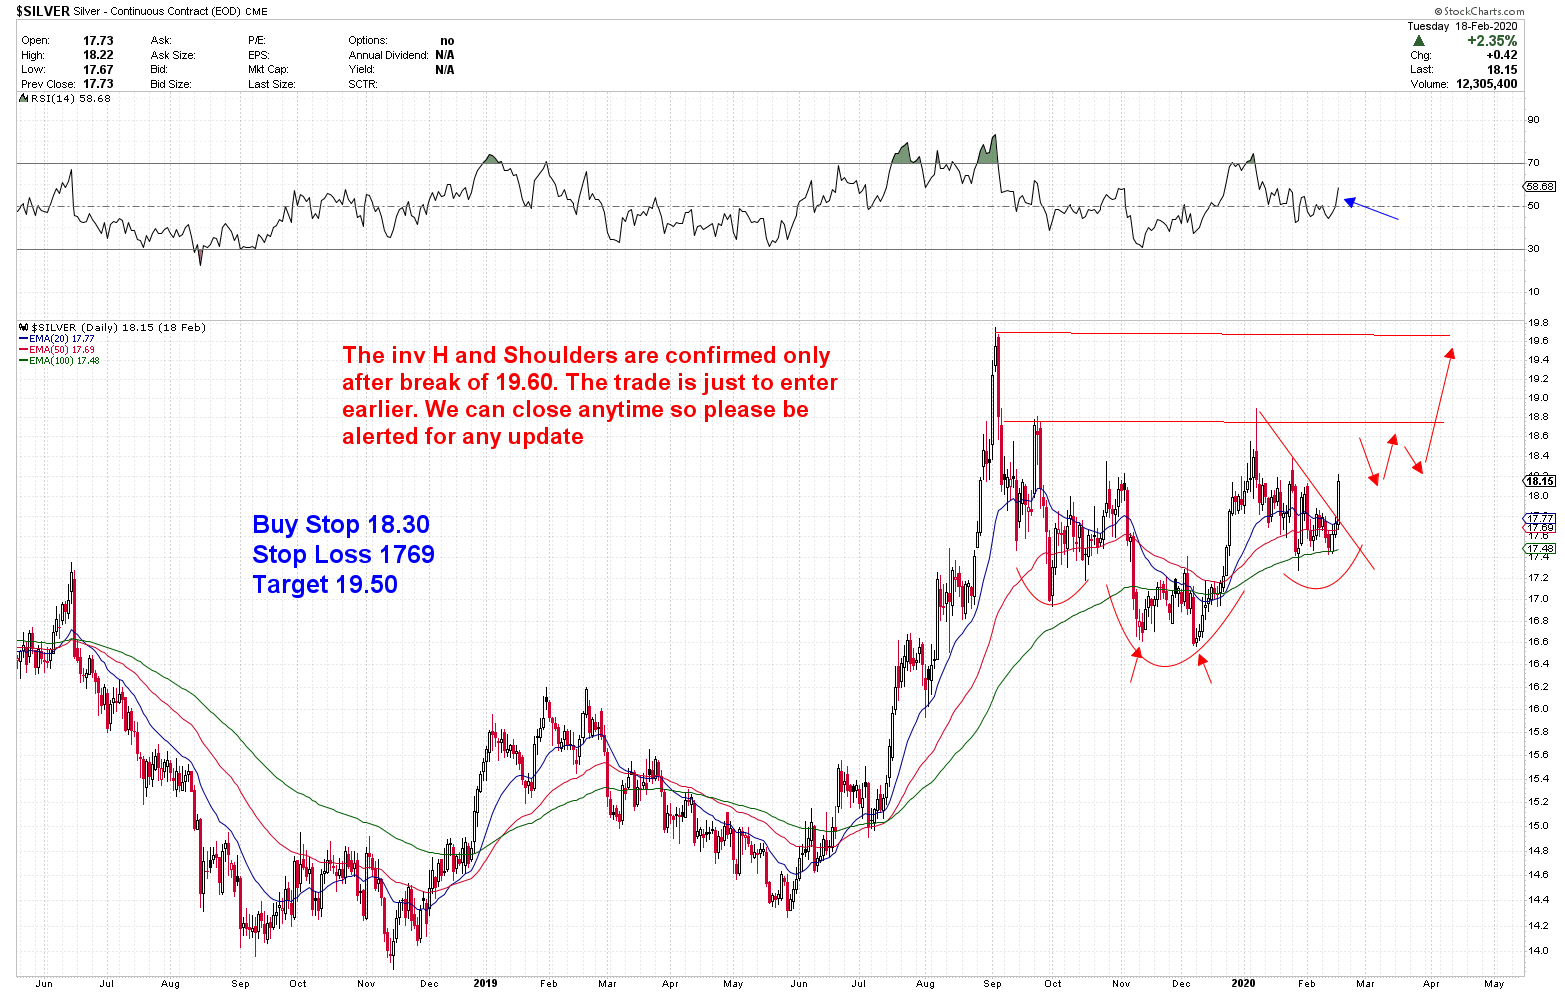
The same way we used to trade silver. Although we gained massively from gold, we used a conservative silver strategy. We used a pending order at 18.30 in Silver. The pending order was published in on 18 February 2020. The prices turned to the bottom. The trade gave us a profit of +$0.5/ounce.
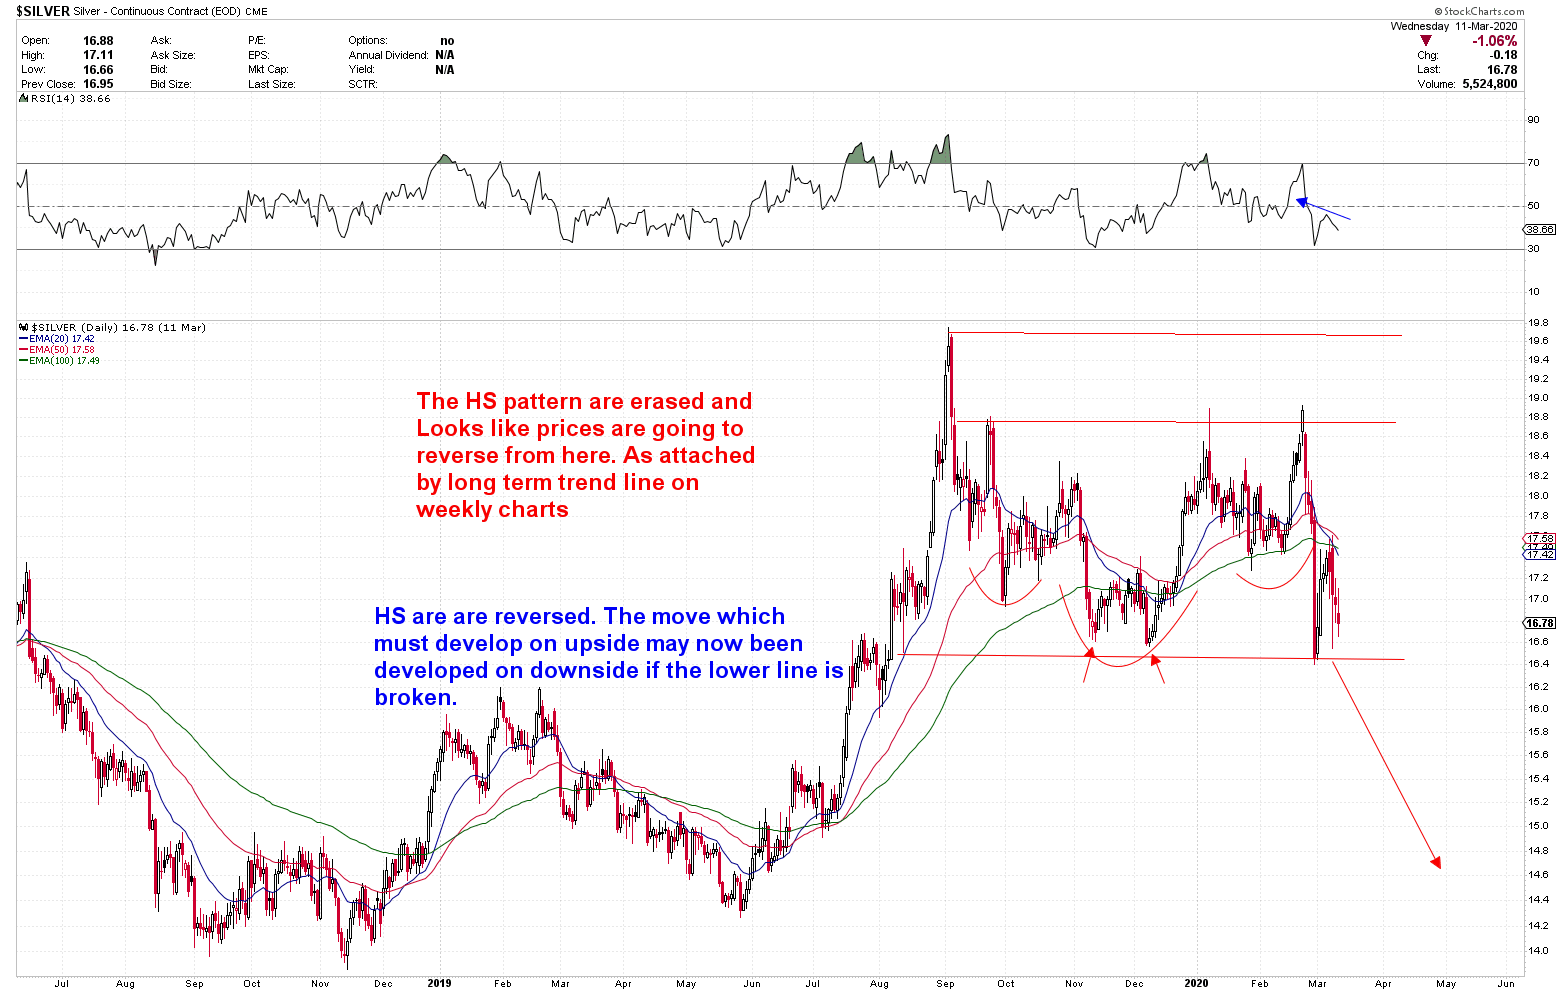
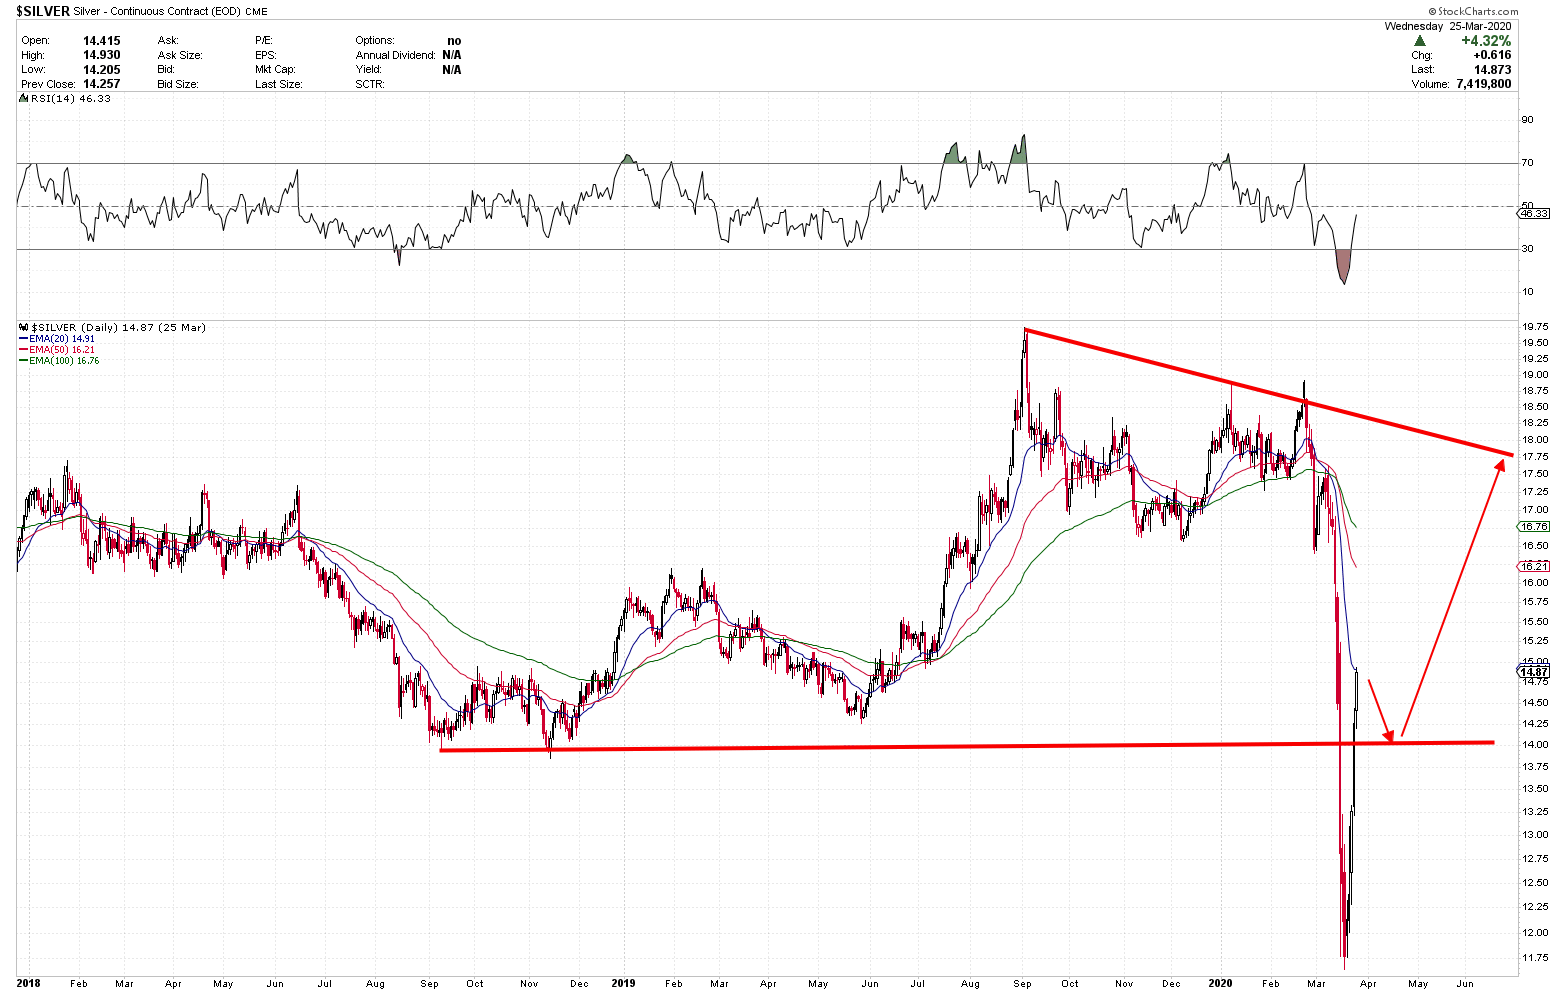
On 12 March 2020, our pending order Sell Stop 16.40 was completed and prices dropped sharply to hit the ground. The trade produced a gain of +$2.60/ounce.
After a fall in prices, we executed Long term trade in Silver for a long time for physical traders. We also add a short term trade at 14.25 with a pending order BUY LIMIT at 14.25. The trade contributed to an increase of profits of +$3.75/ounce.
While there are so many other trades which were taken and complete history of all those trades can been seen here.
As we enter the global turmoil, gold and silver markets are extremely unpredictable, there are tough decisions. Although prices have penetrated the barriers and are reintegrated in the Bull cycle, by ignoring the 8-years cycle, it is predictable that prices can enter a bubble. A global lockdown for a few days seems quite natural, but it has a long-term effect on a large scale. Even if the virus dies and everyone is immune to the virus, the effect of this situation remains for long time. And therefore, we anticipate the Covid-19 crisis to be the catalyst for future shifts in gold prices in 2021.
By end of September 2020, the biggest gold trade was +$267/ounce and the worse trade was -$38/ounce. The largest trade in silver was +$5.75/ounce. Two months left to end the year. Let’s see if there’s another major trade to compare. A ($1150/ounce) of gold profit, if traded with 1 lot of trade size, generates a total of (USD 115,000)which is huge profit.


