


Gold Trades Sideways As Fed Policy Uncertainty Persists

The gold market trades sideways due to a lack of new drivers. Prices around $2,300 fluctuate because traders are uncertain when the Federal Reserve will cut interest rates. The Fed recently indicated only one rate cut this year. However, the market expects two cuts in 2024 due to signs of easing inflation. Additionally, weak US Retail Sales data, showing only a 0.1% rise in May after a revised -0.2% in April, suggests consumer fatigue and supports the case for potential rate cuts soon.
Gold Technical Outlook
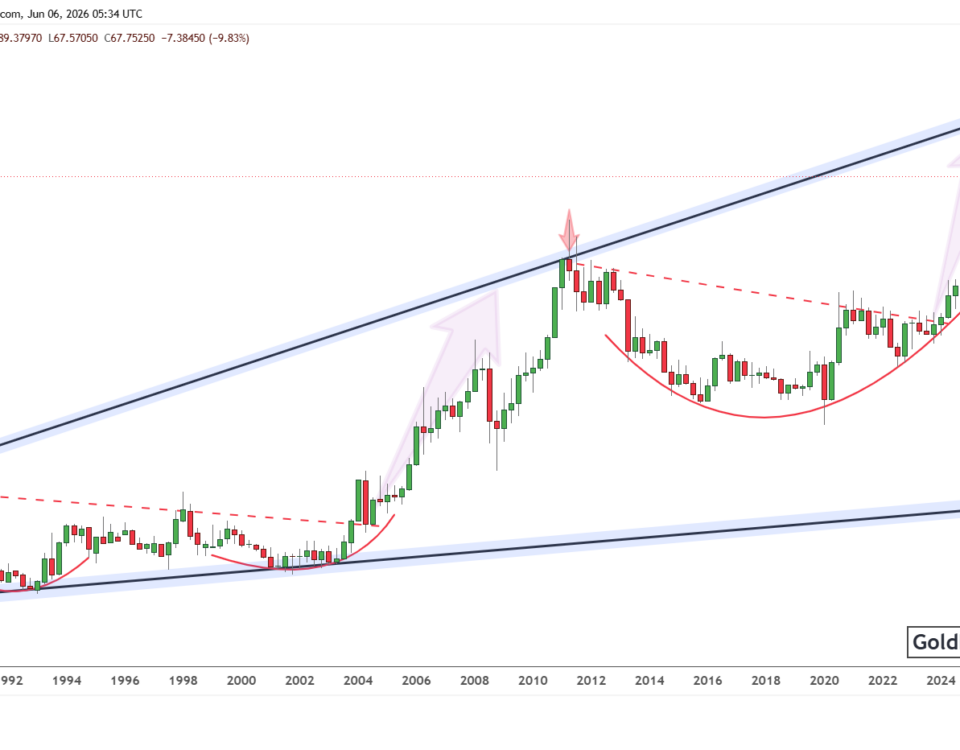
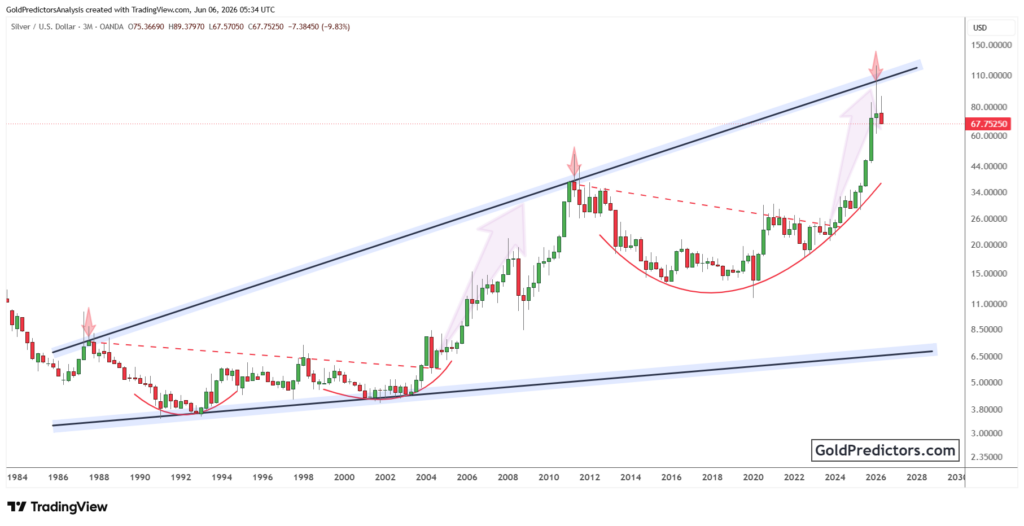
From a technical perspective, gold prices haven’t moved much over the past week. It is due to the lack of precise economic data that pushes them higher or lower. Traders are waiting for more definite signals on the Fed’s rate-cut timing. Mixed messages from Fed officials add to the uncertainty. Some see positive signs of inflation slowing down, while others highlight ongoing inflation and a tight labour market, recommending caution. This mixed guidance keeps gold in a tight range as everyone waits for more concrete economic news and Fed policy updates. The quarterly chart below shows that prices have broken the triangle on a long-term timeframe, indicating potential for further upside. However, any price correction towards the triangle area cannot be ignored. The quarterly candle will emerge within 10 days, which may set the next direction for the gold market.

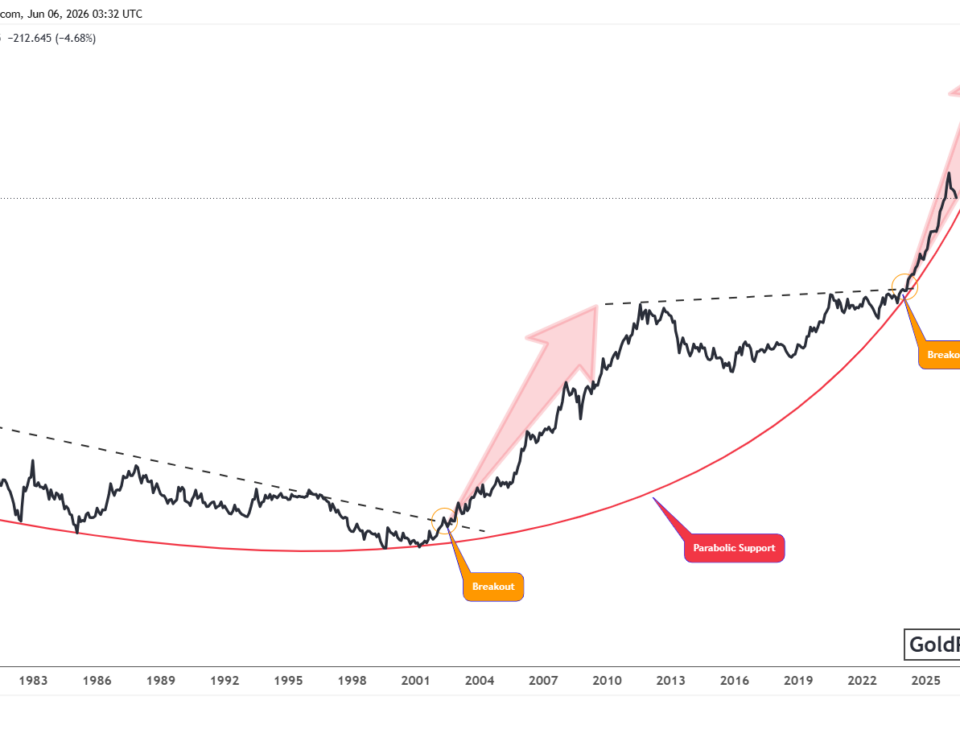
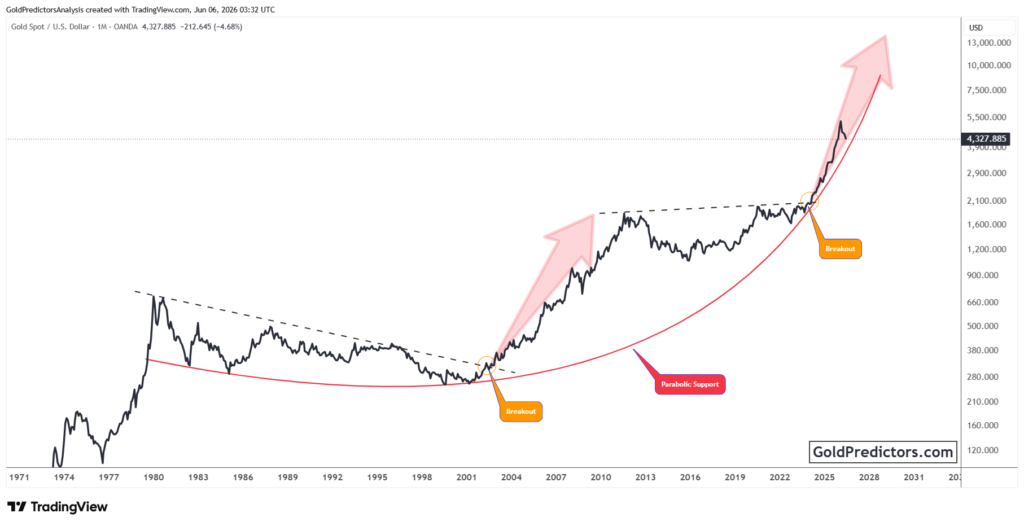
Despite the short-term price correction, the long-term outlook for gold remains bullish. It is also indicated by the USD to gold ratio in the chart below. This ratio shows the gold market has broken a long-term pivot, initiating a strong price surge. The last time a similar triangle was broken in 2000s, the gold market surged for 10 years, peaking in 2011. This time, the triangle break for the USD to gold ratio has also initiated a strong surge in the gold market, seen by the breakout above $2075 in spot gold. Therefore, the long-term direction for gold will likely remain upward in 2024.
On the other hand, the chart below shows price consolidation in May and June, indicating bearish patterns such as a head and shoulders formation. The chart also highlights a bear flag, which suggests bearish price action and the potential for a price correction. However, the choppy and overlapping price action in the gold market during June has created a risky environment, meaning that trading patterns need further clues to determine the next direction.

Bottom Line
In conclusion, the gold market trades sideways due to a lack of new drivers. This is also due to the uncertainty over the Federal Reserve’s interest rate decisions. While the Fed recently signalled only one rate cut this year, market expectations remain for two cuts in 2024 amid easing inflation. Weak US Retail Sales data and mixed messages from Fed officials have contributed to the current stagnation. This keeps gold prices around $2,300. Technically, the market shows potential for further upside after breaking a long-term triangle. However, price consolidation and bearish patterns in recent months suggest caution. Despite these short-term corrections, the long-term outlook remains bullish, with historical patterns indicating the potential for significant price increases, making current corrections a potential buying opportunity for long-term investors.
To receive premium updates and gold and silver trading signals, please subscribe via the link below.
