


Gold Technical Analysis: Cup Patterns Point to Bull Market
Gold has exhibited a strong and consistent uptrend since early 2024, with each breakout from consolidation patterns leading to sharp rallies. Starting in March, gold surged out of a wedge and continued forming bullish structures, confirming strong buying interest. By mid-2025, prices are expected to surpass $3,500, supported by recurring breakout signals. Long-term charts also reveal large cup-and-handle patterns, suggesting that years of accumulation have fueled this rally. These technical patterns reinforce the ongoing bullish momentum and indicate continued strength ahead.
Gold’s Consistent Breakouts and the Ongoing Bullish Trend Since 2024
The gold chart below shows multiple breakout patterns since early 2024, each followed by a strong upward rally. Starting from March 2024, gold broke out of a descending wedge pattern. This breakout marked the beginning of a consistent upward trend. The price rose sharply and formed a rectangular consolidation between April and August. Another breakout occurred in September, triggering a fresh rally that pushed prices to higher highs.
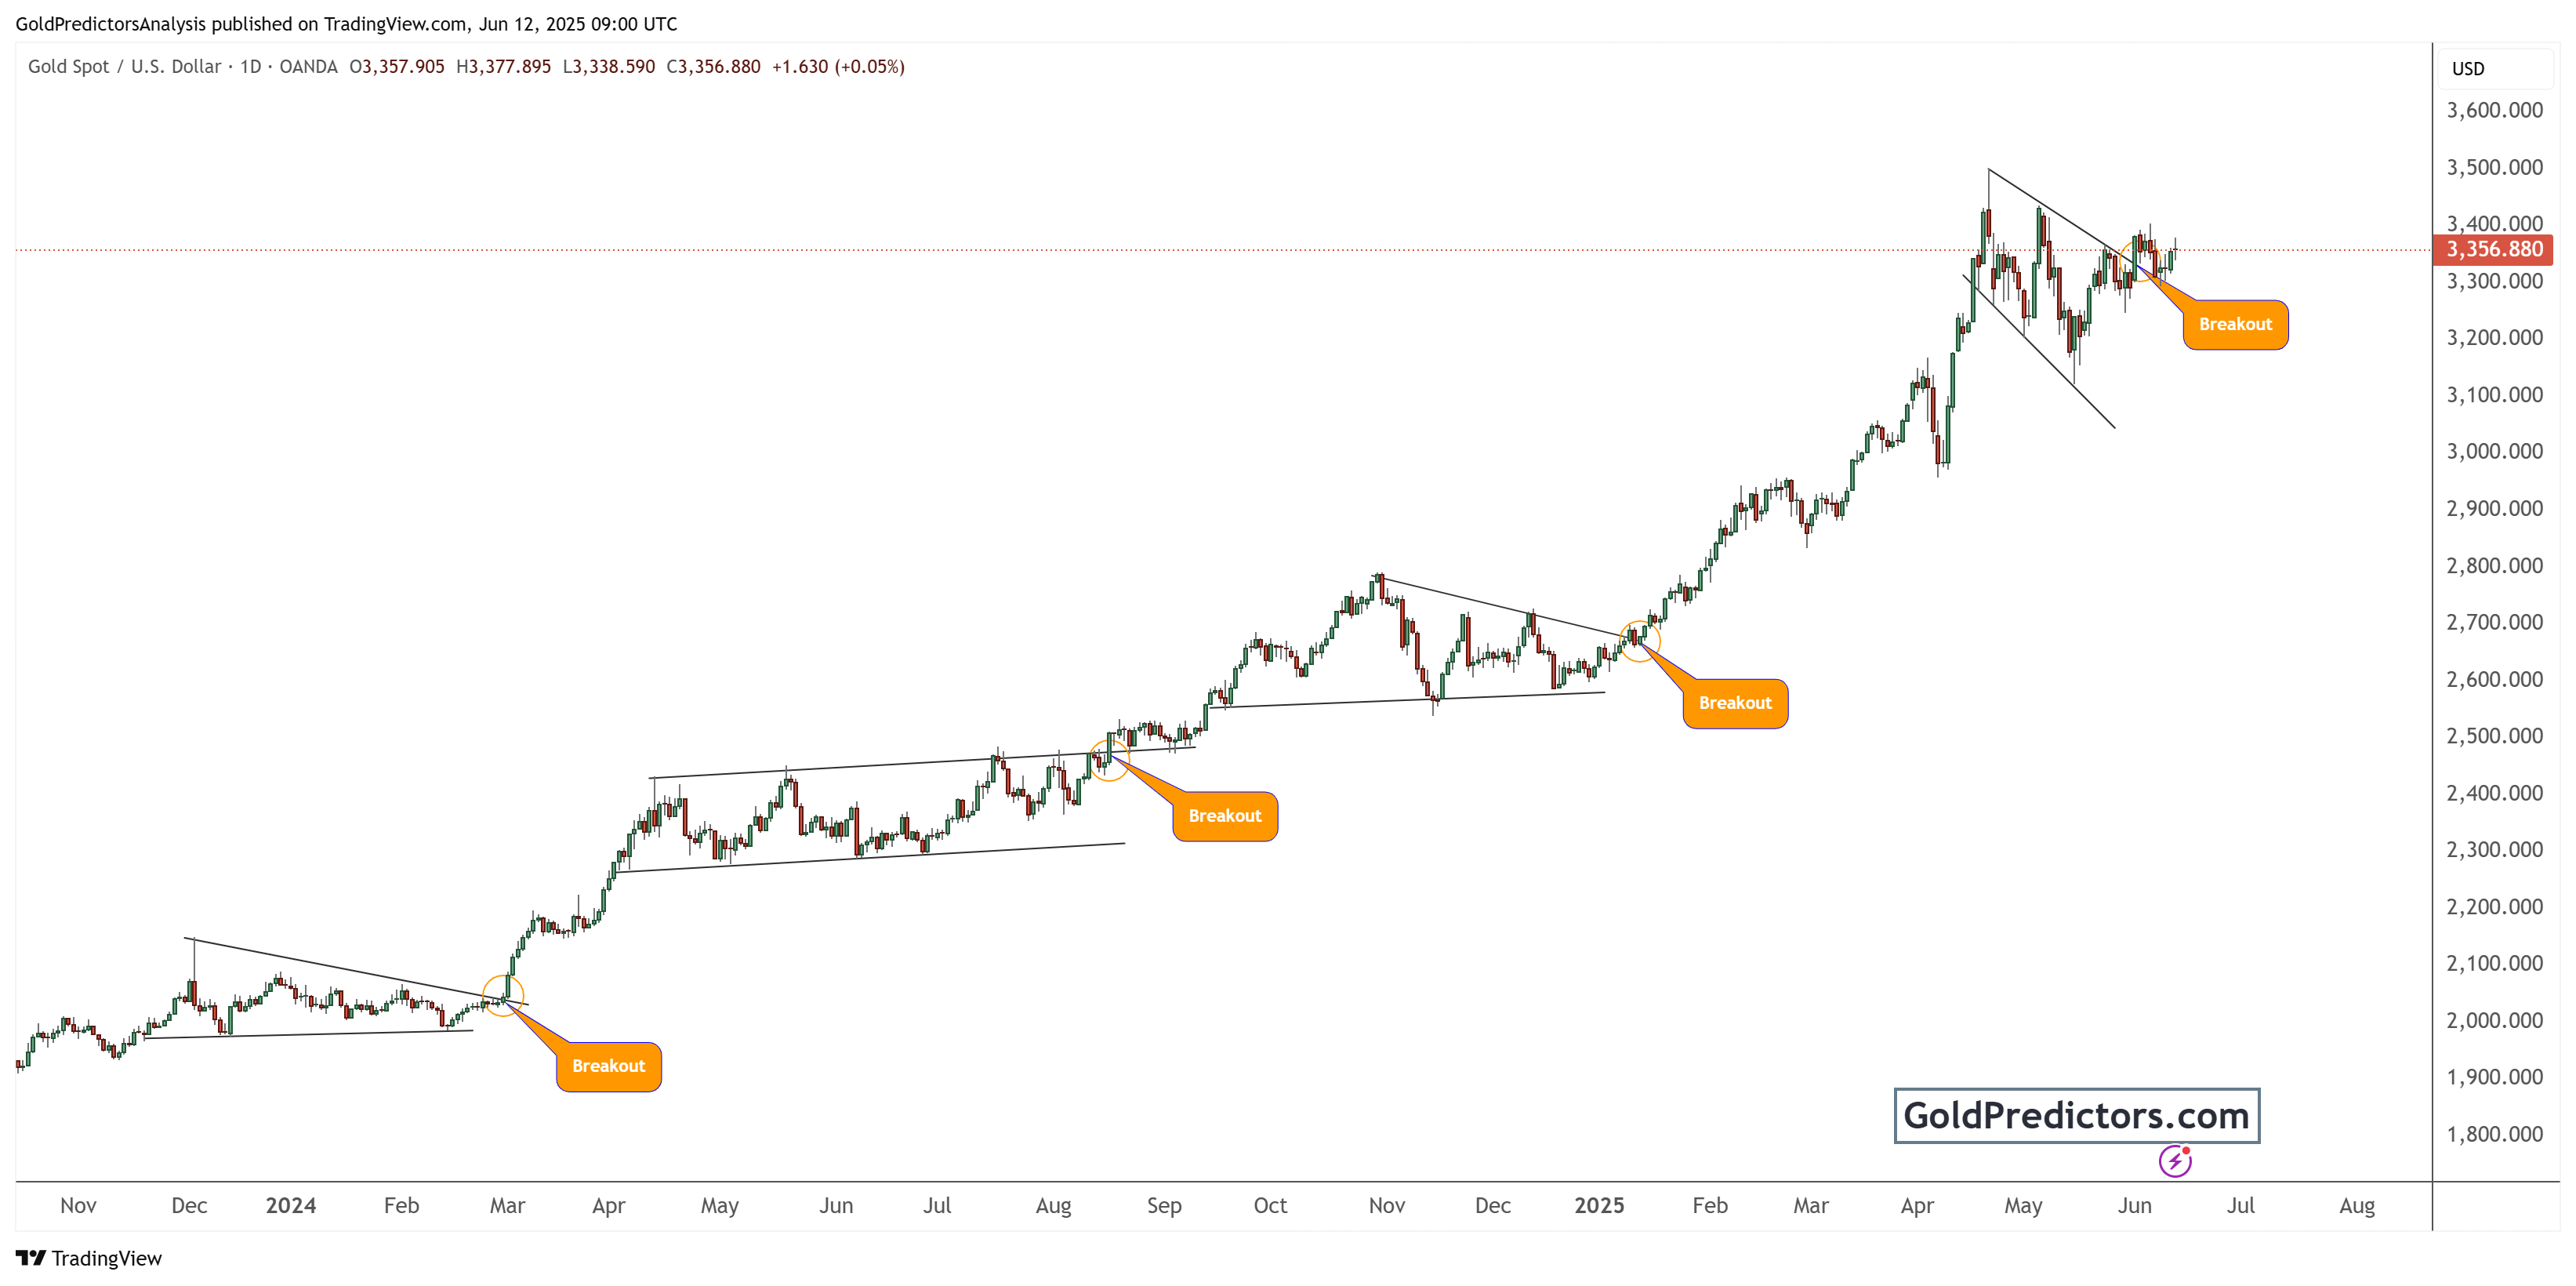
From November 2024 to January 2025, gold consolidated in a wedge pattern again. A bullish breakout occurred once more, confirming continued buying interest. This was followed by a powerful rally that pushed prices above $3,400 by mid-2025. The latest breakout visible in the chart shows that gold has just emerged from a small descending triangle, again confirming bullish pressure.
This consistent pattern of consolidation followed by breakouts is a classic signal of a strong trend. Traders and analysts view such behaviour as confirmation that demand is overpowering supply at key support levels.
Cup Formations Signal Long-Term Gold Bull Market
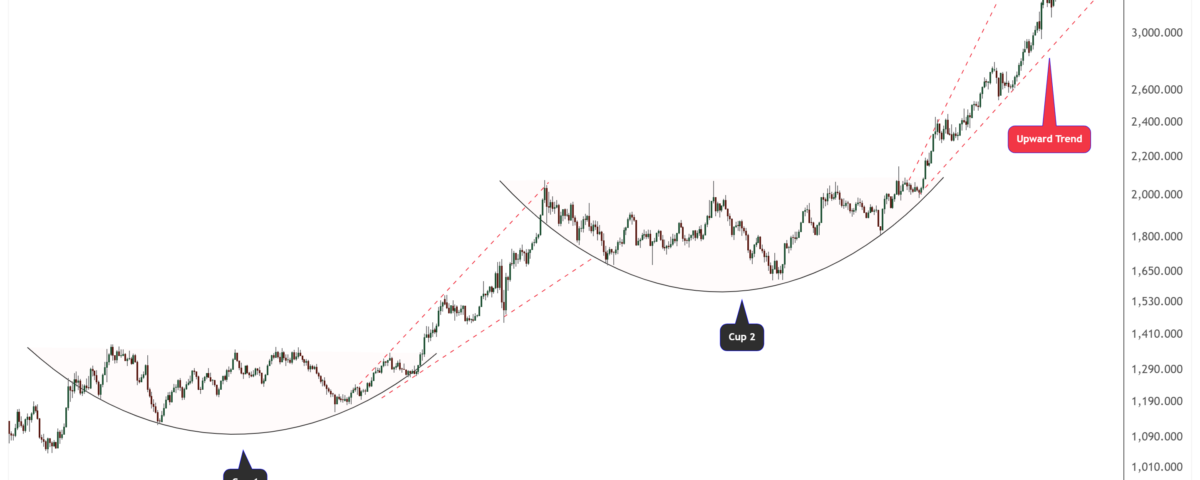
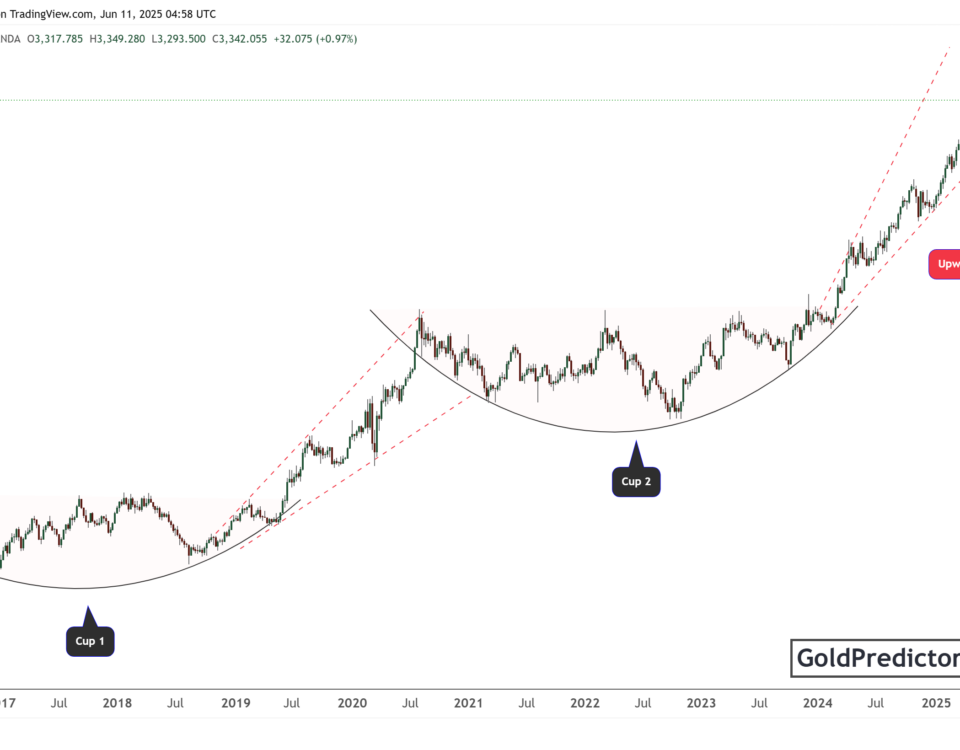
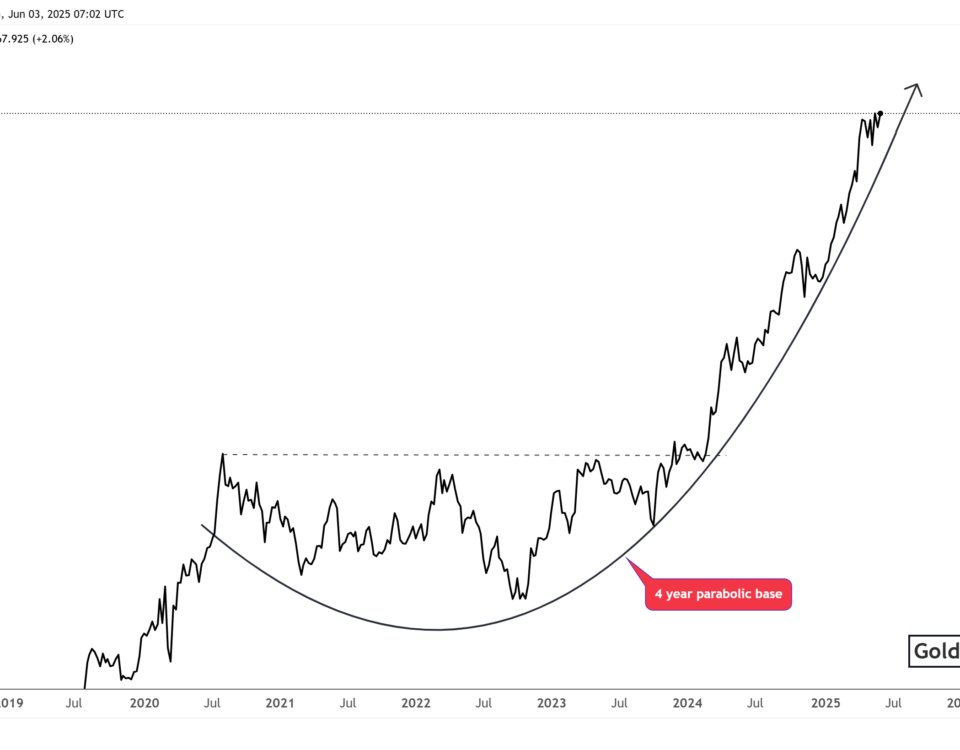
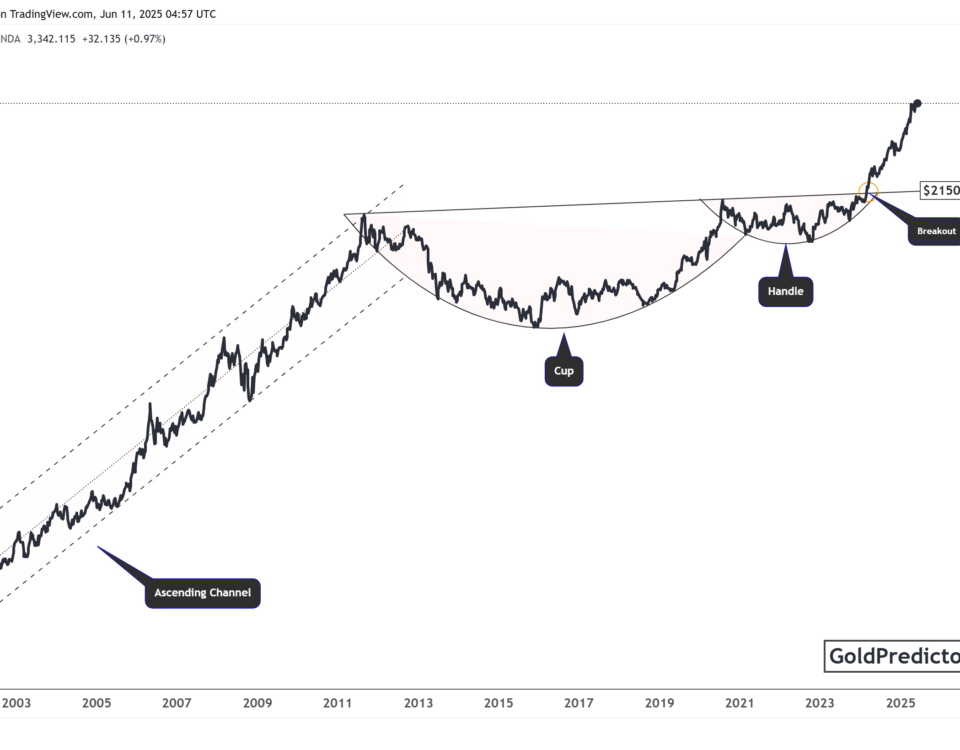
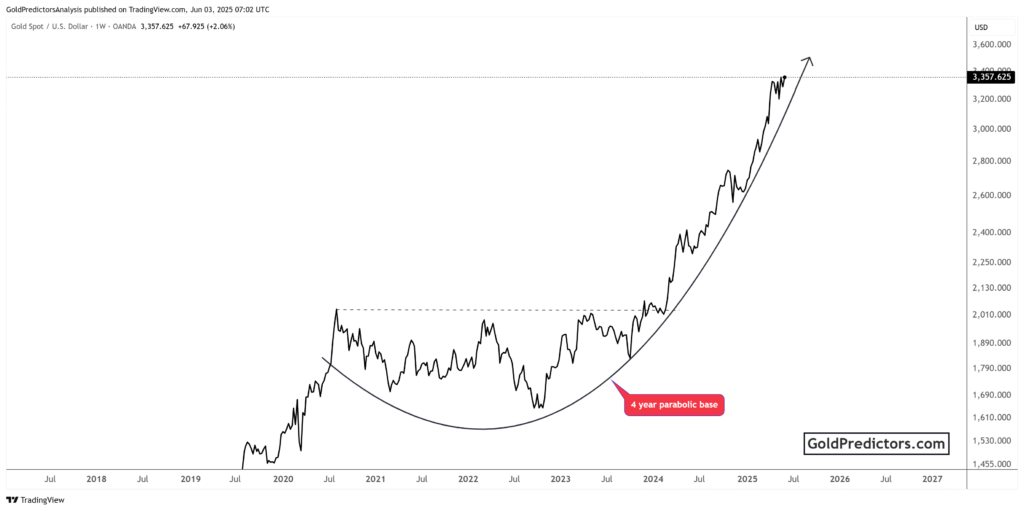
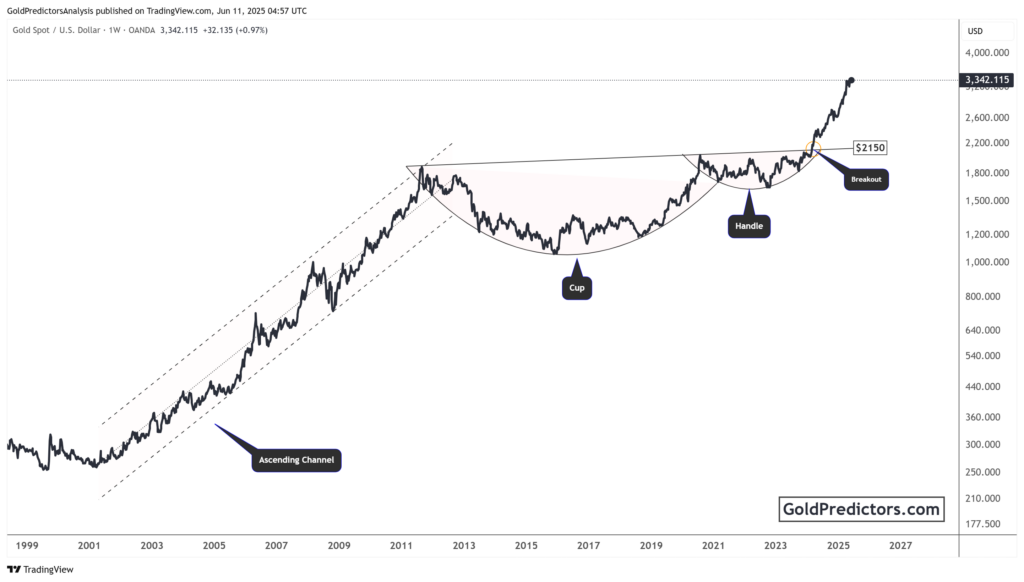
The chart below shows a longer-term perspective on gold’s rally, highlighting sustained bullish momentum over several years. It highlights two large “cup” formations, one spanning 2015 to 2019 and another from 2020 to late 2023. These formations are known as “cup and handle” patterns in technical analysis, which often precede strong bullish breakouts. These patterns reflect a gradual accumulation phase that transitions into an explosive upward trend.
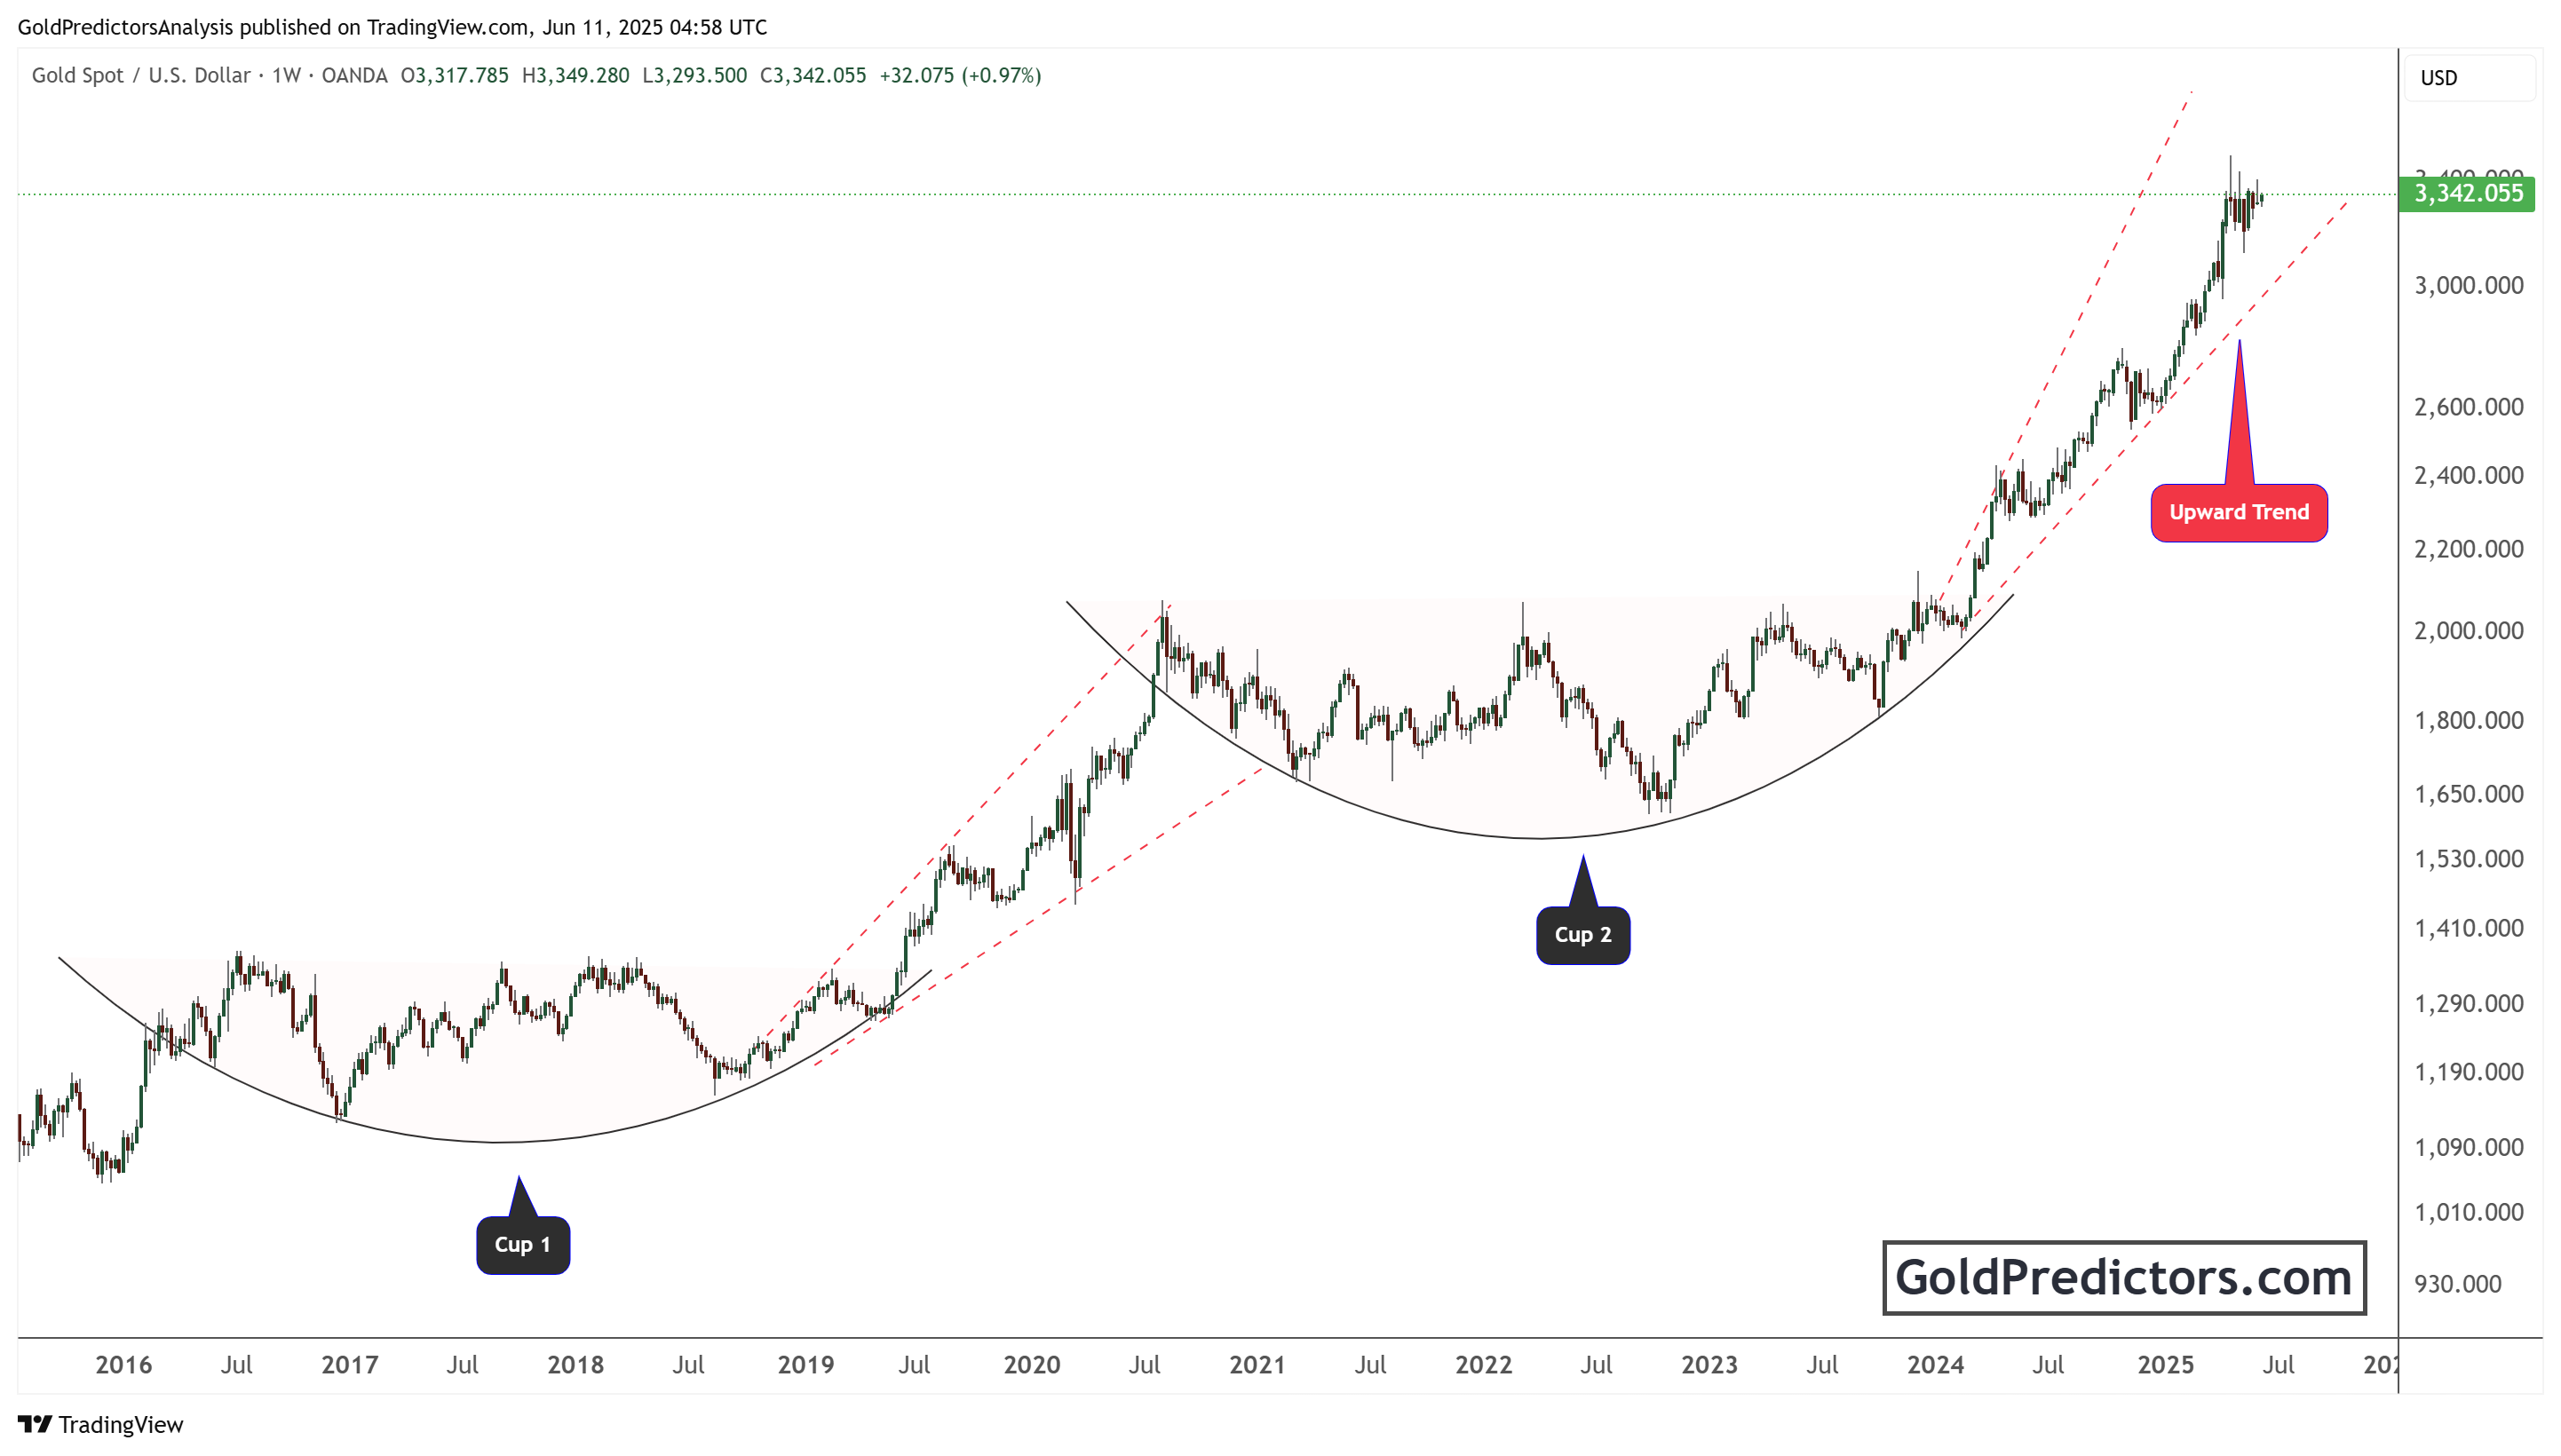
The earlier consolidation phase was completed in 2019, with gold entering a rising wedge breakout. Meanwhile, a broader accumulation pattern concluded in early 2024, leading to a strong upward move. This resulted in another breakout, leading to a sharp upward trend channel that is still in motion as of June 2025. The trend lines suggest that gold is maintaining its position above key support areas, and the momentum remains bullish.
Gold has already broken above the $3,300 level, and current market action shows strong support above this zone. As long as this support holds, the trend is likely to continue higher. The sharp rise in 2025 is consistent with historical patterns following extensive accumulation periods. This long-term view reinforces the short-term breakout trends seen in the daily chart.
Conclusion: Gold’s Strong Momentum and Long-Term Patterns Pointing to Higher Prices
Gold continues to show strength in 2025, with each breakout confirming sustained buying interest. The recurring pattern of consolidation followed by strong upward moves highlights persistent bullish momentum. This behavior aligns with classic technical signals that indicate trend continuation.
The presence of long-term cup-and-handle formations adds further weight to the bullish outlook. These patterns suggest years of accumulation are now fueling sharp gains. The ongoing rally is part of a broader trend channel, supported by strong technical foundations.
With gold maintaining levels above key support zones, the path of least resistance remains upward. If the current momentum persists, gold is likely to continue rising through the remainder of 2025. Both short-term and long-term charts support a positive outlook for the gold market.
Gold Predictors Premium Membership
Get exclusive short-term and swing trade ideas with precise entry levels, stop-loss, and target prices, including justification and analysis — all delivered directly via WhatsApp.
Our premium service includes deep technical analysis on gold and silver markets. We cover cycle analysis, price forecasting, and key timing levels.
Members also receive a weekly market letter with detailed analysis, commentary from our Chief Analyst, including actionable insights, trade timing, and direction forecasts for gold and silver.
Stay ahead of the market — join our premium community today.