Gold Price Structure
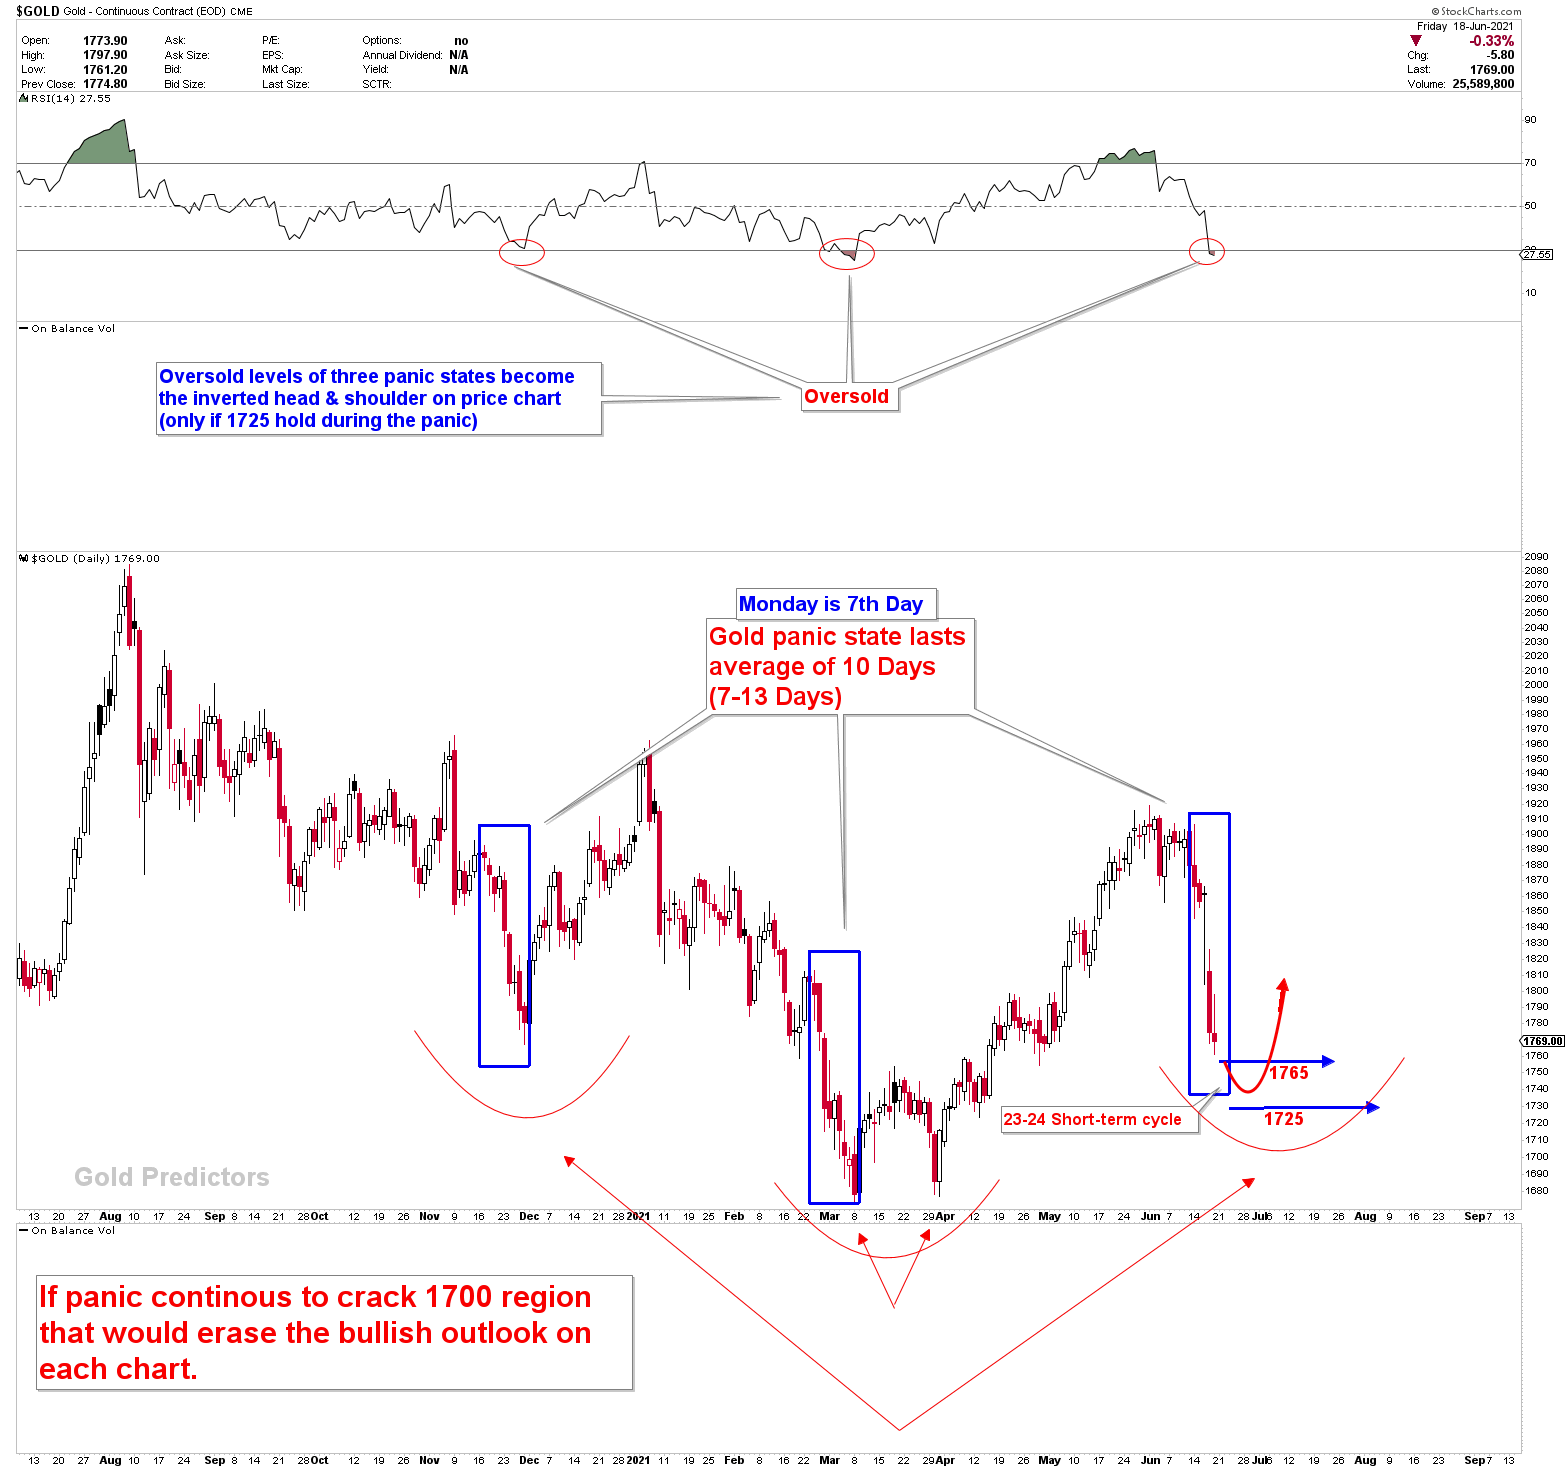
Gold prices reversed from 1751 and are currently trading around the 1800 region. The Dollar index hit the resistance last week and produced a quick reversal on the first resistance. This reversal can be observed on other USD correlated charts. We have been sending multiple emails and WhatsApp messages to understand the possible gold scenarios. It looks like gold followed the expected path last week. The rounding bottom which was expected between 1765 and 1725 was near to complete the gold price structure but there were no confirmations of this bottom on daily and weekly charts.
As shown in the chart below, the turn of the gold market from 1765 (major) developed two possible scenarios which will be discussed here. Today’s report will focus on the short term and medium term perspective of gold and silver prices using daily, weekly and monthly price structures to understand the future outlook of gold and silver prices.

Highlights
US steel prices are surging. US companies are short of labour, which is causing shipping and labour costs to surge. As suppliers pass on cost increases to customers, a surge in input costs could cause a temporary spike in consumer prices. However, the price spike could be much larger than the market anticipates. The bond market appears to be pleased with the June labour report, with 10-year Treasury yields falling sharply.
To receive free updates, please register as free member.


