


Gold Price Nears $3,000: Will the Rally Continue or Is a Correction Ahead?
Gold has shown remarkable growth over the past year, reaching new highs. Investors and traders closely watch its movement as it approaches the significant $3,000 mark. Despite reaching this key level, there are no signs of a correction, and the potential trend remains strong. The ongoing global trade crisis is fueling this rally.
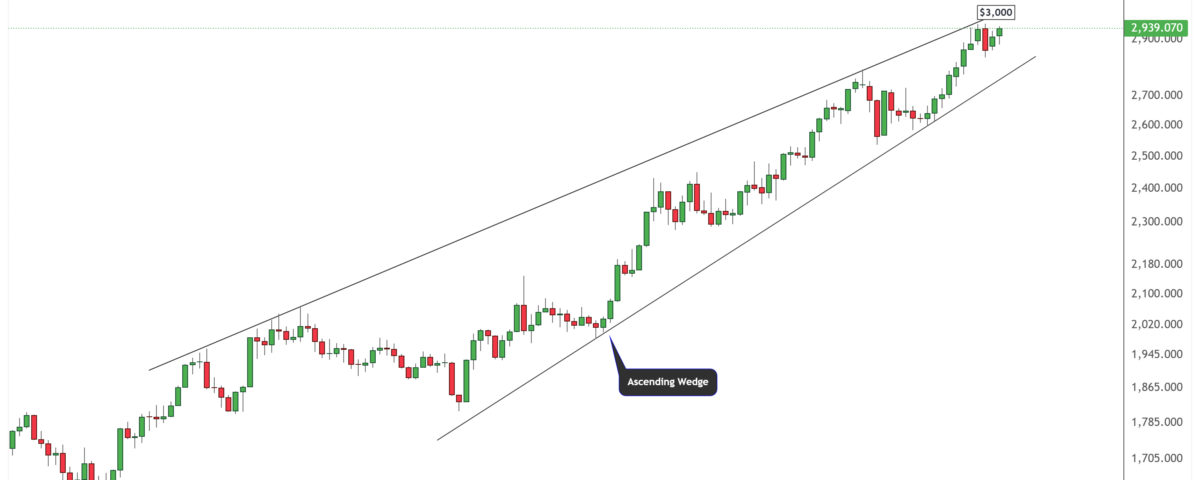
Ascending Wedge Signals Key Breakout Levels at $3,000
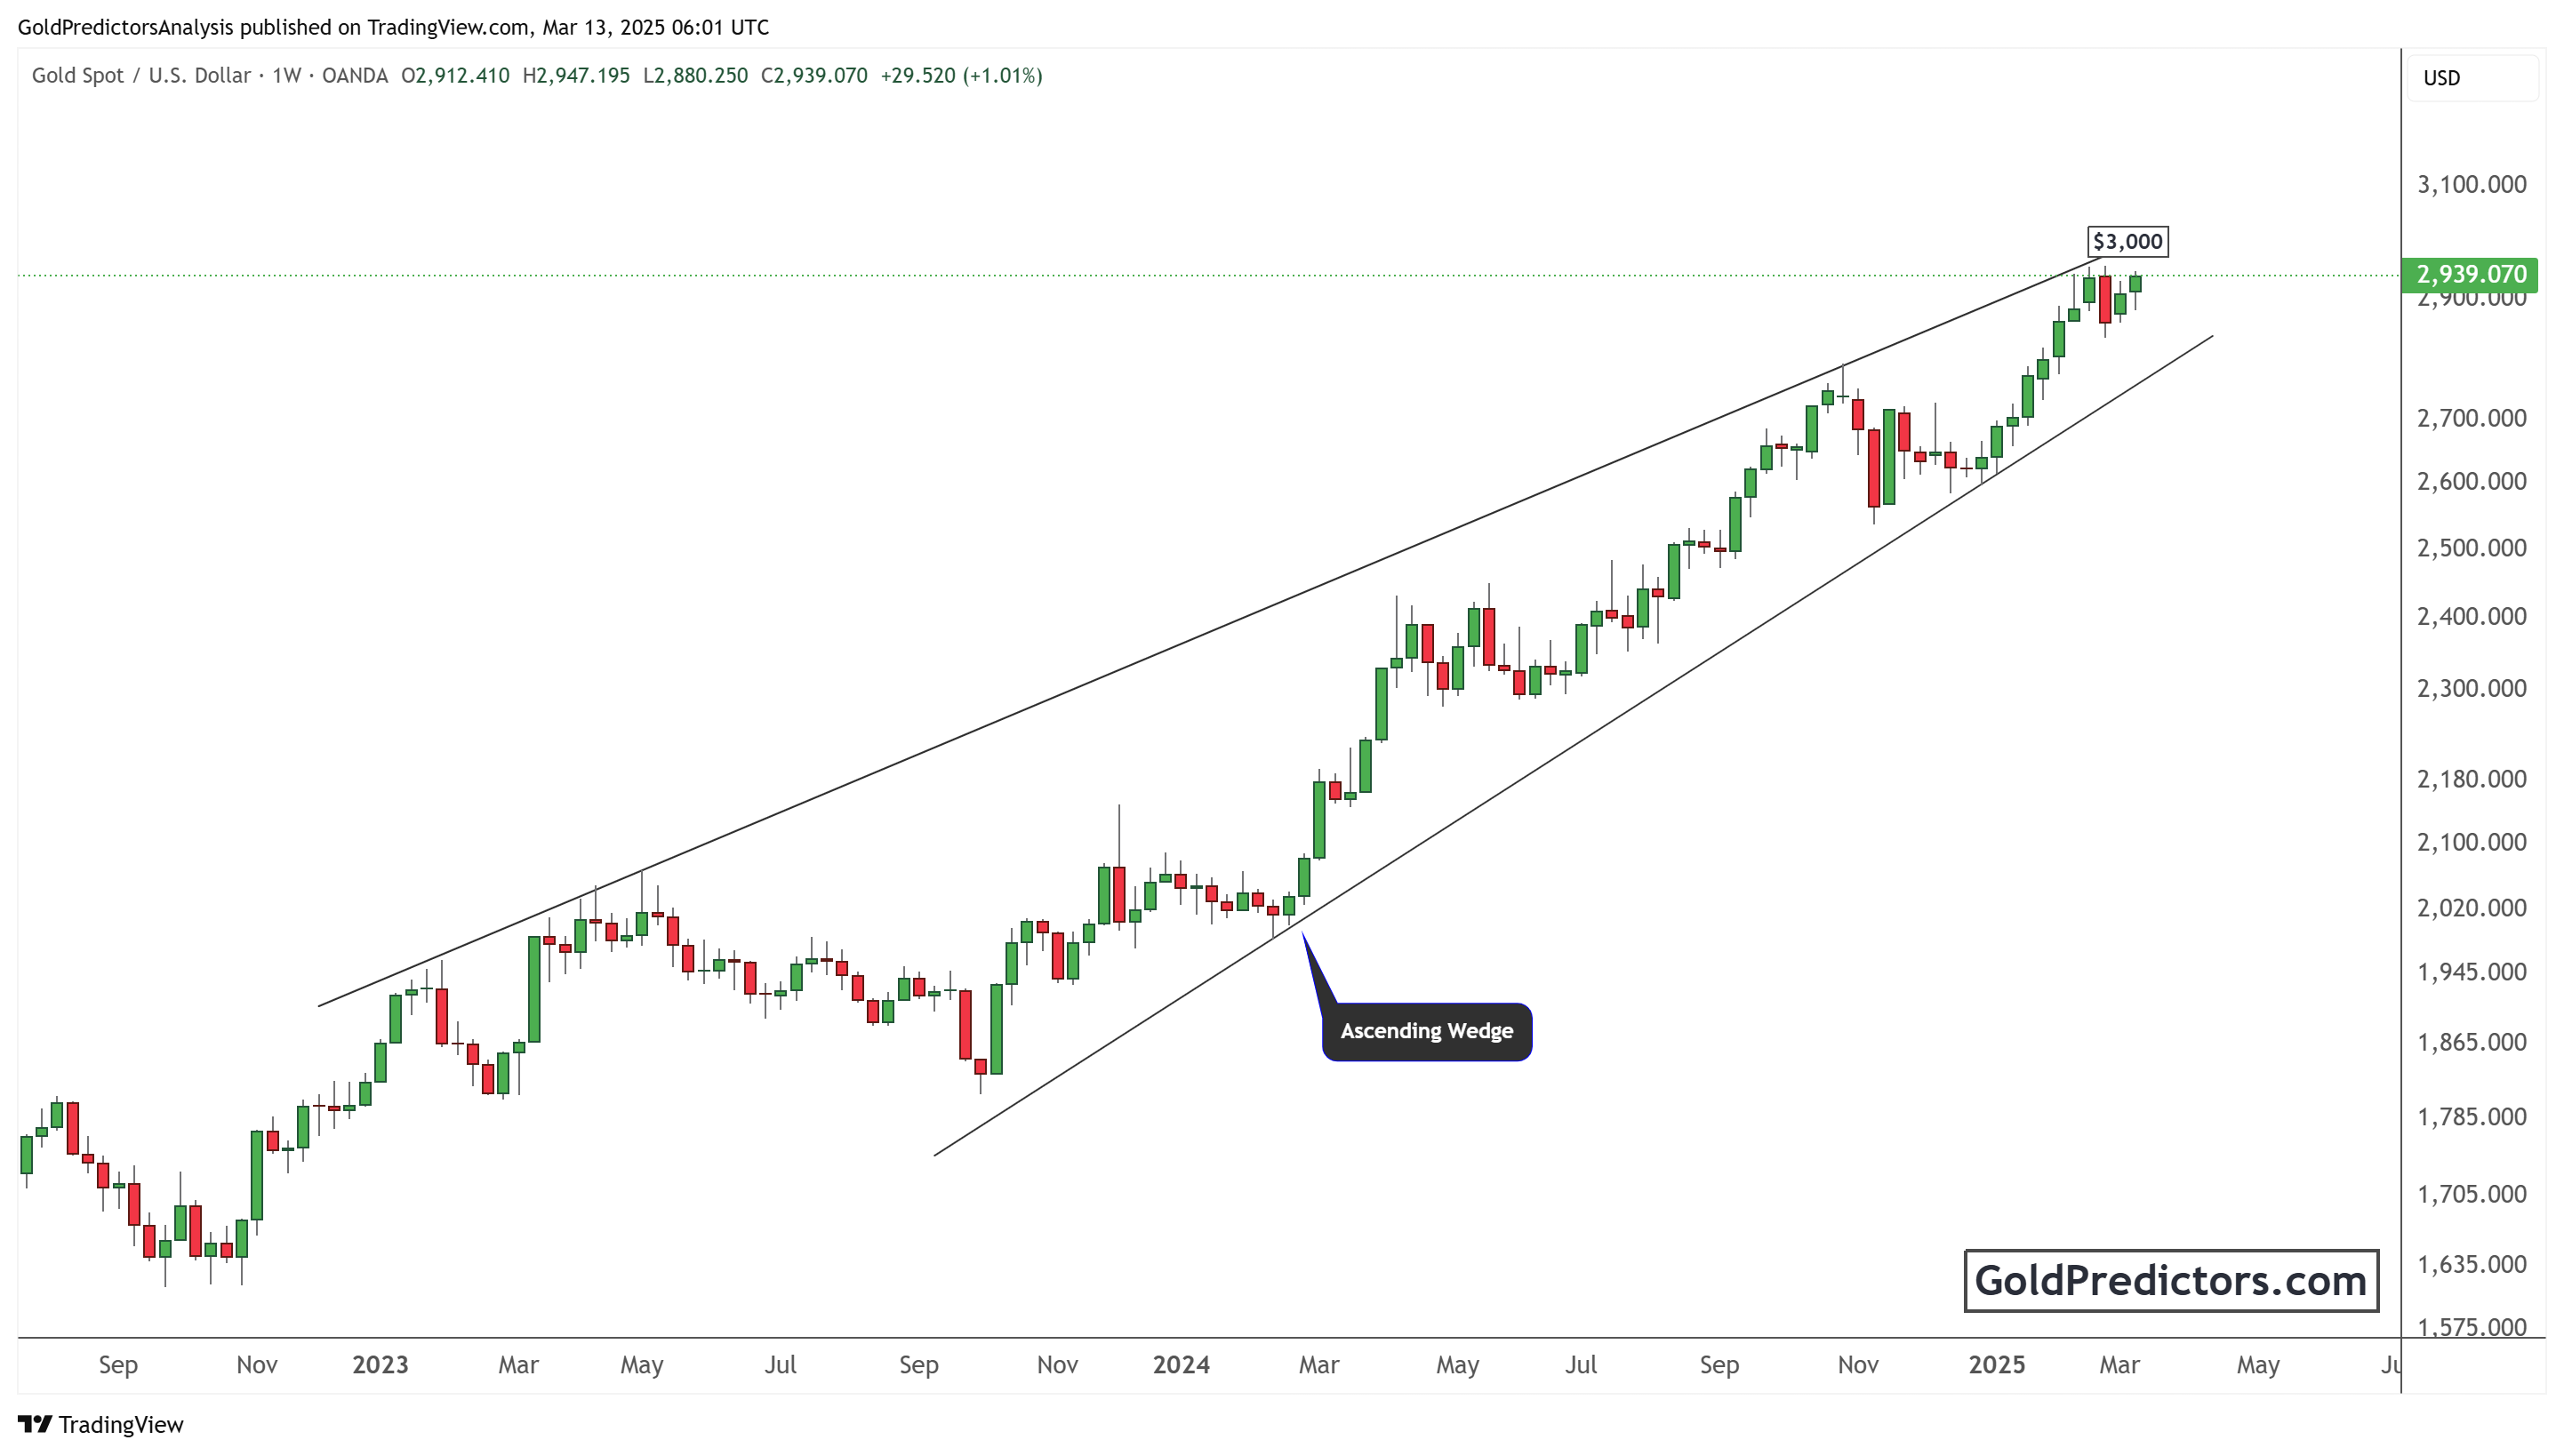
The weekly chart below highlights an ascending wedge pattern in gold prices. This pattern typically signals potential weakness as the price moves upward while losing momentum. However, this price action indicates strong bullish momentum based on broader market developments and the monthly price outlook. The chart shows that the price is approaching the targeted zone of $3,000. This long-term target was discussed with premium members in 2022. We clearly mentioned that a breakout above $2,075 would quickly push prices toward $3,000. The breakout of $2,075 has resulted in this rapid rally. The chart below illustrates a steady rise from early 2023, with gold climbing from below $1,800 to nearly $3,000 in March 2025.
The price has remained within the wedge, testing its upper boundary multiple times. If gold breaks above $3,000, it could trigger a further rally. However, if the pattern holds, a correction may push prices back toward the lower support line around $2,800. A break above $3,000 could open the door to the $3,200 price zone. The likelihood of reaching this level and the breakout probability will be discussed with premium members from a cyclical perspective.
However, the overall price action suggests that gold remains in a strong uptrend. The bullish momentum is intact, but traders must watch for a breakout confirmation or a possible reversal. The next few weeks will be critical in determining the future direction.
Gold’s Strength Against SPX: What the Breakout Means for Investors
The chart below presents the gold prices against the S&P 500 index (SPX). This ratio is an important indicator for investors deciding between gold and stock market investments. This is also important in determining the possibility of a gold trend. The chart shows that gold has been underperforming stocks for several years, but a reversal occurs.
A key resistance level at 0.48 was broken in March 2025. This breakout indicates that gold is gaining strength relative to stocks. However, March 2025 must close above 0.48 to confirm this breakout. Historically, such movements have led to significant rallies in gold prices. If this trend continues, gold may outperform equities shortly, attracting more investors looking for safety and stability.
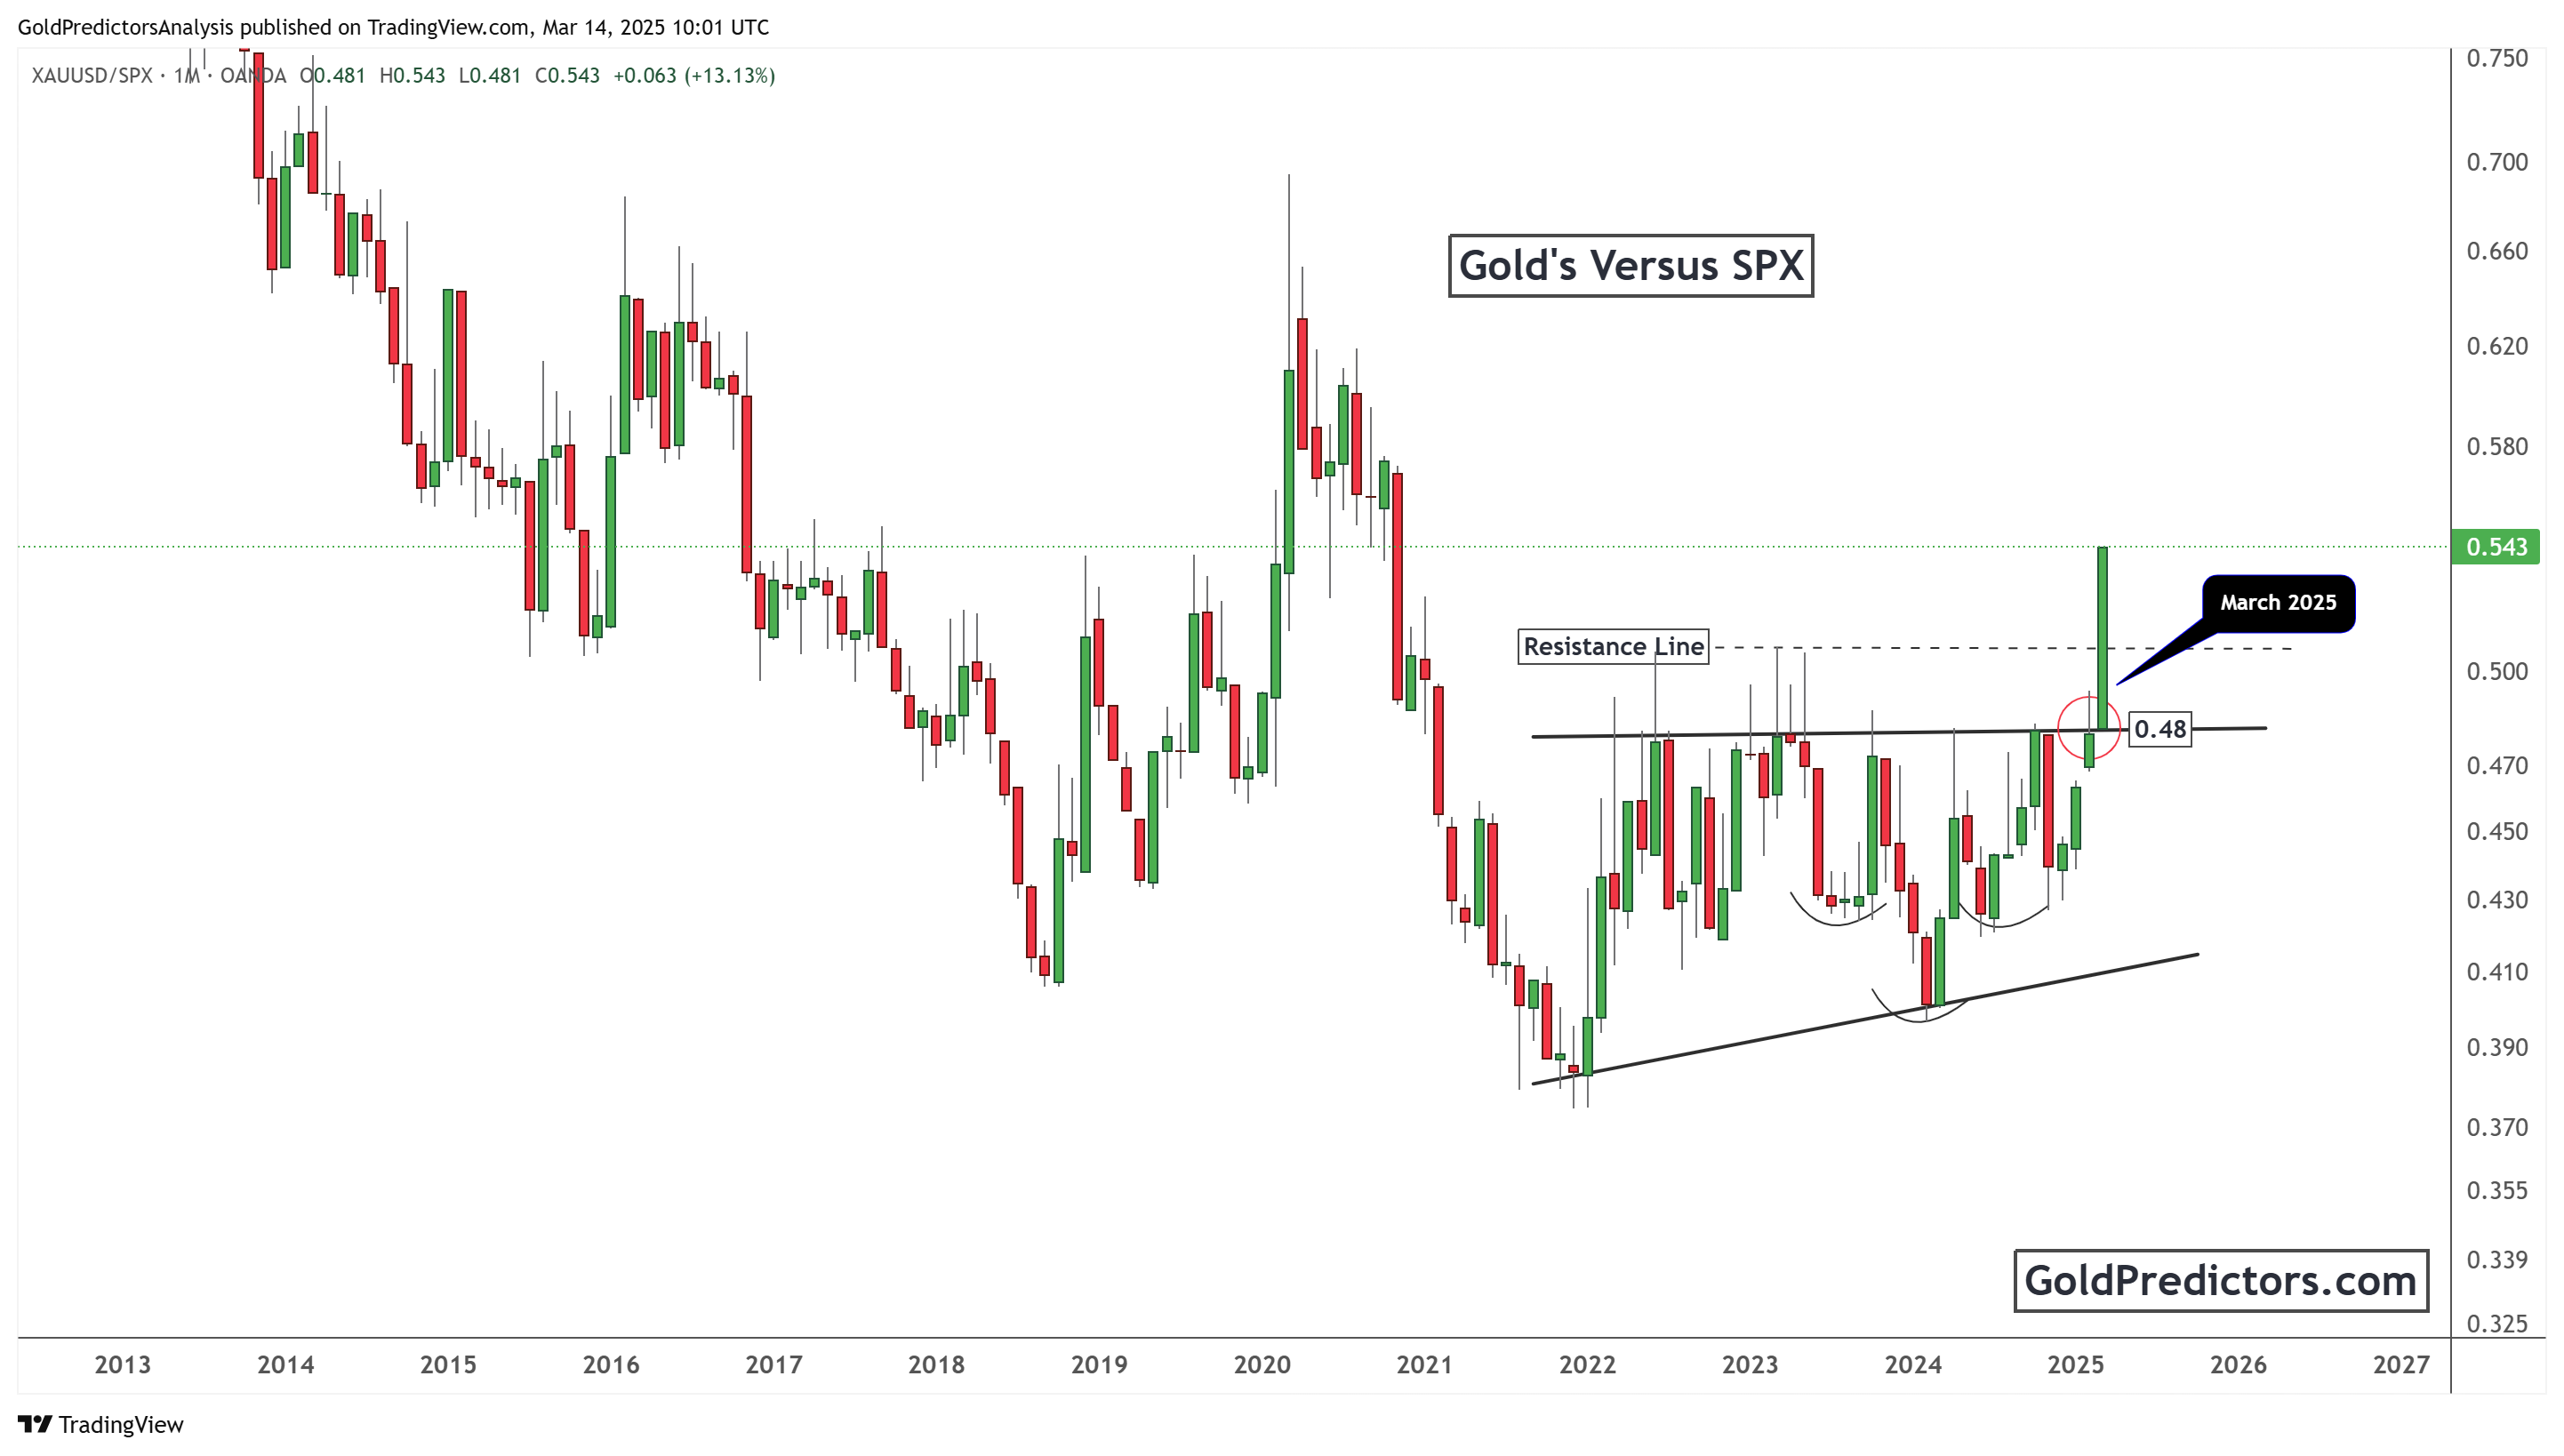
The pattern in the above chart resembles an inverted head and shoulders formation, a bullish signal in technical analysis. This suggests that gold’s upward momentum is likely to persist. Investors should monitor this breakout to confirm its sustainability.
Conclusion
Gold is currently trading at the critical psychological level of $3,000, which has been proved by technical analysis. The ascending wedge pattern indicates a potential correction, while the breakout against SPX suggests continued strength. If gold maintains its position above $3,000, it could enter a new bullish phase. However, a failure to hold this level may lead to a temporary decline. A break above $3,000 will open the door for the $3,200 level.
Investors should focus on support and resistance levels in the coming weeks. If a breakout occurs, gold could surge to $3,100. On the other hand, a pullback may provide a buying opportunity for long-term investors. Gold remains a valuable asset, especially in uncertain economic conditions. The next price movements will determine whether this rally continues or takes a pause before the next leg up.
To receive gold and silver trading signals and premium updates, please subscribe here.


