Gold Narrow Range After Yearly Pivot of $2,075 | Gold Predictors - Forecasting Gold Prices

New York

London

Sydney

Tokyo

Log In

  • Register
  • Lost your password?
gold predictorsgold predictorsgold predictorsgold predictors
  • HOME
  • ABOUT US
    • About Us
    • Social Networks
    • Industry Links
    • Testimonials
  • RESEARCH
    • Scientific Trade Strategies
    • Gold Hub
    • Gold Importance
    • Silver Importance
  • GOLD HUB
  • GOLD ANALYSIS
    • Gold Analysis
    • Technical Analysis
      • Trend Identification
      • Phase Identification
      • Important Levels
      • Volatility Measurement
    • Gold Cycle
      • Short Term Cycles
      • Medium Term Cycles
      • Long Term Cycles
    • Price Action Analysis
      • Phase Identification
      • Historical Pattern Identification
      • Candlestick Pattern Identification
    • Fundamental Analysis of Gold
    • Gold Related Markets Analysis
    • Gold Seasonal
  • TRADING METHODOLOGY
    • Gold Analysis
      • Technical Analysis
      • Gold Cycle
      • Price Action Strategy
      • Fundamental Analysis
      • Gold Related Markets Analysis
      • Gold Seasonal
    • Measure Signal Strength
      • Weak Signal
      • Strong Signal
      • Confirmed Signal
    • Trading Decision
    • Trading Rules
      • Basic Trading Rules
      • Gold Predictors Trading Rules
    • Trade Examples
    • Performance
  • LIVE CHARTS
  • MEMBERSHIPS
    • Free Membership
    • Premium Membership
    • SignUp
  • MEMBERS AREA
    • Free Article
    • Premium Article
    • Trading Signals
    • Long Term Signals
    • Forex Reports
    • Crypto Reports
  • FOREX REPORTS
  • HELP
    • FAQ
    • Contact Us
Login / Register

Gold Narrow Range After Yearly Pivot of $2,075

0
Published by admin at April 7, 2022
Categories
  • Premium Articles
Tags

Gold price was range-bound for the second day in a row on Thursday as it continued to struggle to establish any momentum. While trading in a tight range during Europe’s morning session, the gold price was trading slightly below the $1,925 mark, almost unchanged from earlier in the day. There was a growing consensus among policymakers at the March 15-16 FOMC meeting that inflation had expanded across the economy and that monetary policy should be tightened.  Based on the decision of participants, they were prepared to raise interest rates by 50 basis points at future meetings and lower the central bank’s large balance sheet to improve financial stability. For this reason, the yellow metal was seen to be facing an uphill battle.

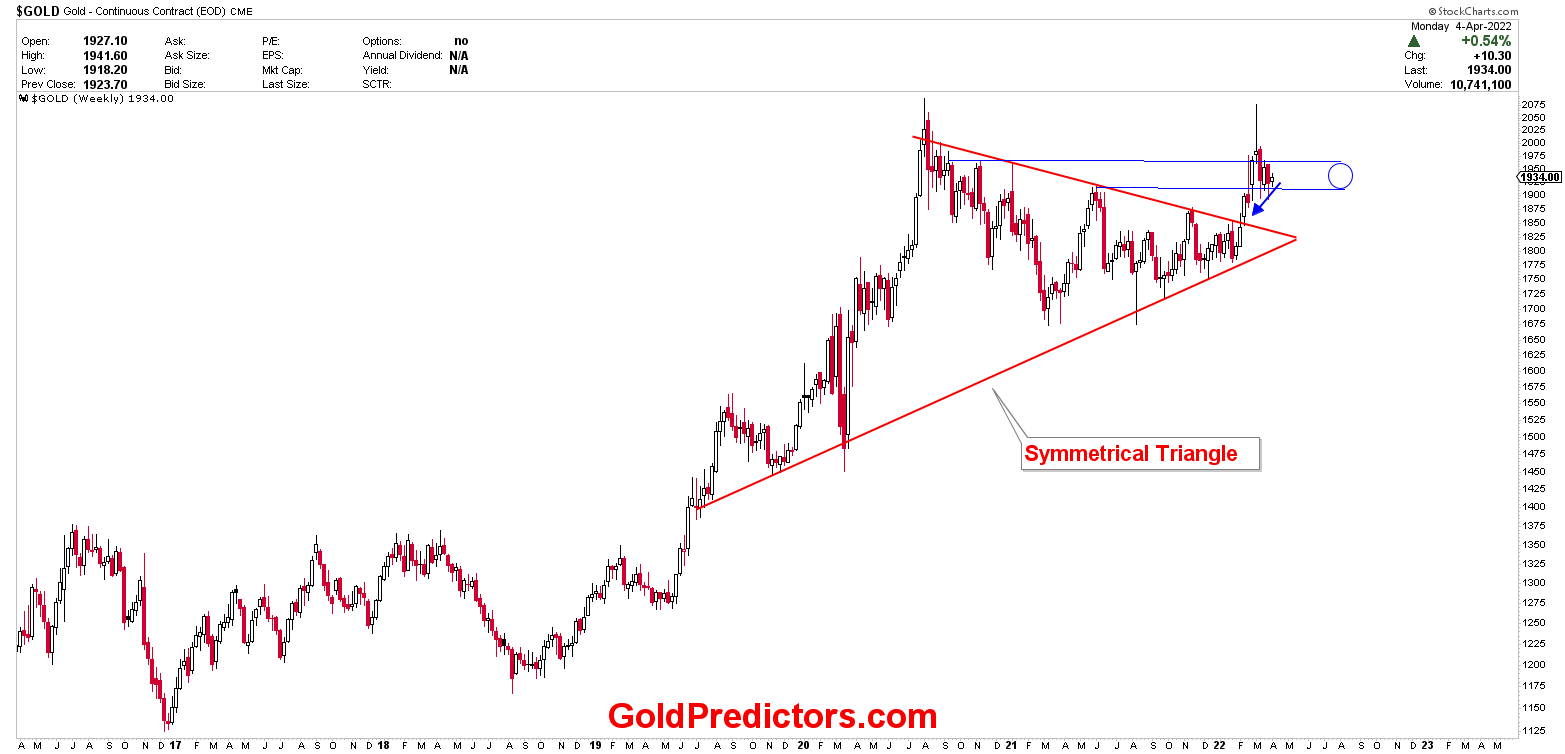
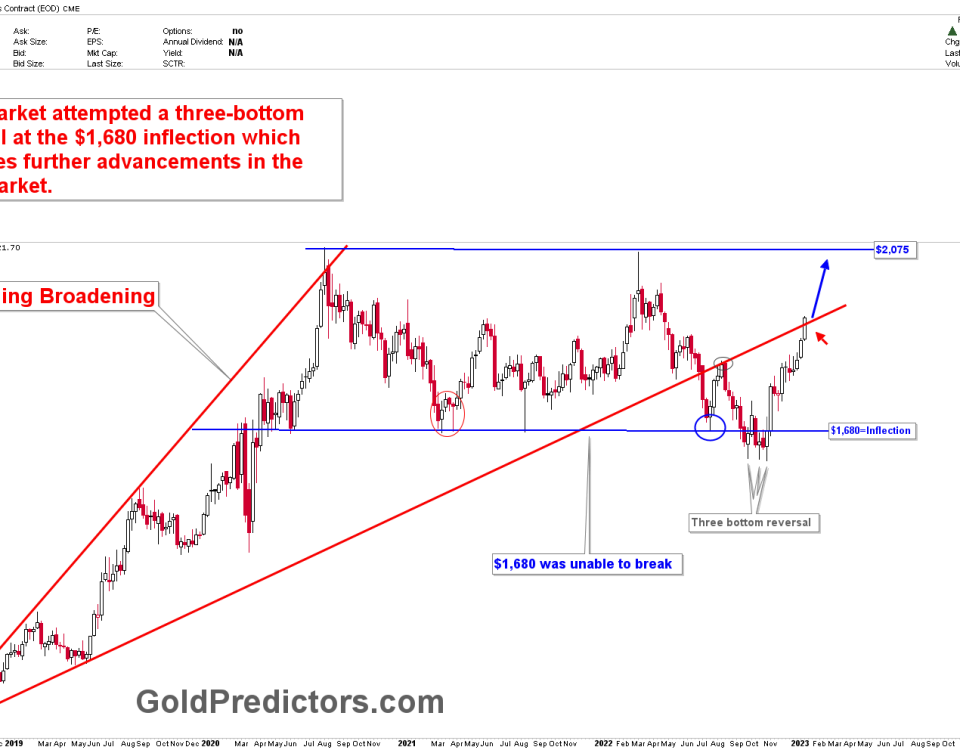
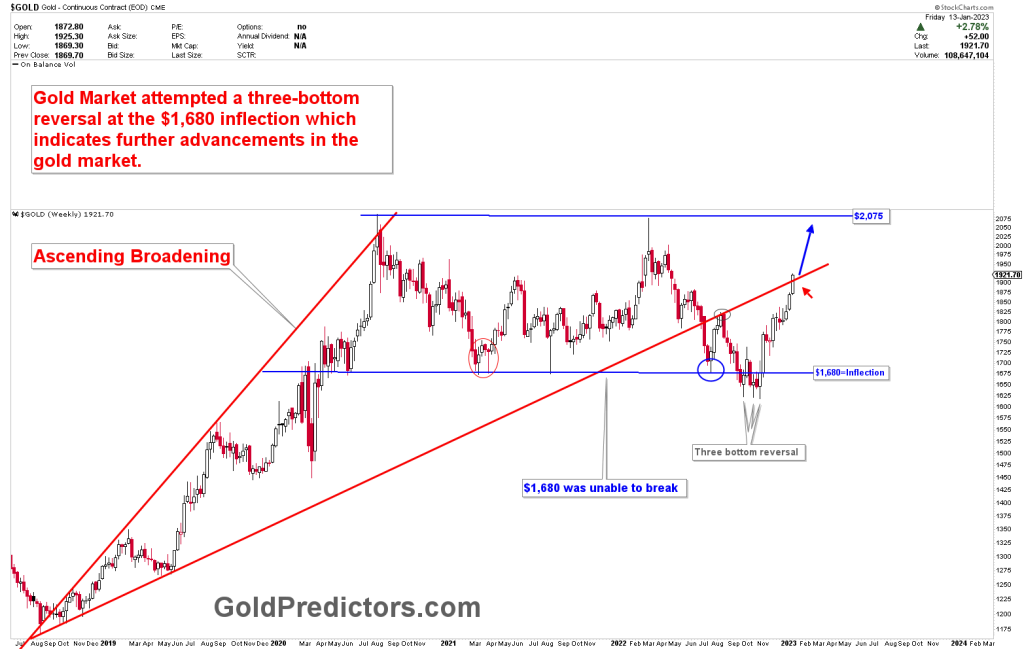
Looking at the technical chart, prices have broken through the symmetrical triangle to reach the $1,970s resistance zone. As previously discussed in premium updates, the yearly pivot is $2,075 and this would be the entry point to all-time highs. The high for spot gold was $2,070, and prices have since dipped below $1,920 to consolidate gains. Prices have recently been fluctuating in the blue circular zones in narrow ranges. This article will go over the technical charts to understand the next move in precious metals.

Anxieties about a political settlement to the Ukraine conflict and the Fed’s plans dampened global risk sentiment. This was obvious from a generally worse tone in the equity markets, which bolstered the gold price. Due in part to a little decline in US Treasury bond rates, anti-risk flows were further bolstered and helped limit the downside for dollar-denominated commodity prices. Technical analysis shows that the spot gold has been fluctuating for the last one-and-a-half weeks or so in an oscillating range. Aggressive traders should exercise care in light of this and prepare for a clear direction.

Please login to read full article!

Please subscribe to the link below to receive free updates.

Free Membership

This content is locked

Login To Unlock The Content!

Username:
Password:

Related posts

January 29, 2023

Premium Updates Are Mostly Delivered Using Emails


Read more
recession
January 28, 2023

Gold – A Recession Warning


Read more
gold ascending broadening
January 15, 2023

Gold: Bullish Short-Term Structure


Read more

Comments are closed.

ABOUT US

  • About Us
  • Social Networks
  • Industry Links
  • Testimonials
  • Terms & Conditions

TECHNICAL ANALYSIS

  • Technical Analysis
  • Trend Identification
  • Phase Identification
  • Important Levels
  • Volatility Measurement

CYCLE ANALYSIS

  • Gold Cycle
  • Short Term Cycles
  • Medium Term Cycles
  • Long Term Cycles

PRICE ACTION ANALYSIS

  • Price Action Analysis
  • Phase Identification
  • Historical Pattern Identification
  • Candlestick Pattern Identification
© 2017 Gold Predictors. All Rights Reserved.
  • Remember Me
    Lost your password?
    Dont have an account?Sign Up