


Gold Buying Opportunity
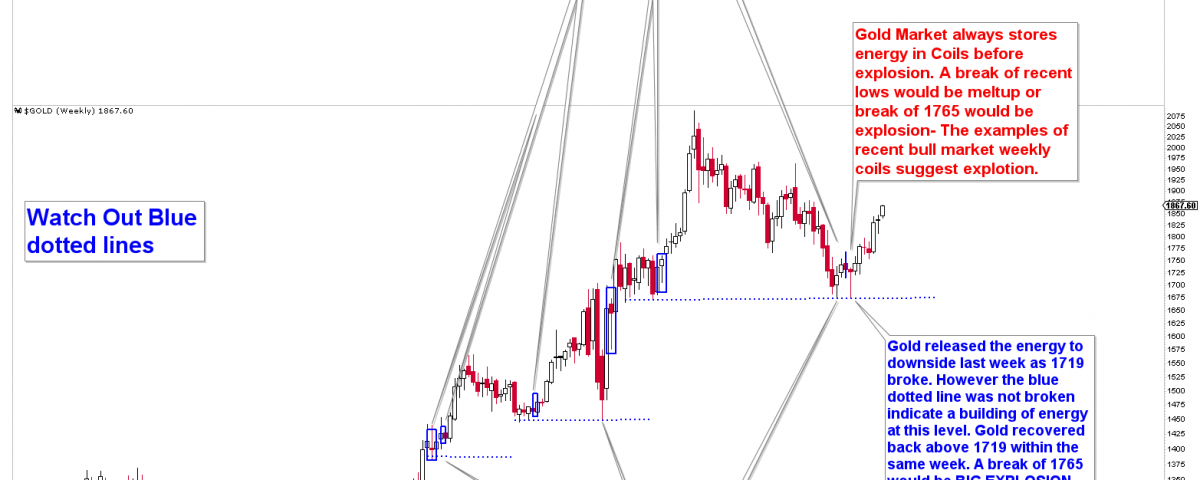
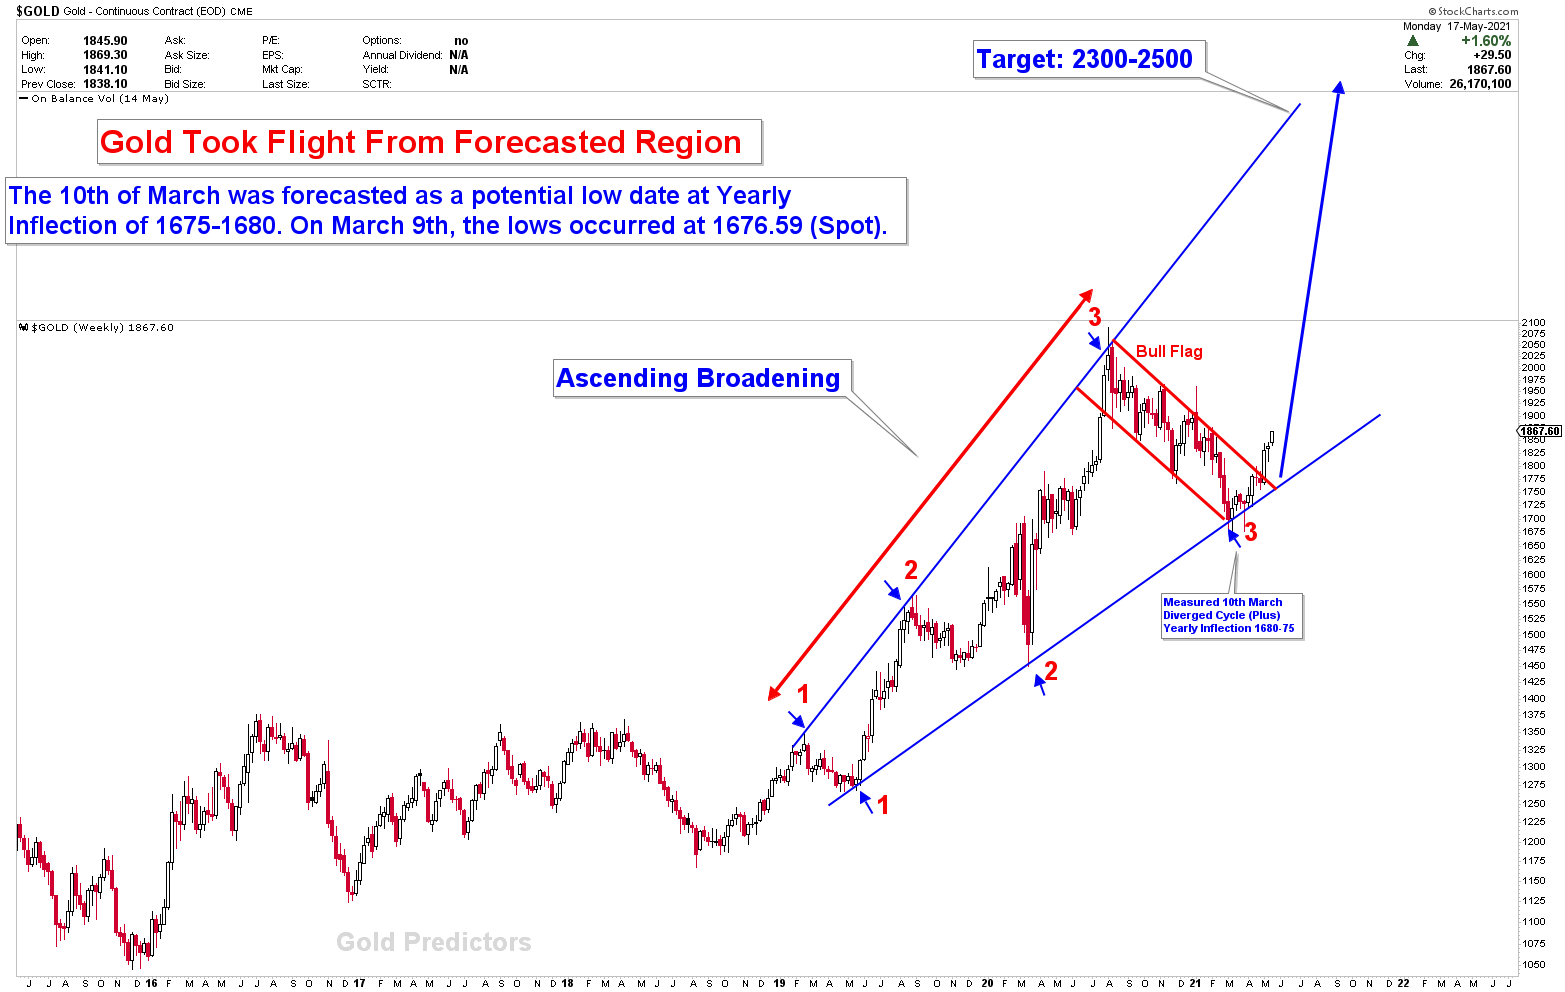
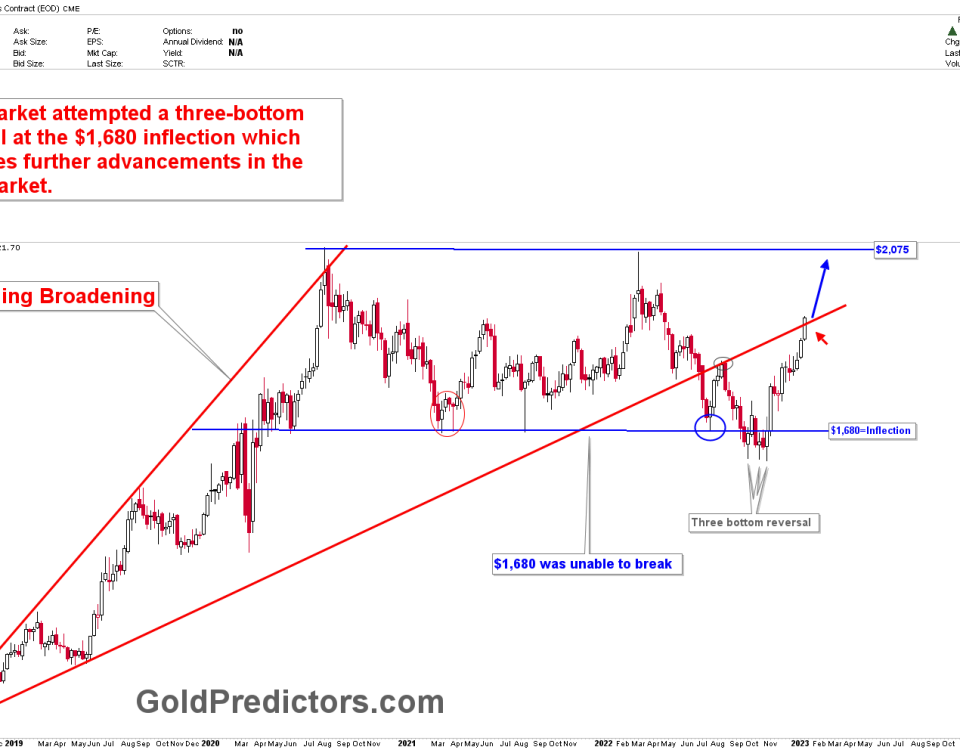
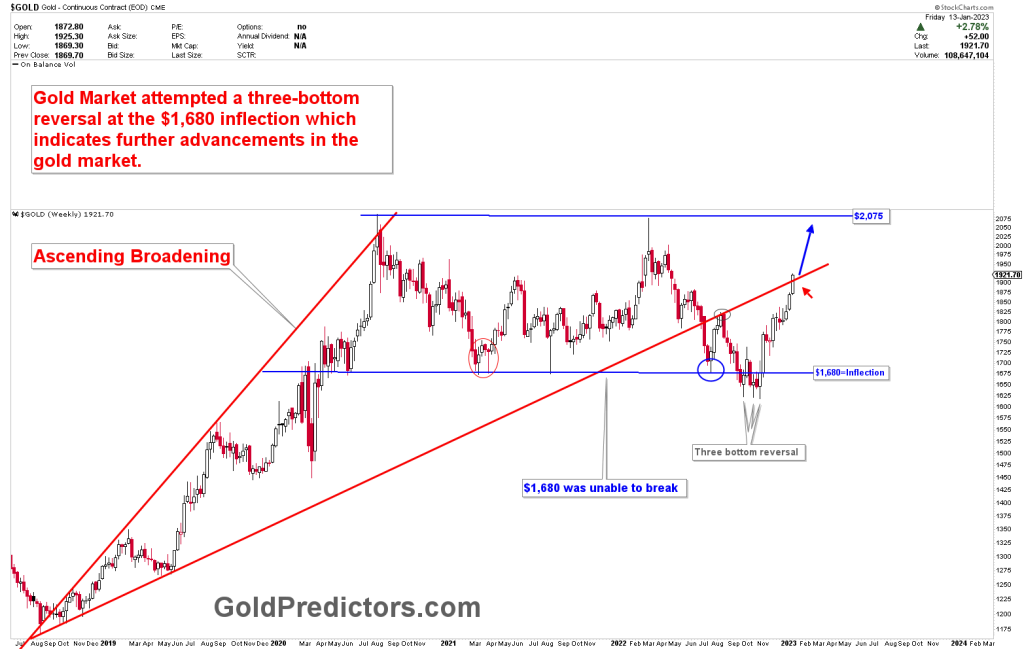
Gold has broken the Mega flag pattern from the ascending broadening wedge’s lower angle. This breakout was extremely bullish for gold, implying that prices will rise significantly. However, there are both sides to the move. Prices move in cycles, which we can extract from our chart mining and AI techniques. These cycles are short-term, intermediate-term, and long-term cycles. Our method of calculating cycles is exceptional, and the dates for each cycle’s appearance may differ. Gold cycles do not appear on fixed dates in today’s environment.
The reason for the March 2020 bottom is that the diverged cycle acted on March 10th, resulting in a strong bottom. Our chart mining team calculated the next short term cycles on March 31st and April 28th, which produced a strong bottom for the next move higher. We’ve put in enough trade to go long on these cycles and profited handsomely. In this article, we’ll look at the gold and silver targets’ timings and dates to examine the short term cycle to produce another gold buying opportunity.
To Read Free Stuff, Please Register as a Free Member.