


Gold: Bullish Short-Term Structure
For the first time in seven months, gold prices surpassed the $1,900 mark by confirming the bullish structure. The target for the gold market was between the levels of $1,875 and $1,920. Both levels have been exceeded, and the market is rallying based on the technical bottom. The technical bottom has been repeatedly illustrated over the past few weeks. The gold market rally was not unexpected, and there will be additional gains in the coming weeks. This article will examine the gold market in order to forecast the next price target in the short term.
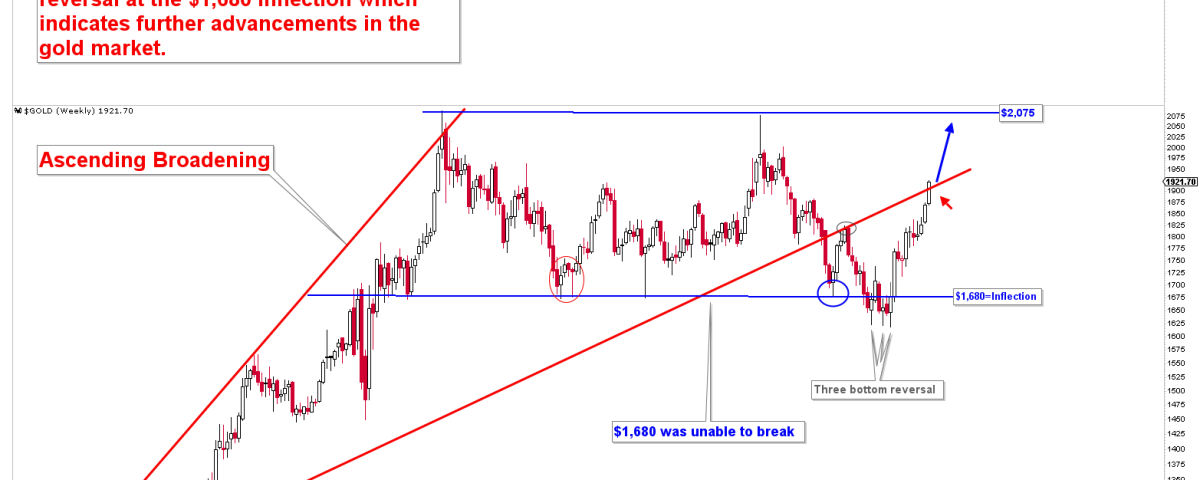
Bullish Short-Term Structure
Ascending broadening refers to a chart pattern in which the trading range of the gold market widens as the price moves higher. This pattern can indicate that investor enthusiasm for the market is increasing, as well as a potential for a trend reversal. In 2021, patterns in the gold market were identified with a target of $1,680. On the basis of cyclical analysis, the $1,680 level was confirmed as the inflection point in the gold market. The gold market reached $1,680 multiples of time and then reversed to reach $2,075. The range between $2,075 and $1,680 in the gold market confirmed this pattern as the dominant pattern. However, due to increased volatility, the pattern was broken, making the situation for gold investors more complicated. The price exceeded $1,680 but failed to close below this level on a monthly basis.
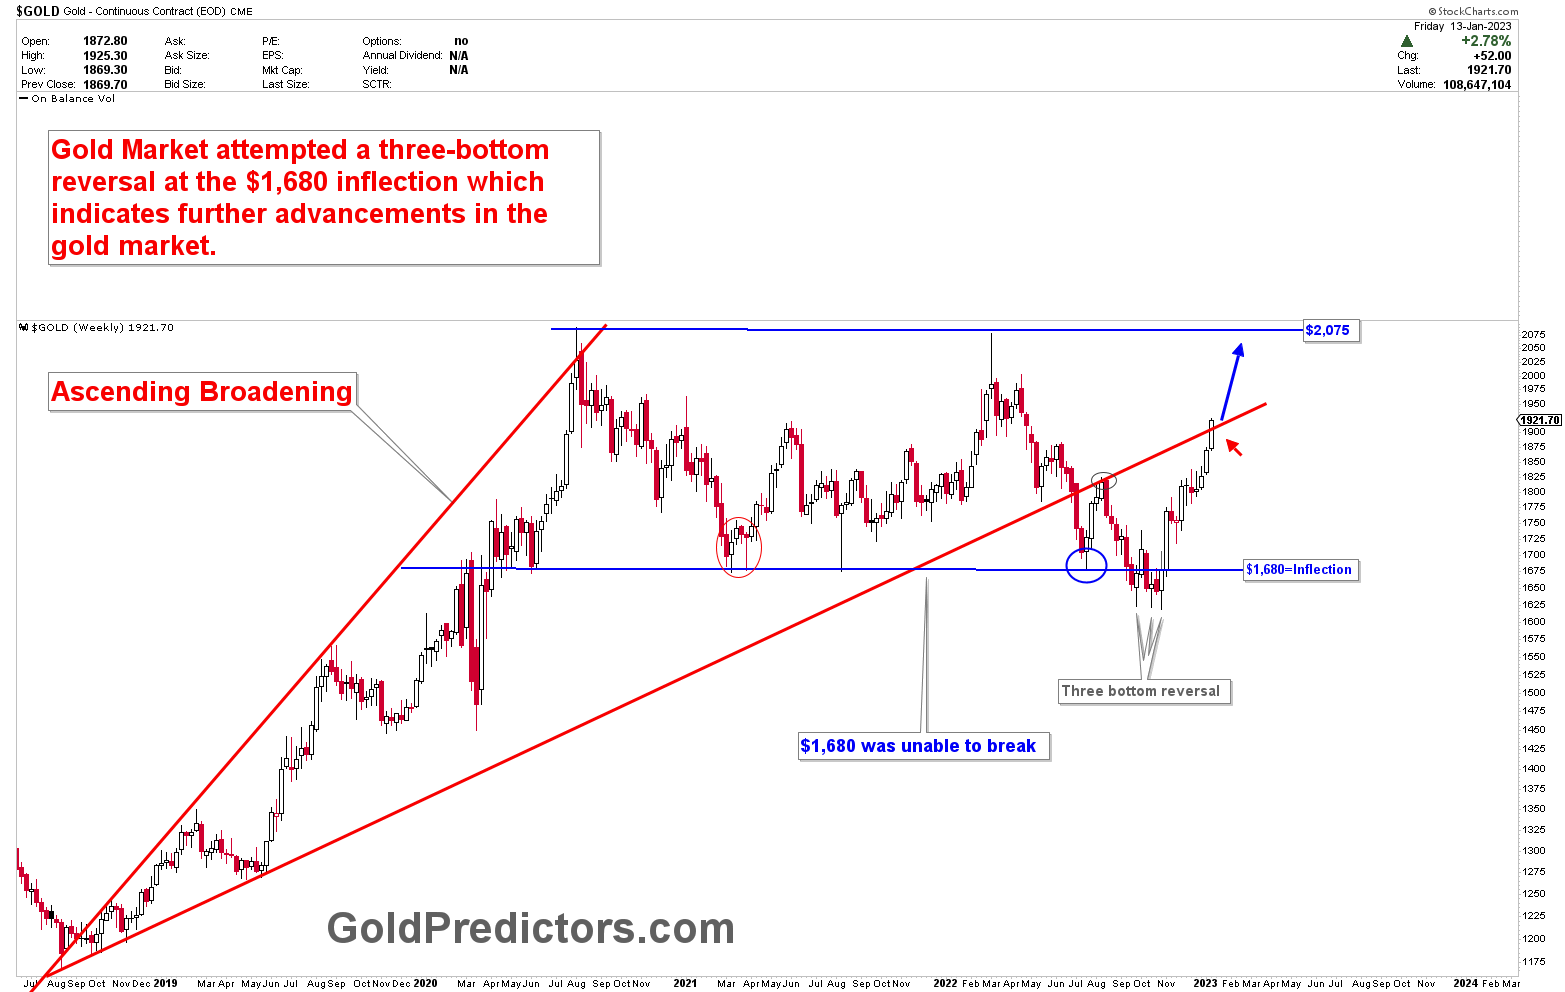
The breach of $1,680 reversed the price’s triple-bottom formation. In technical analysis, a triple bottom is a bullish chart pattern that occurs when gold reaches a low price three times in a particular trend, creating three distinct troughs. The triple bottom pattern is regarded as a sign of a strong reversal, indicating that future price increases are likely to be substantial. Before entering a long position, traders frequently await confirmation of the pattern, such as a break above a resistance level. Gold confirmed the triple bottom by breaking above the $1,800 level and is now advancing.
What is Next In Gold?
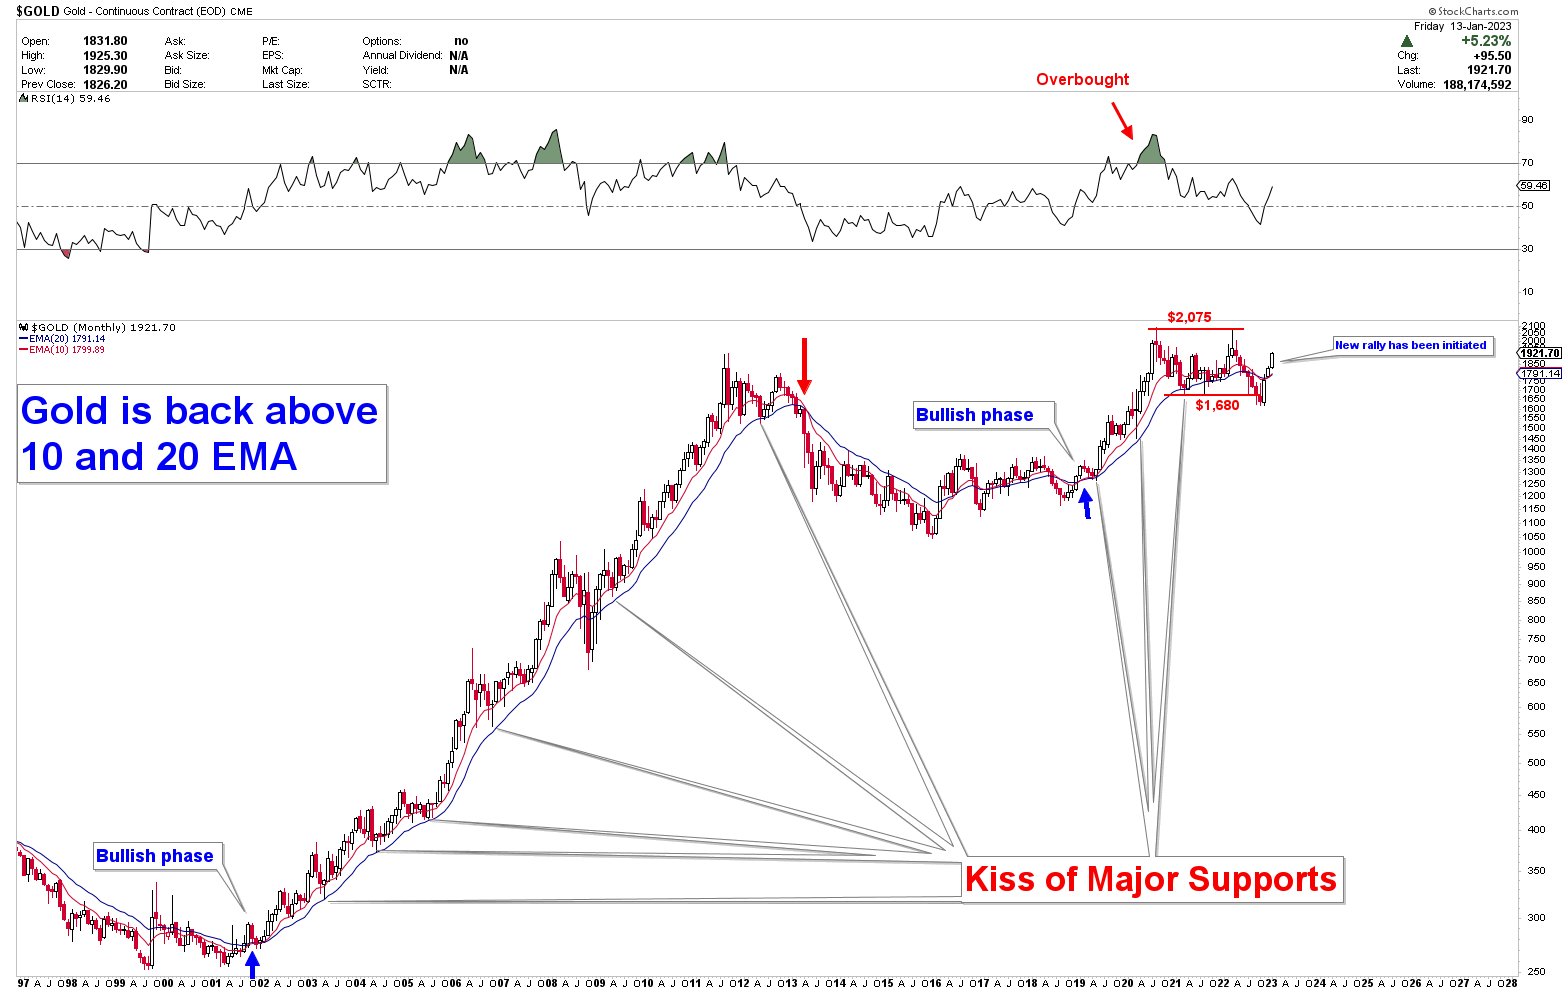
When the price re-enters the ascending broadening pattern after the breakout, it typically resumes its ascent with increased momentum. Therefore, gold prices are likely to rise substantially from here on out. If the price reaches $2,075, a decent pullback toward the line will be viewed as an excellent buying opportunity. If gold continues to advance higher from here, a pullback to $1,890 and $1,845 would be a strong consideration for medium- and long-term long positions. Alternatively, a breakout from $2,075 would be viewed as a strong buying opportunity.
The monthly gold chart below depicts a range between $1,680 and $2,075 with the gold market closing the month above the 10 and 20-day moving averages. This indicates that the gold market rally will resume following a breakout from $2,075.
How to Trade the Gold Rally?
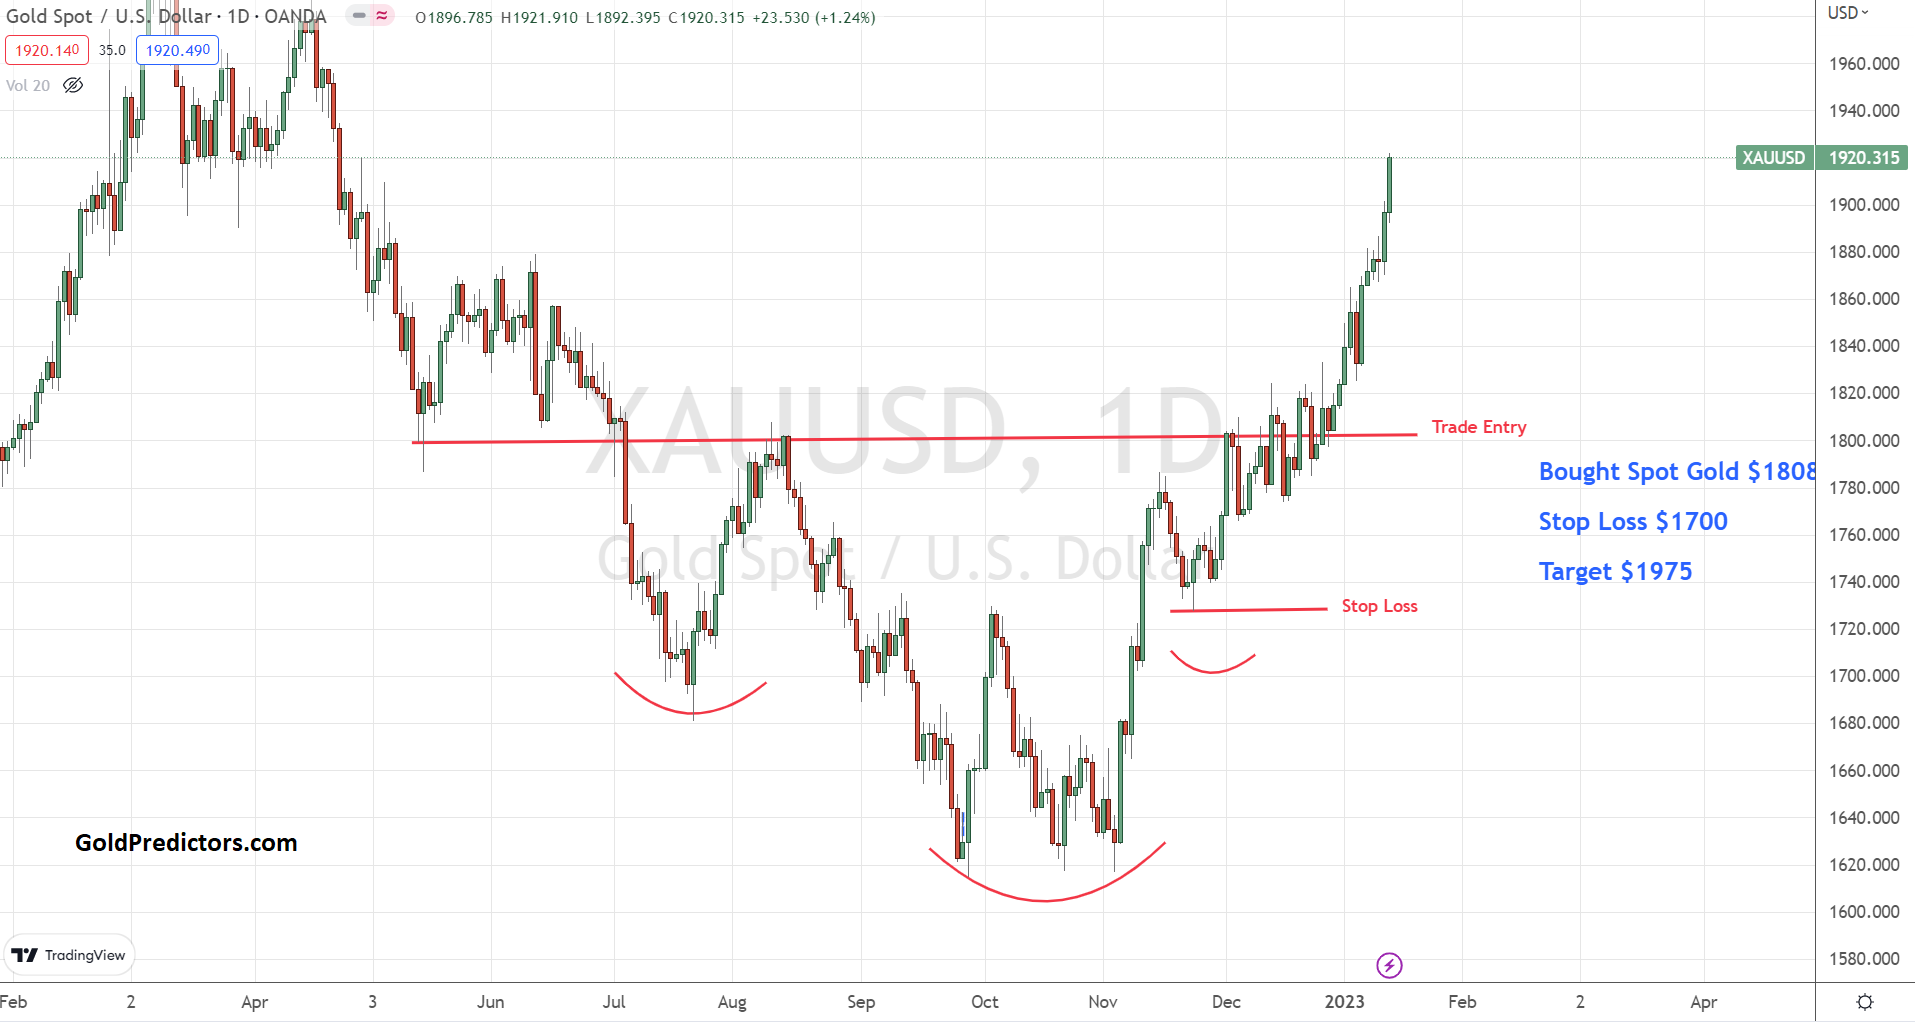
Currently, gold prices have already risen, so traders must anticipate a pullback. The best recent trade in the gold market was the entry just before the inverted head and shoulders pattern broke at $1,800. We entered the gold market at $1,808 using the spot gold chart, with a stop loss of $1,700 and an objective of $1,975. The stop loss will be raised to breakeven and we will send alerts to close the trade. Traders must currently wait for a pullback or another setup before entering the gold market.
To receive free and premium updates and trading signals, please subscribe to the link below.


