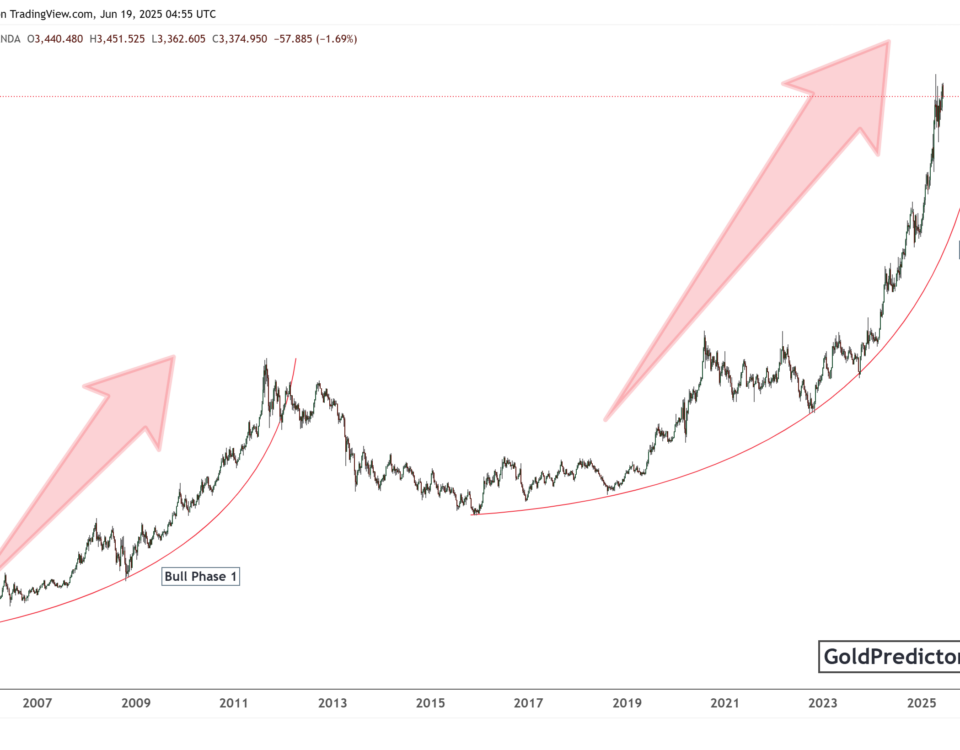
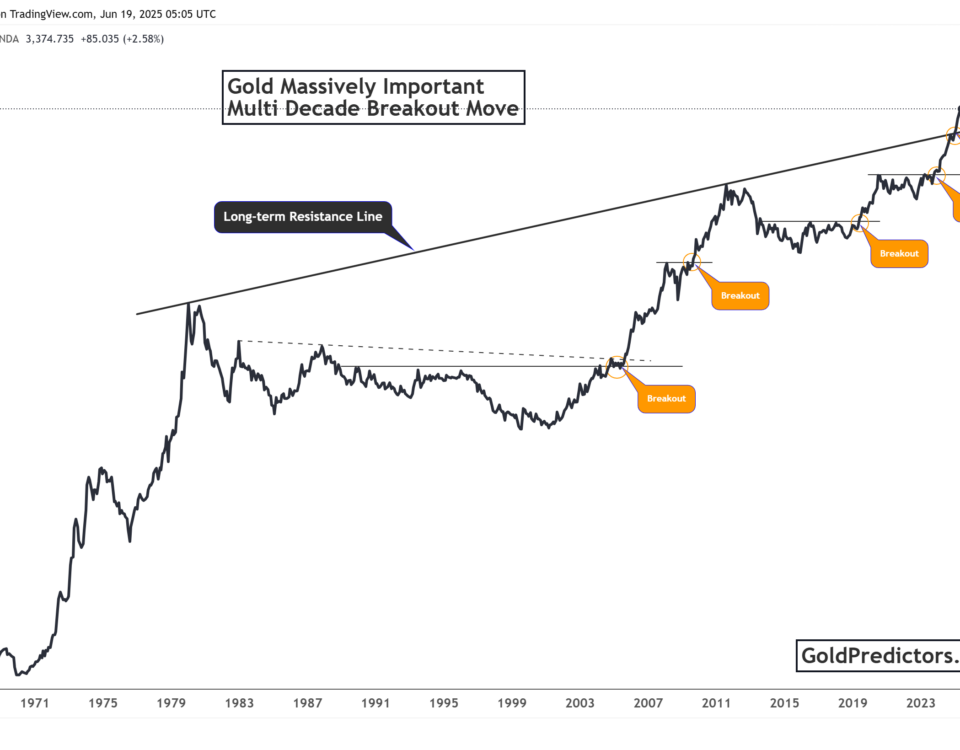
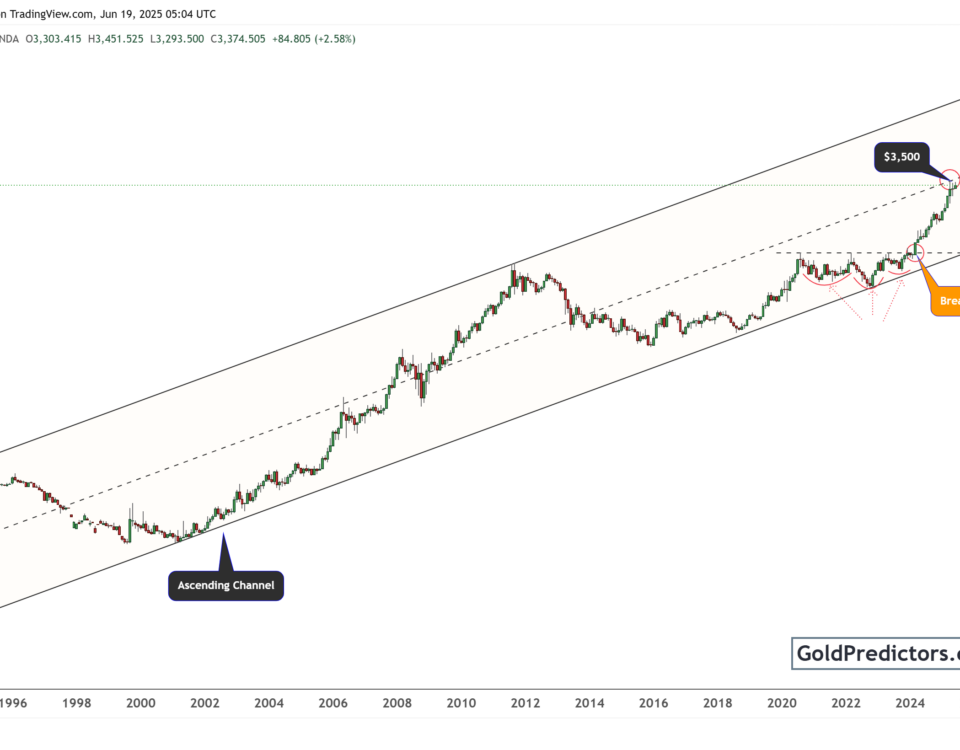
Exploring The Gold Next Path
Last week, gold retested the symmetrical triangle and fell below 1765. On the basis of some technical studies, we will assess gold next path today. Lets start it with Wedge patterns.
Development of Ascending Broadening in Markets
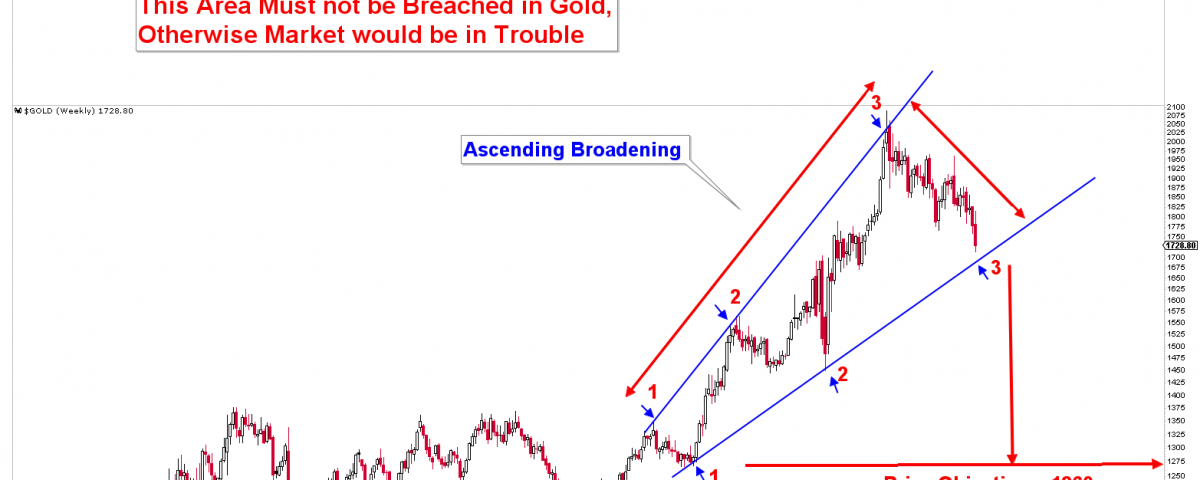
Ascending broadening patterns are reversal patterns which are emerged when any financial instrument is subjected to high volatility and prices are fluctuating between extremes.. If the oscillation between the upper and lower lines is good, the patterns are valid. Support is at the lower line, while resistance is at the upper line. Before the patterns are valid, each of these lines must have hit at least twice. Only if the price hit the line three times is it considered valid trend line. The support line must be touched three times, while the resistance line must be touched twice, or vice versa. These are bearish patterns, with prices breaking down in 80% of the time. However, 20% of the time, prices break to the upside. We’ll use examples to explain both conditions.
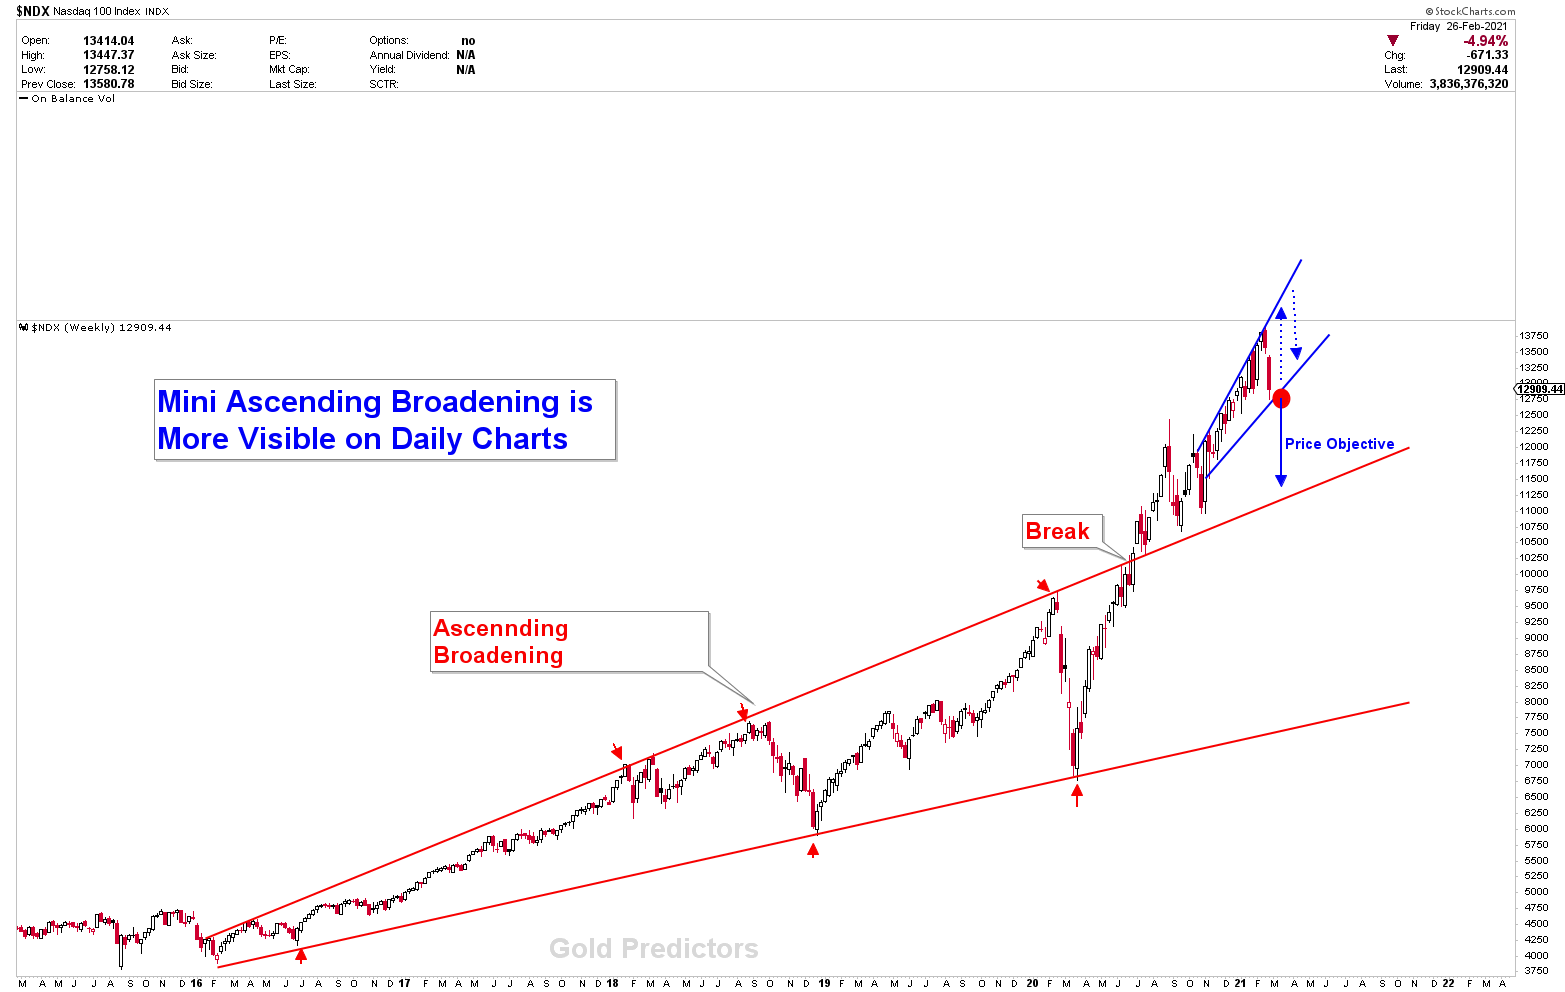
Due to extreme volatility, during COVID-19 crisis, prices in many instruments shoot to extremes. Nasdaq is one example, where prices formed ascending broadening patterns and then broke upside. A blue ascending broadening pattern emerged after a break, which is more visible on daily timeframes. While this ascending broadening pattern may vibrate, a break of this blue wedge would target the NASDAQ 100 index at 11,500 soon.
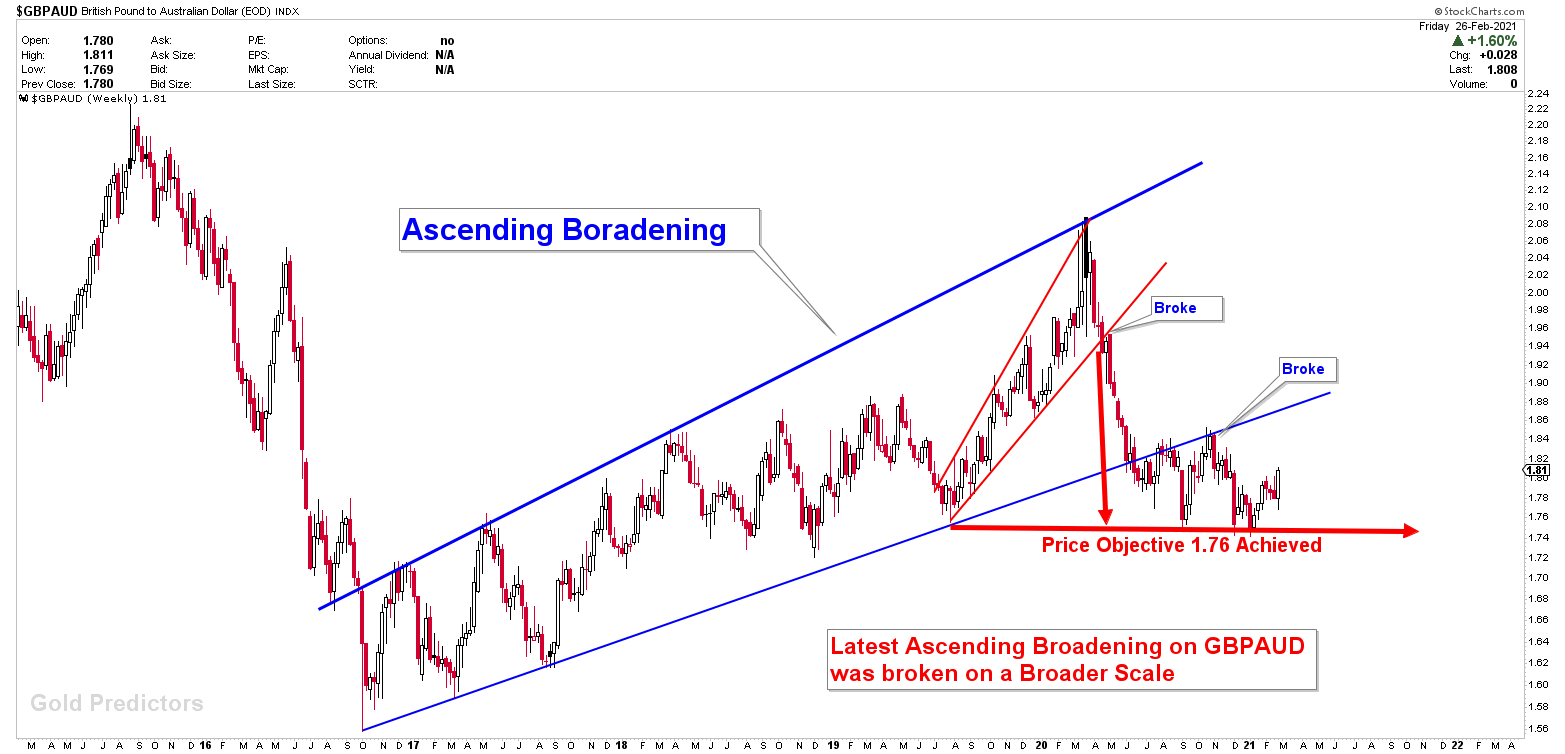
GBPAUD is another example which recently produced Ascending Broadening Price Patterns and achieved their price targets. GBPAUD produced an ascending broadening pattern in March 2020, confirming a break with a price target of 1.76. The objective of the price was fulfilled.
Interpretation On Gold Market
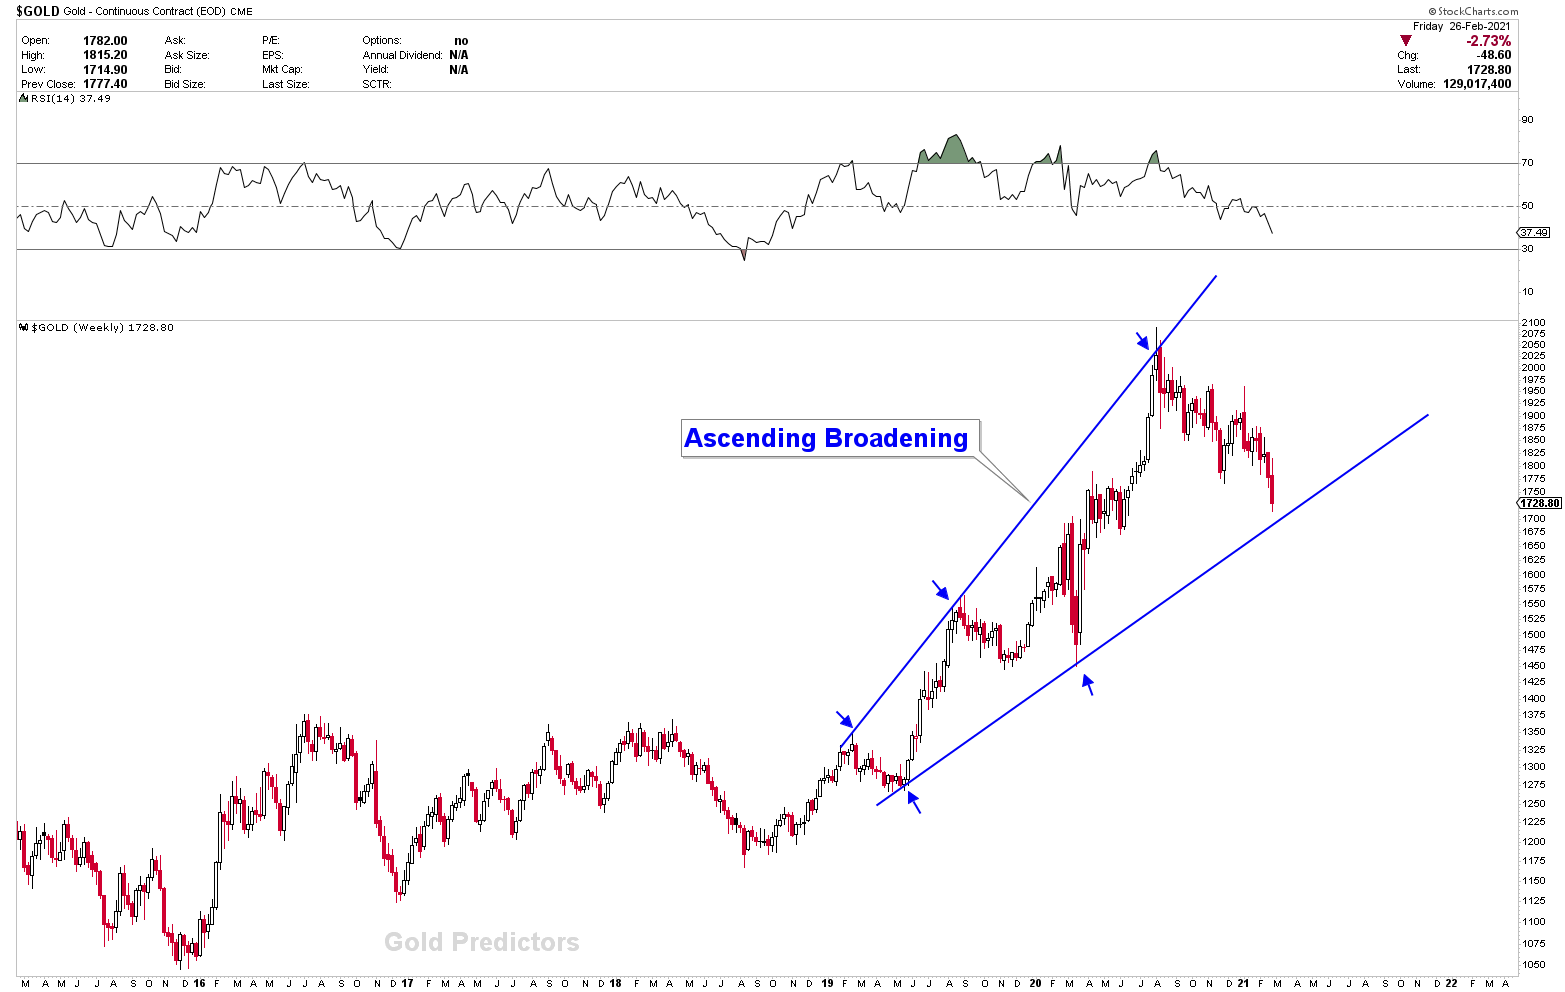
In December 2020, we discovered a similar pattern of ascending broadening in the gold market. Gold has been unable to break to the upside for months. It marked a head at 2070, and the lower line of gold ascending broadening patterns is pulling the prices to attract buyers at the third touch of this support line, as the inflection of 1931 was not broken by a weekly and monthly close.
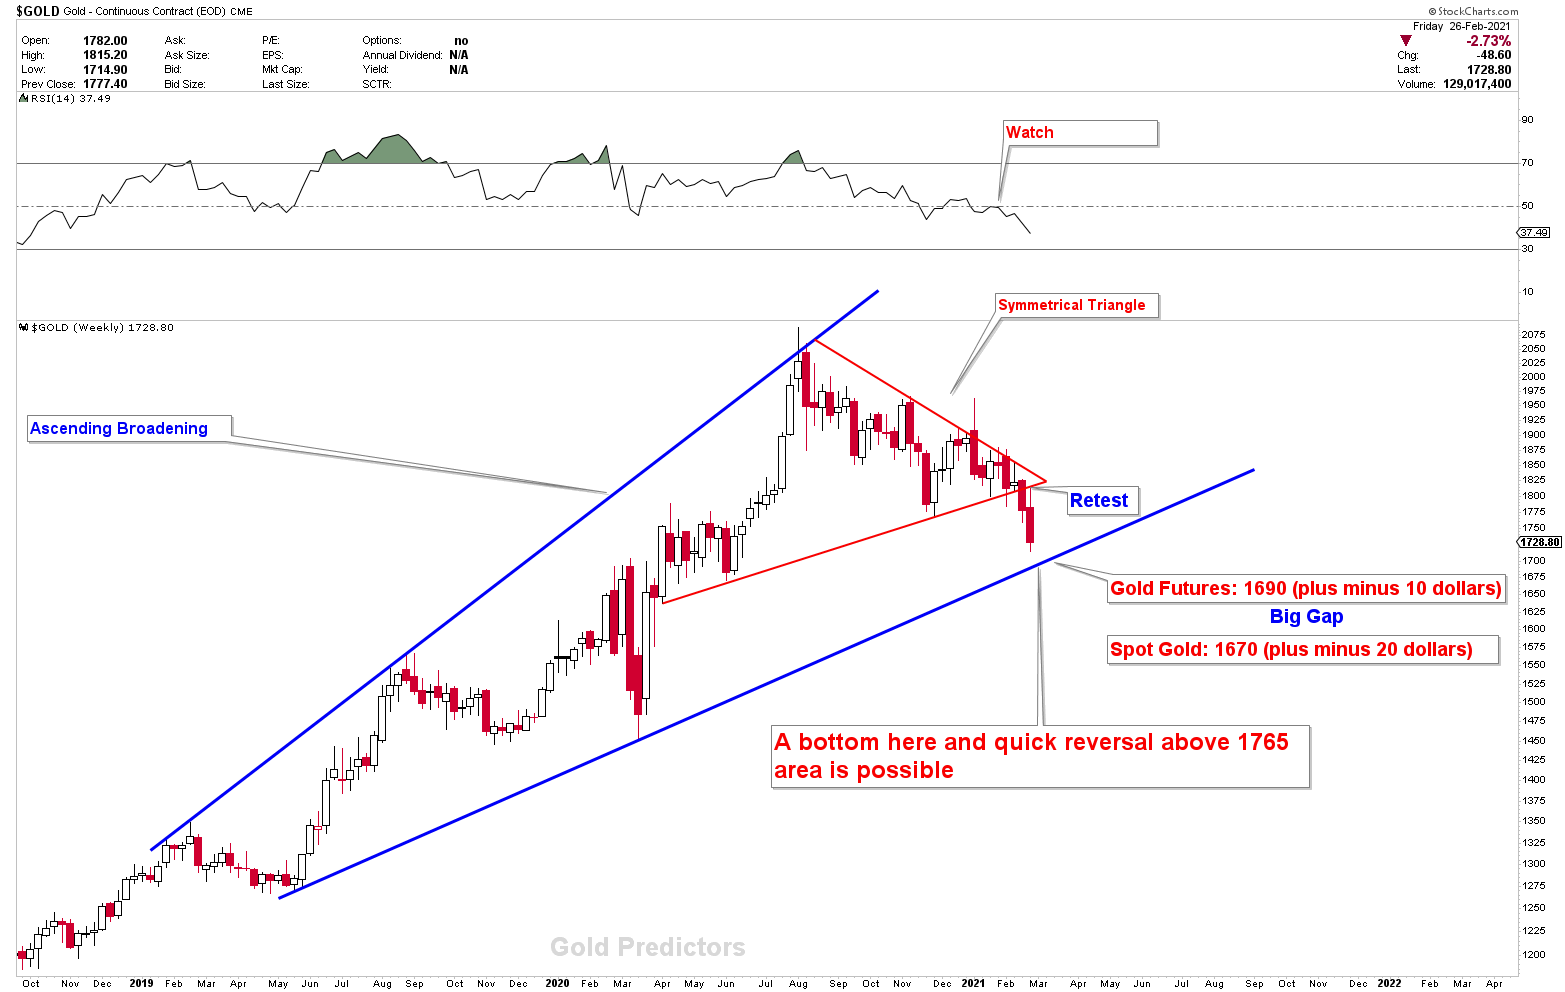
Another chart shows, the symmetrical triangle was broken on the edge. The retest of the symmetrical triangle became a selling opportunity because the gold dead pulse was not activated, and expectations were not achieved. Prices are now approaching a point where all pivots converge. In the Gold futures chart, this broadening line bottom is 1690 (plus or minus 10 dollars), but in the Spot gold chart, it is 1670 (plus or minus 20 dollars). It’s very likely that we’ll see a bottom in this area and a sharp reversal above 1765 soon. Even if gold prices are collapsing, there must bounce back at least 200 dollars from the formed bottom. The first bounce would be immediate to 1765 from 1725 once market opens.
Can Gold COLLAPSE?
The patterns are now completing the Ascending broadening formations, as shown in the chart below. The contents are restricted to premium members, please login to continue…
This content is locked
Login To Unlock The Content!To receive the free trading alerts, signals and articles please subscribe as a Free member to the link below.


