


A Shift in Japanese Yen
For a long time, Japanese Yen has been strong. The strength of the Japanese yen has caused volatility in the GBPJPY and USDJPY instrument pairs. We’ve recently noticed that all Japanese Yen pairs have reached an inflection point where if they break higher, hundreds of pips are on the table. Today’s discussion will be on Japanese Yen pairs, as well as EURUSD and GBPUSD. We will not go much deep in today’s report.
Highlights
- Last week, we predicted that the New Zealand dollar and the Swiss franc would remain the weakest currencies on the board, while the British pound and the US dollar would be the strongest. The weakest currencies were the NZD, JPY and CHF, while the strongest were the GBP and USD. However, we are long-term bearish on the dollar, the bounce from long-term supports must be an excellent selling opportunity in US dollars.
- GBPNZD and GBPCHF were presented as the pairs to go Long. Throughout the week, both pairs remain dominant. However these pairs are long term on Long side. We don’t like buying GBPJPY and USDJPY because of USDJPY’s long-term resistance, which could bring some strength in JPY resulting a sharp pullback in these instruments. However GBPJPY has already over extended from its resistances.
Weakest currency: CHF, NZD, JPY(shift anytime)
Strongest Currency: GBP
Best Instruments to Focus:
LONG GBPCHF
LONG GBPNZD
LONG EURUSD
SHORT USDJPY
usdpy must show some signs of reversal.
Japanese Yen At Inflection
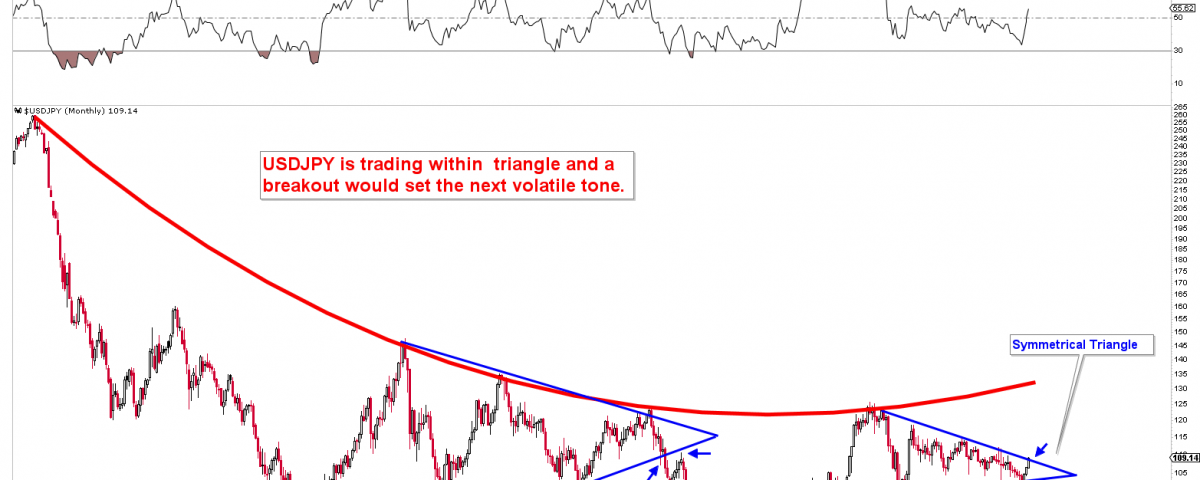
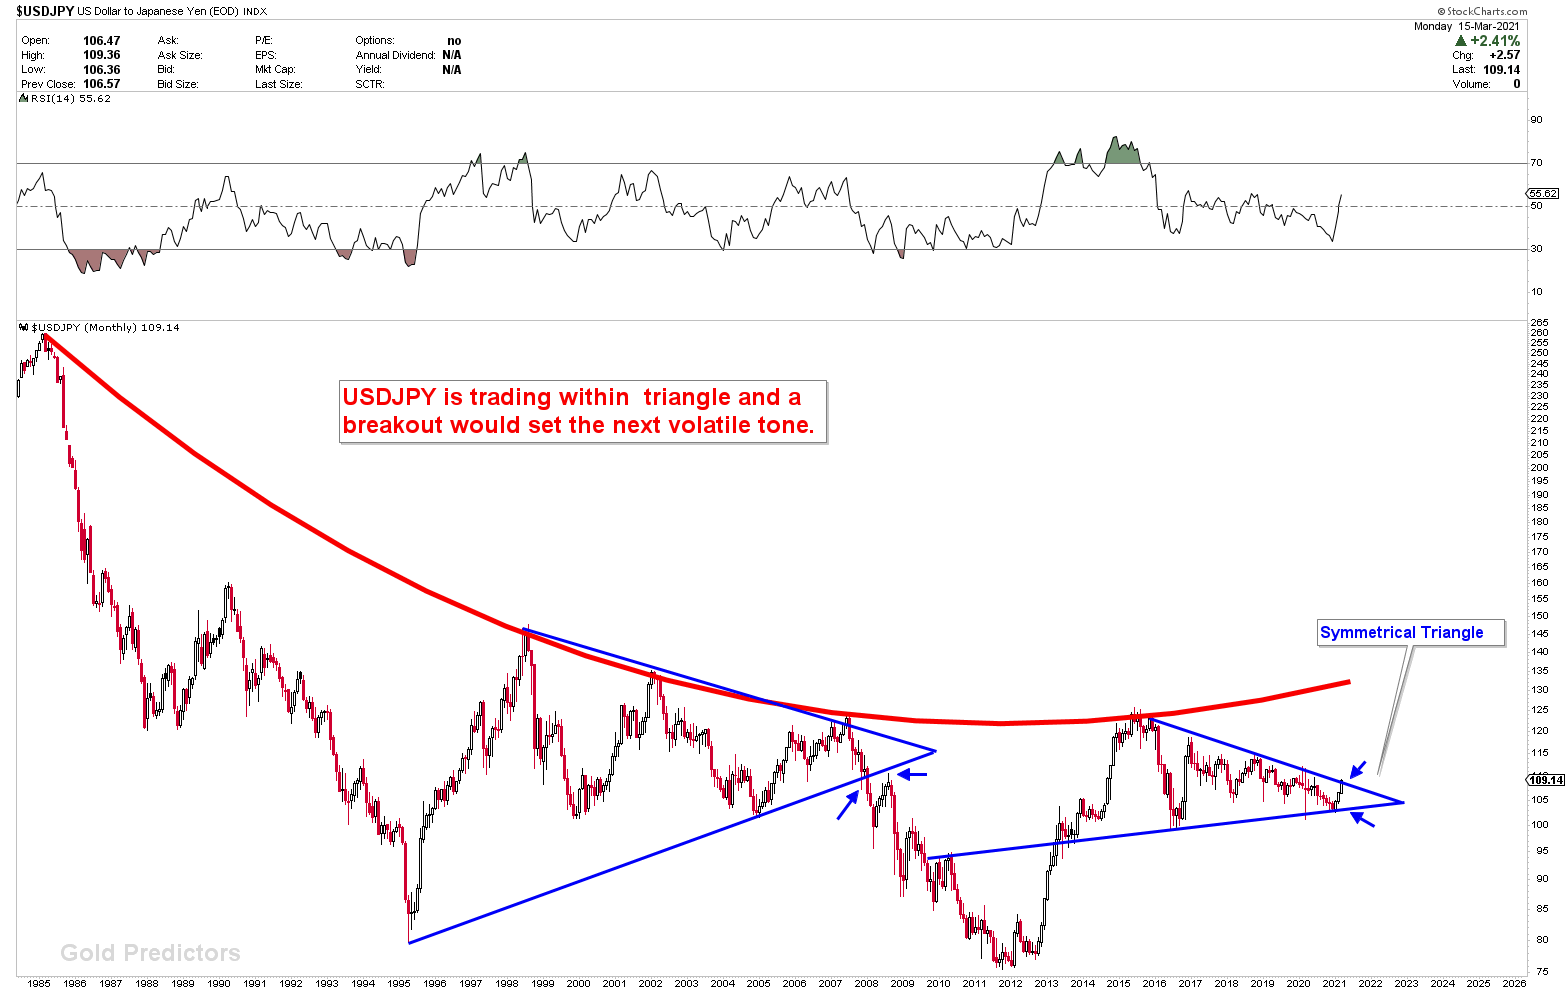
Let’s start with the monthly chart of the USDJPY, where the significance of the symmetrical triangle is clear. The triangle was broken to the downside last time in 2008, and the instrument lost around 1000 pips. Prices are currently trading just above the Blue symmetrical triangle, and the March 2021 monthly close is crucial. We’ve talked about the importance of MONTH MARCH 2021 several times in the premium section. And specially the 10th March as the Major Gold Bull Cycle Day.
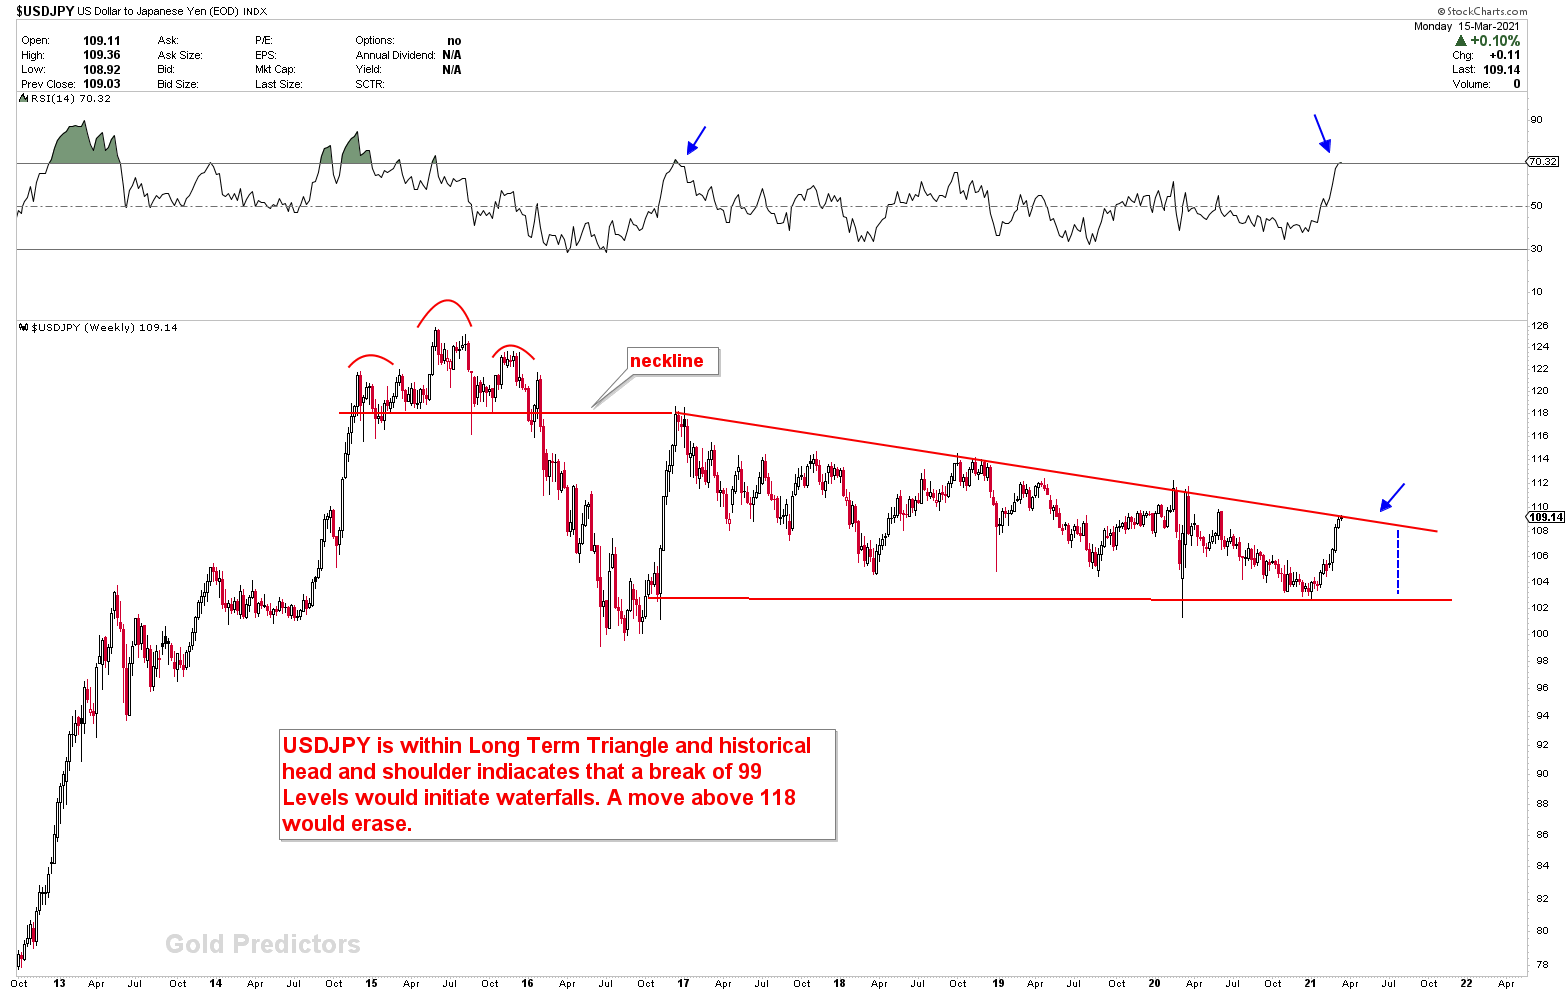
Let’s take a look at the USDJPY chart on a weekly basis. The graph below depicts how the price is latching to the triangle line. We presented this chart when USDJPY was trading around 104. Price appears to be correcting from here, or if it breaks higher, a retest of this line would be a great buying opportunity. Currently we leave a caution due to the pair strength. Wait for some confirmations to execute short trades.
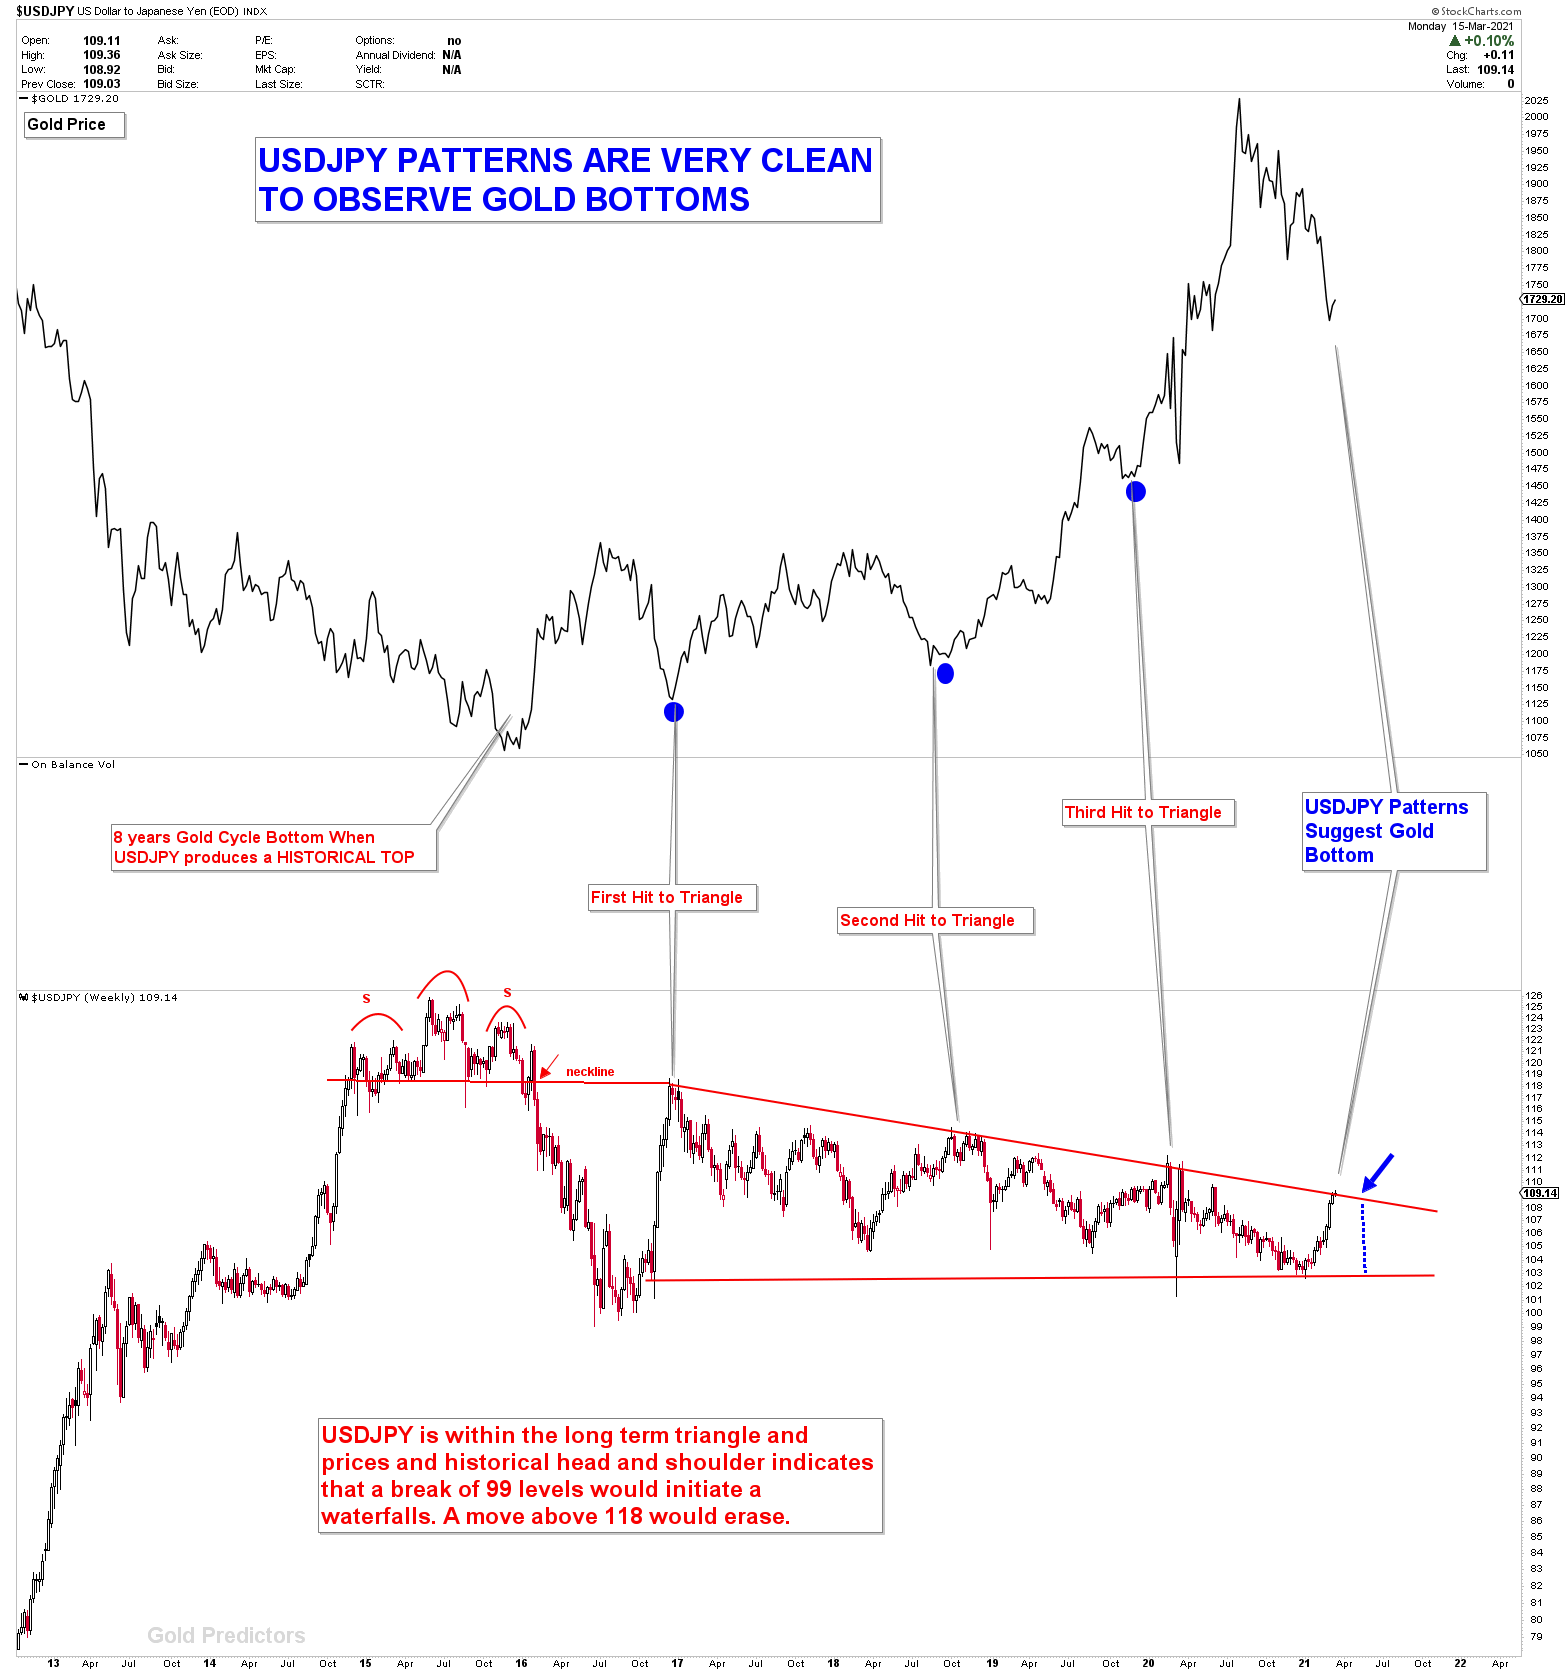
This chart was used to measure out the gold price. The chart below depicts the relationship between gold prices and the USDJPY. Gold bottoms whenever the USDJPY hit the triangle. USDJPY has hit the triangle last week, and gold has reversed from 1680 to 1740. “We keep a close eye on gold prices in the premium sections.”
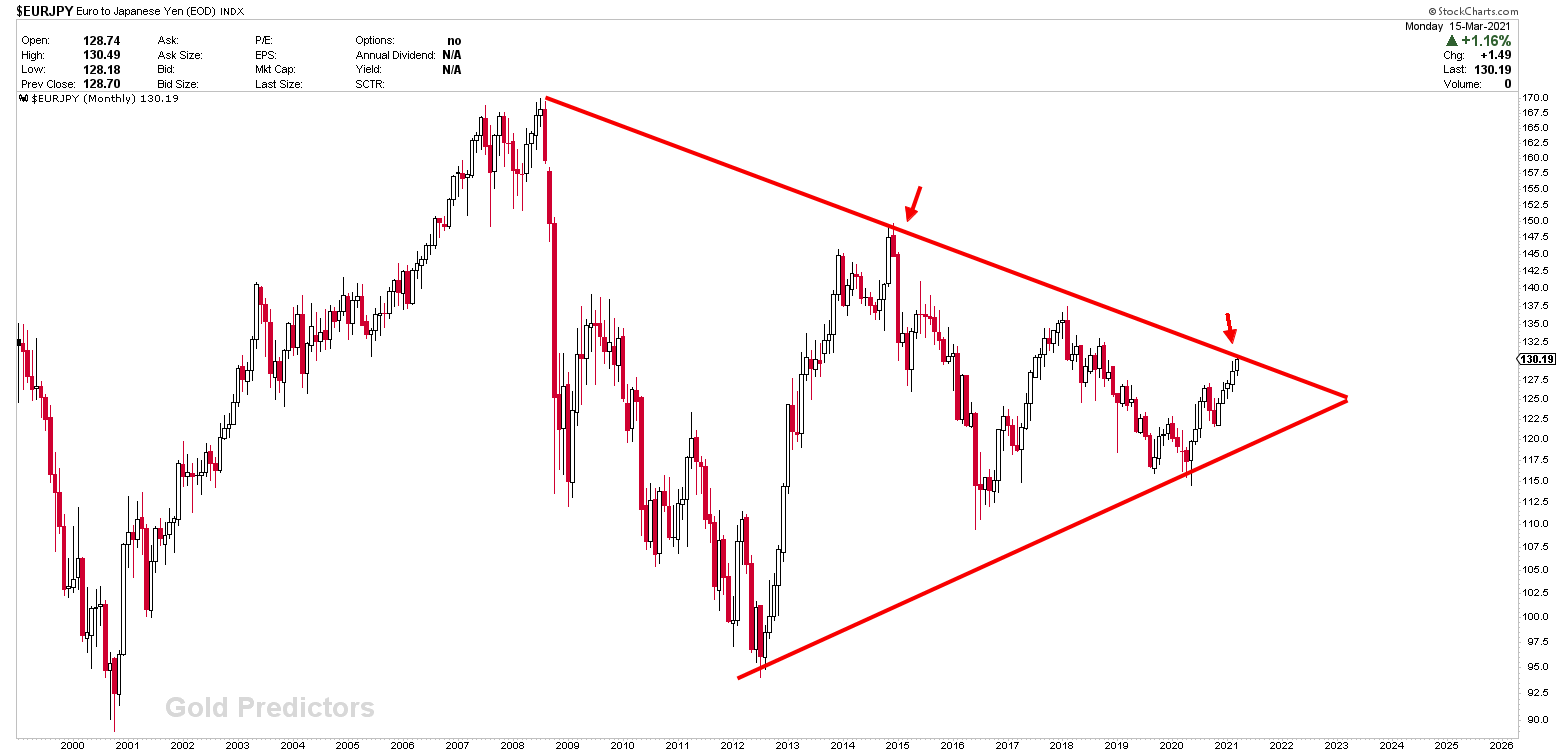
Another JPY chart, EURJPY, shows that the instrument is encountering strong resistance at the inflection points.
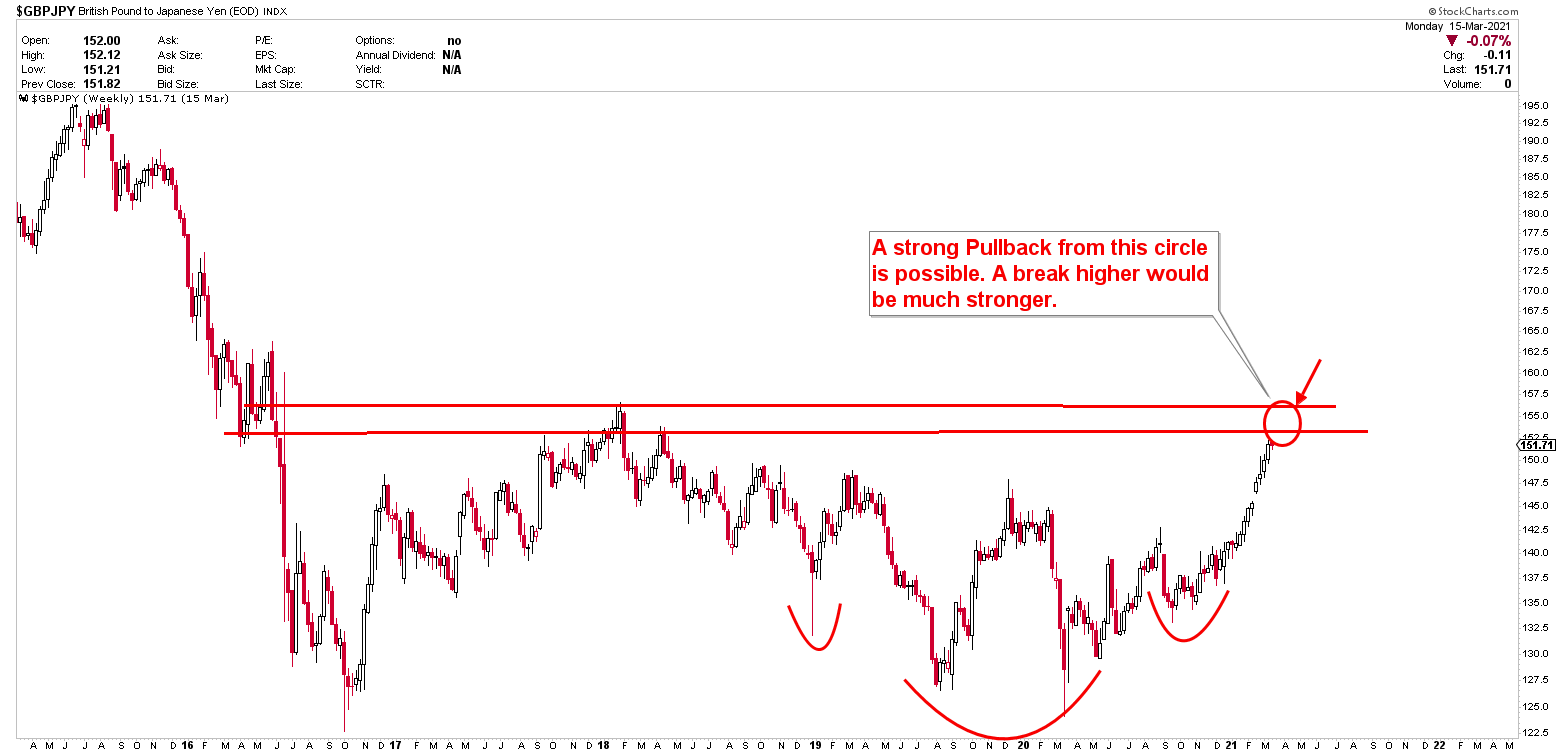
As we previously stated in our articles, GBP has been extremely strong. The strength of the pound has pushed the GBPJPY above the resistance line. However, we expect a large correction, and given the strength of the pound, a large correction in the GBPJPY could result in a buying opportunity. The resistance point is represented by the circle. We would avoid trading in this instrument until dust is clear from the mentioned red circle. At the moment of writing it is very strong.
All JPY instruments (including those mentioned above) are currently trading in a significant area. It’s possible that we’ll see a sharp pullback in USDJPY and EURJPY and GBPJPY from these levels, but it’ll have to show signs of reversal.
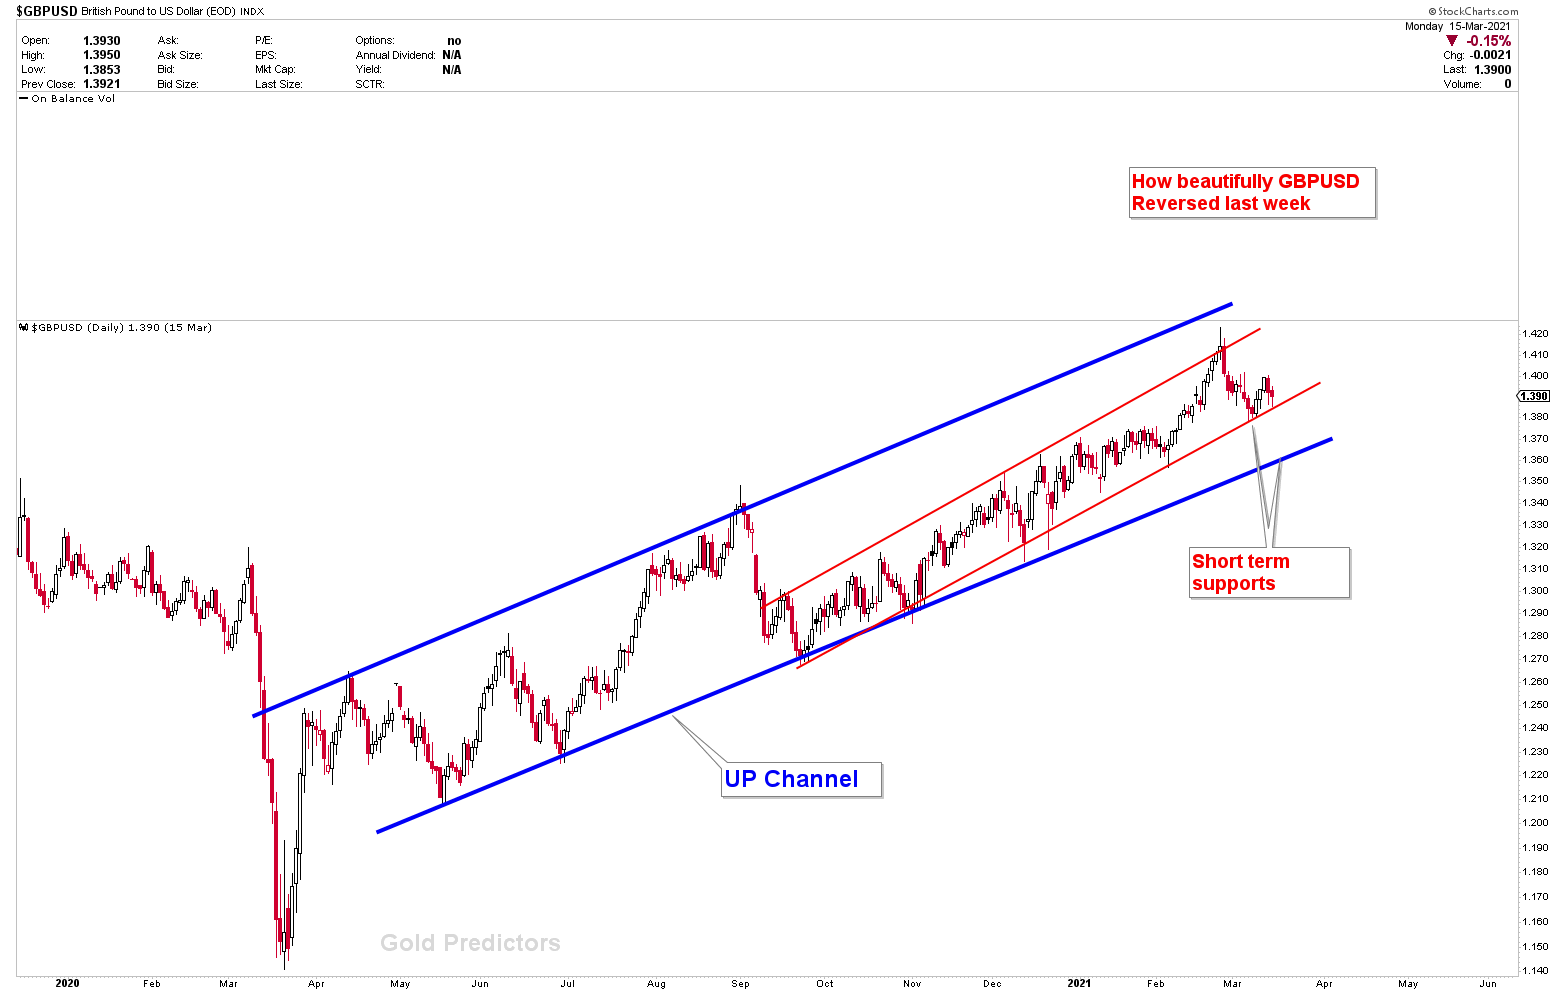
Let’s take a look at the chart for GBPUSD. It’s been a week, and the price has remained in the red channel. A break in the Red channel would lead to a support in the Blue channel. If the US dollar encounters resistance, the GBPUSD pair will provide support for higher prices.
EURUSD Strong Opportunity
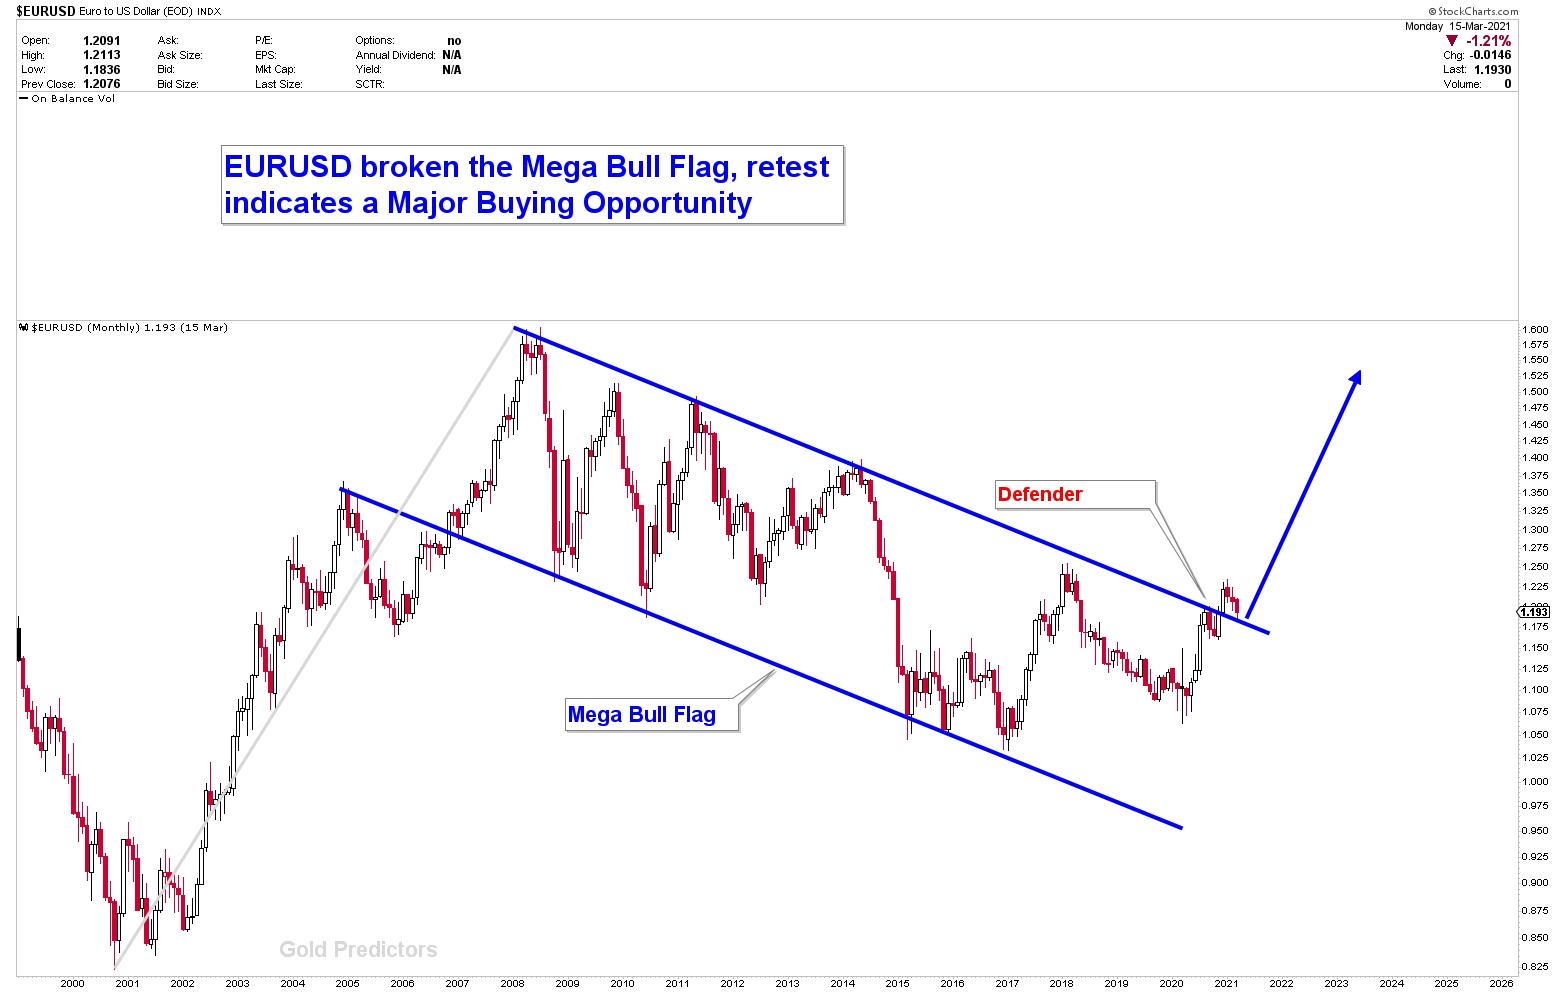
Let’s start with an old chart that we’ve been showing you for quite some time. The EURUSD has broken through the long-term trend line, and we are still bullish on the pair. The instrument is currently testing the breakout, which is regarded as a good time to buy. Inverted head and shoulder patterns appeared before a monthly breakout, and these patterns are strongly bullish. These patterns suggest that this instrument will skyrocket in the long run, flushing out the US Dollar (another reason for gold and silver exhaustion in coming months).
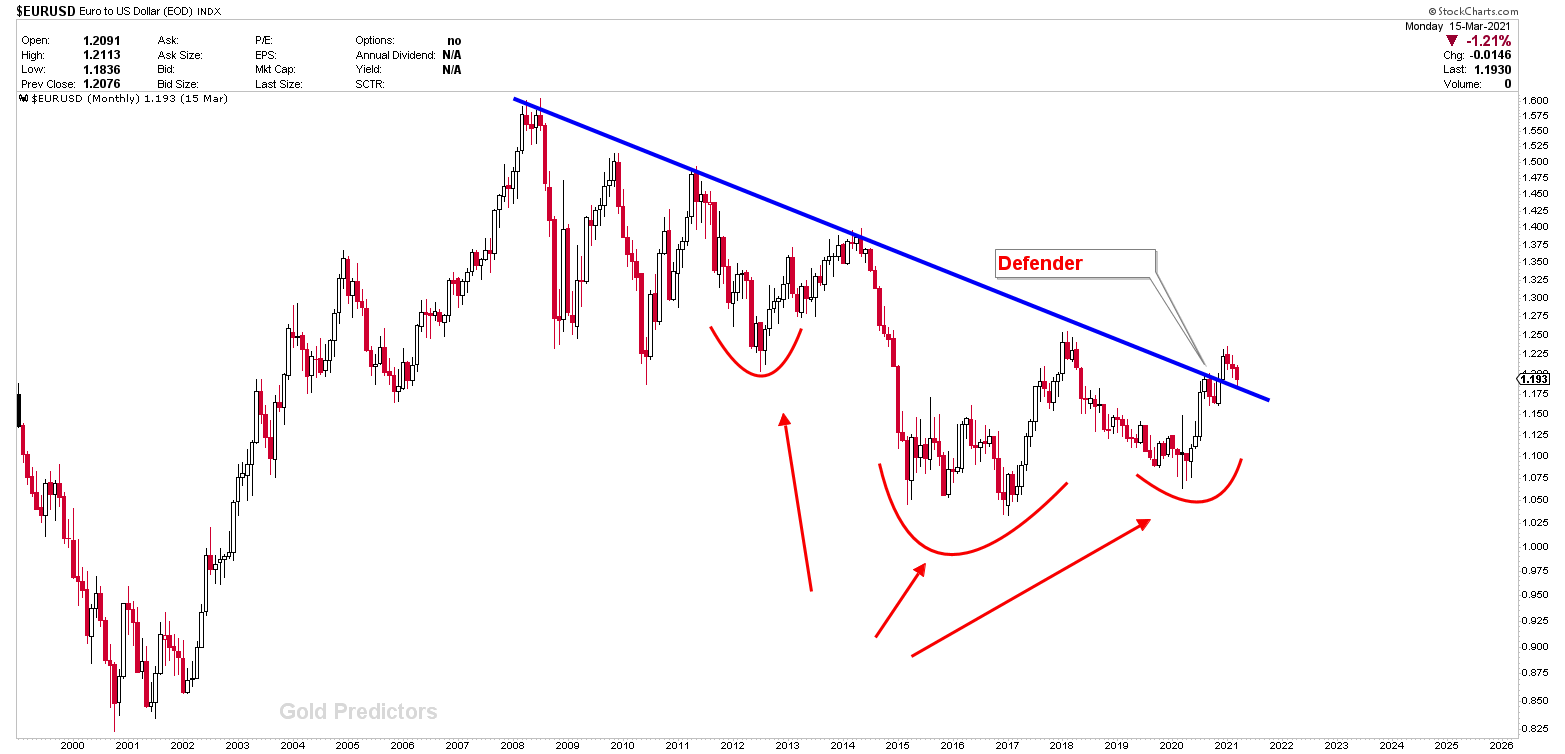
Let’s take a look at another EURUSD monthly chart to confirm this signal. It confirms a MAJOR BULL FLAG in EURUSD. The bull flag has been confirmed as a breakout, implying that prices will skyrocket. The Defender line is a buying opportunity.
We zoomed out the chart to better understand this opportunity and saw a Bullish Weekly Key Reversal at the Defender Line, indicating higher prices.
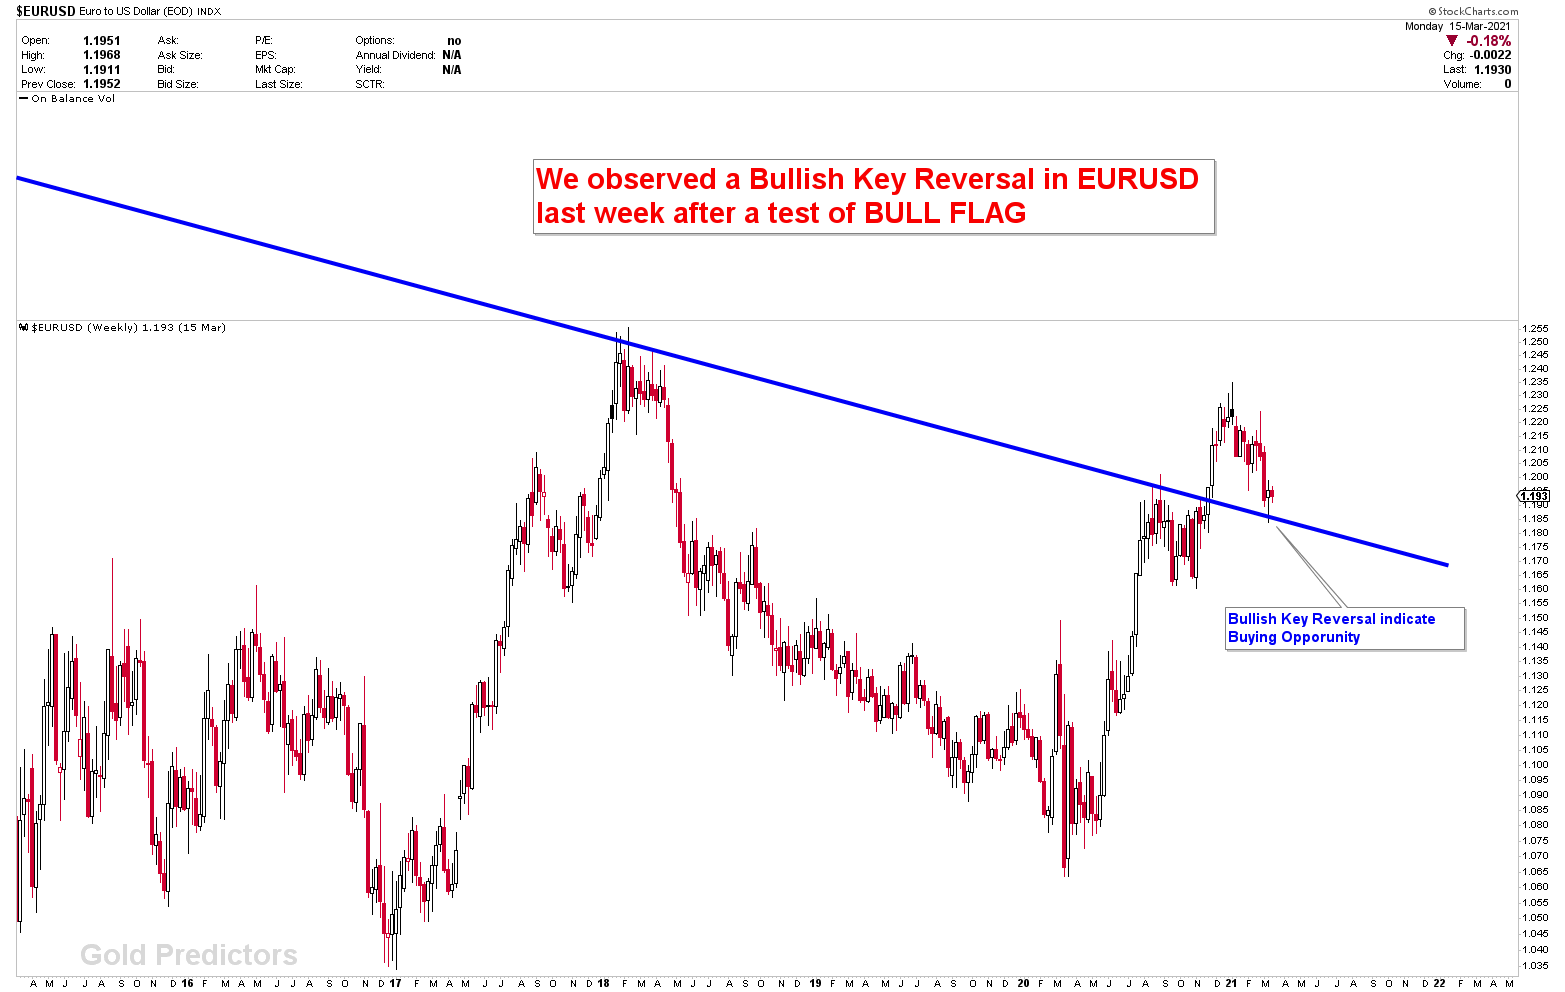
Last week, the EURUSD retested the breakout area before reversing with a Bullish Key Reversal. The problem is only the dollar strength. At this time, we don’t see the dollar’s strength waning. The dollar must come back to trade lower in order for the EURUSD to confirm a bottom at the breakout area. Alternatively, if the EURUSD breaks higher, it will exert pressure on the US dollar, which will benefit gold prices. On other hands, all JPY pairs are trading at inflection points where a breakout can develop some big shift in markets. But we expect a quick reversal anytime in USDJPY and EURJPY.
To receive the free trading alerts, signals and articles please subscribe as a Free member to the link below.
Note: The subject highlights the ideas and thoughts of the writer for educational support that can be used to enable the reader to become an independent thinker and decision maker.


