Gold Price Forecast: Correction Follows Historic Breakout While Gold Outperforms Lithium
Gold prices are correcting after reaching new record highs, but the broader outlook remains positive. The historic breakout from a multi-decade triangle remains intact, keeping the long-term technical structure constructive. At the same time, gold continues to outperform lithium as the Lithium versus Gold ratio approaches a major technical support level. These developments highlight the key technical levels that could shape the next phase for both gold and lithium.
Gold Technical Analysis: XAUUSD Holds Above Historic Triangle Breakout
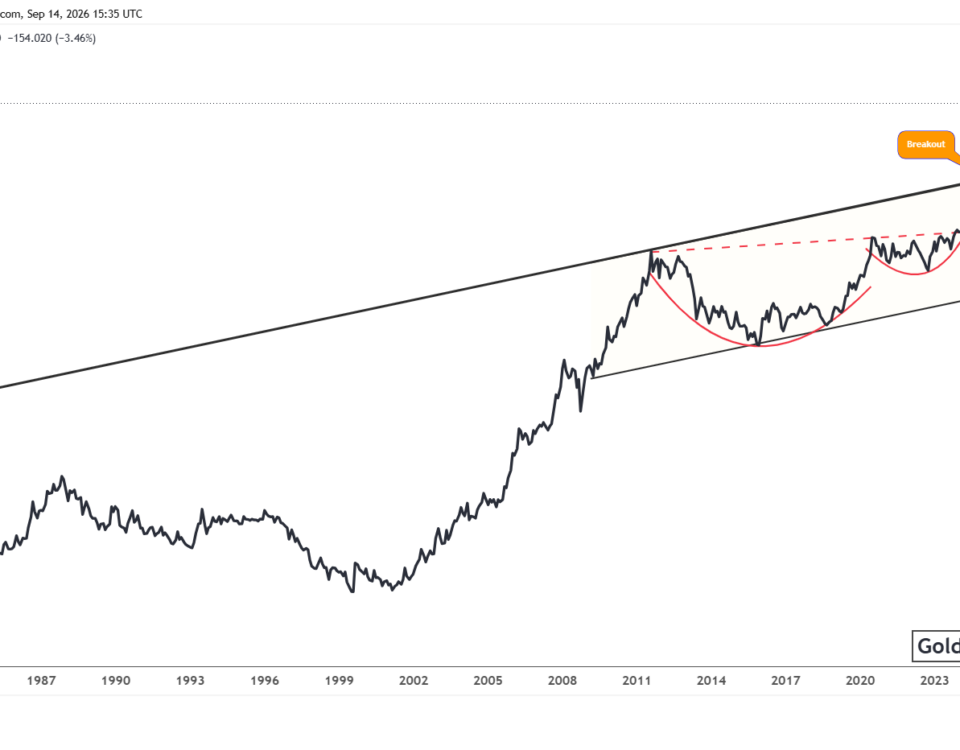
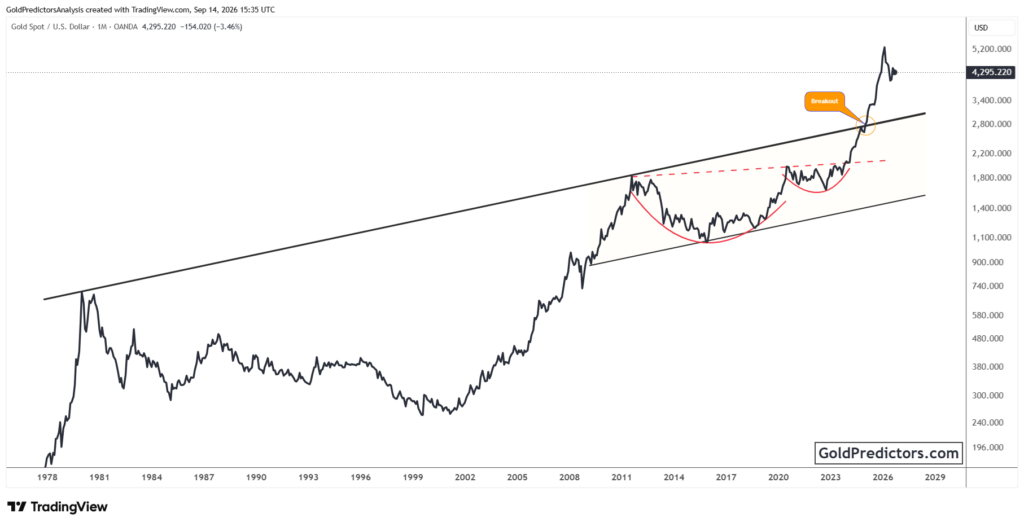
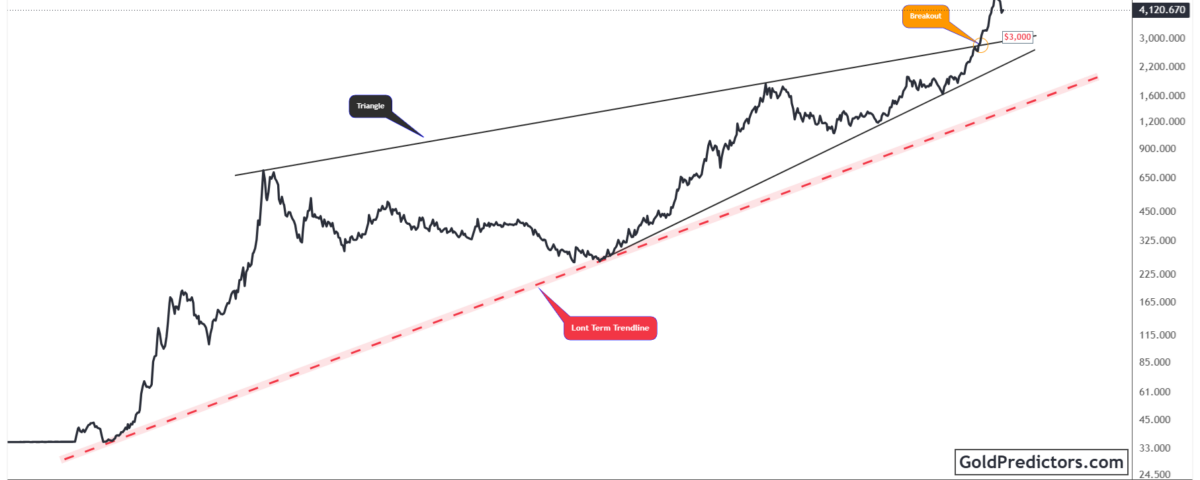
The gold chart below shows a large triangle that developed over several decades. Price remained capped beneath the upper boundary of the pattern for many years, while a long-term rising trendline continued to provide support during major corrections. This structure reflected an extended period of compression before gold eventually broke above the triangle. The breakout confirmed a major shift in the long-term trend.
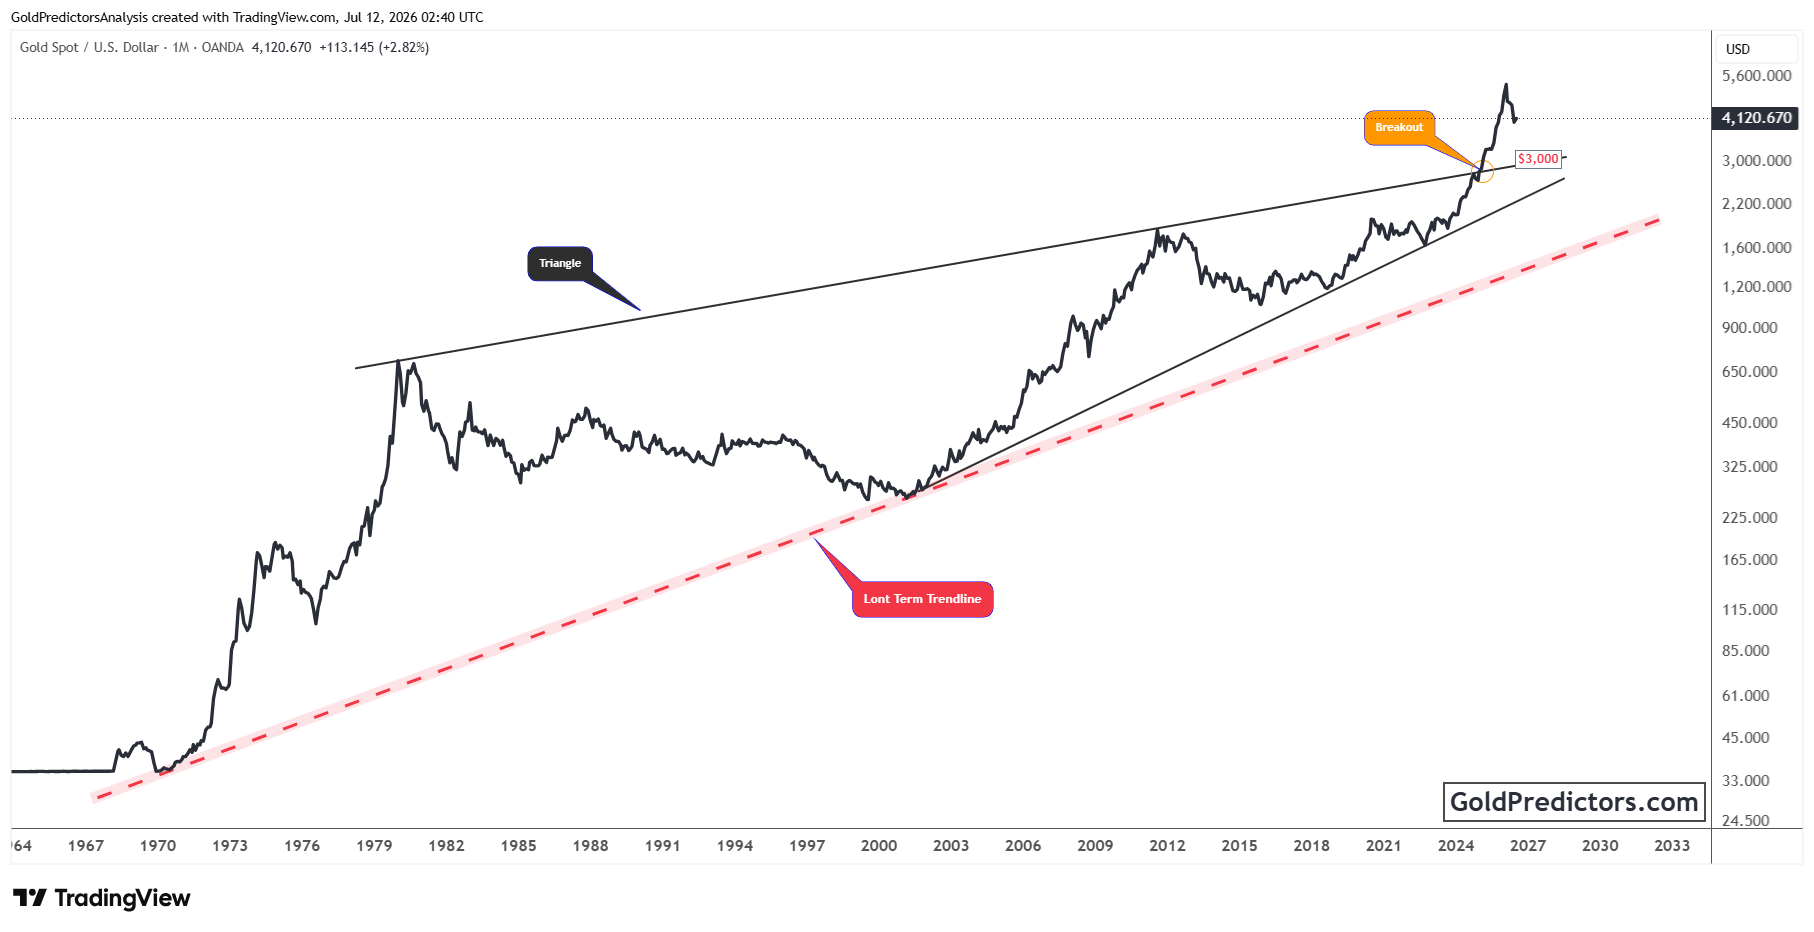
After the breakout, bullish momentum strengthened and gold advanced to successive record highs. Price remained well above the upper boundary of the triangle, confirming that the breakout remained intact. This price action reflected sustained bullish momentum and highlighted the strength of the broader uptrend.
The latest price action shows gold correcting after reaching fresh record highs. Despite the recent decline, price continues to trade above the former breakout zone, which remains an important long-term support level. The current pullback reflects a cooling phase after a strong advance rather than a change in the broader trend. The next direction will depend on whether gold continues to hold above the breakout area as consolidation develops.
Gold Outperforms Lithium as Long-Term Ratio Tests Critical Support
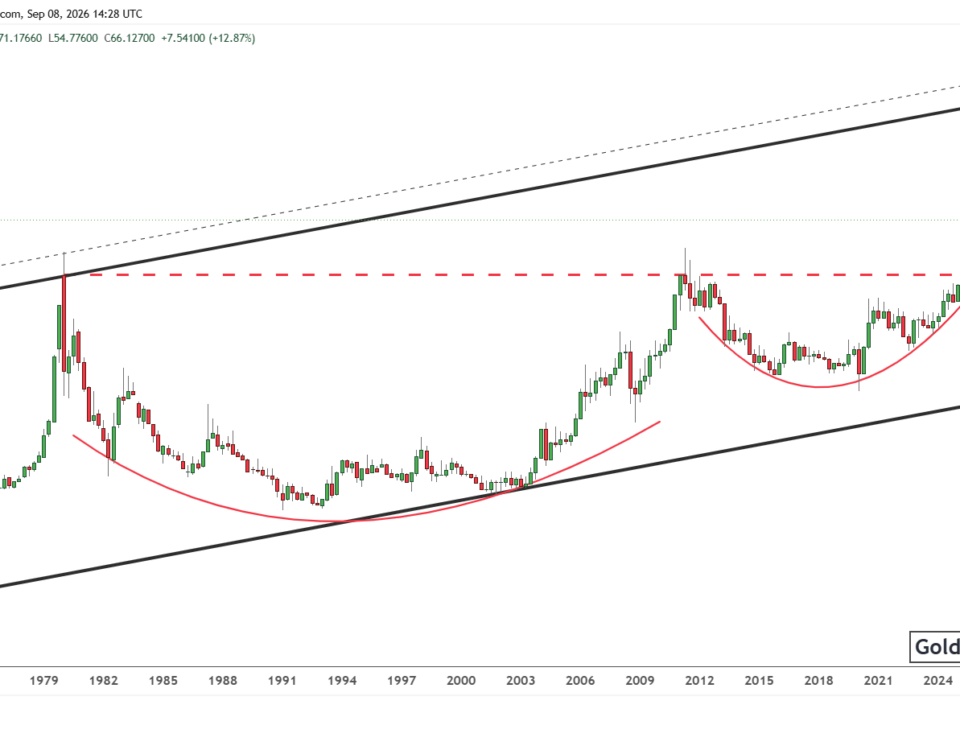
The chart below shows the Lithium versus Gold ratio trading inside a long-term broadening wedge. The ratio repeatedly respected the upper and lower boundaries of the pattern across multiple market cycles. It also formed a rounded base near the lower boundary before advancing toward the upper resistance trendline. These recurring moves between the wedge boundaries highlight the consistency of this long-term technical structure.
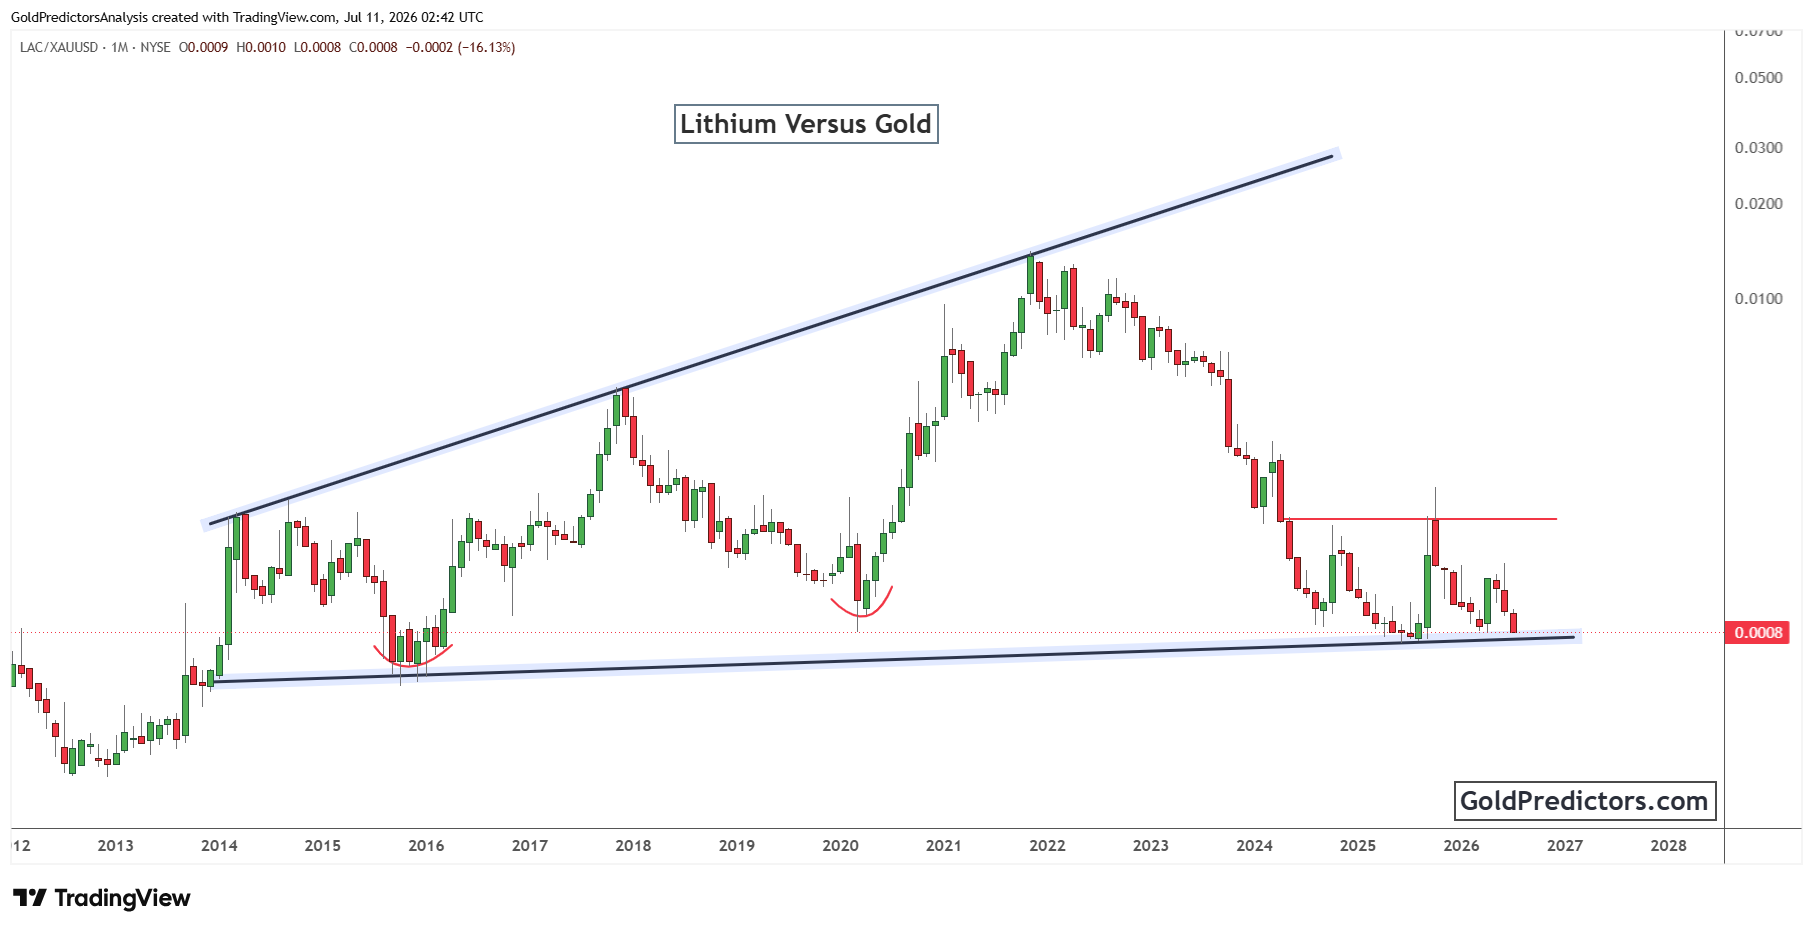
After reaching the upper boundary, the ratio reversed lower. Selling pressure increased as the ratio failed to extend higher, leading to a sustained decline over the following years. Momentum weakened further as lower highs and lower lows continued to develop. This decline confirmed that gold steadily outperformed lithium during this period.
The ratio now trades close to the lower boundary of the long-term wedge. This trendline remains an important technical level after supporting previous recoveries. The current price action reflects continued weakness in lithium relative to gold. Holding above wedge support could stabilize the ratio, while a sustained move below this level would indicate that gold continues to strengthen relative to lithium.
Gold Price Outlook: Bullish Breakout Holds While Lithium Tests Major Support
Gold continues to hold a strong long-term technical structure despite the recent correction from record highs. The historic breakout from the multi-decade triangle remains intact and continues to support the broader technical outlook. As long as price stays above the former breakout zone, the broader technical outlook remains positive.
At the same time, the Lithium versus Gold ratio continues to trade near a major long-term support level. The ratio remains under pressure after its prolonged decline from wedge resistance. The reaction around this support will help determine whether lithium begins to stabilize or gold continues to outperform.
These developments place both markets at important technical levels. Gold remains above a major breakout level, while the ratio continues to test long-term support. The next phase for both markets will depend on how price behaves around these important technical levels, making them key areas to monitor in the months ahead.
Gold Predictors Premium Membership
Get exclusive short-term and swing trade ideas with precise entry levels, stop-loss, and target prices, including justification and analysis — all delivered directly via WhatsApp.
Our premium service includes deep technical analysis on gold and silver markets. We cover cycle analysis, price forecasting, and key timing levels.
Members also receive a weekly market letter with detailed analysis, commentary from our Chief Analyst, including actionable insights, trade timing, and direction forecasts for gold and silver.
Stay ahead of the market — join our premium community today.