Gold Price Forecast: Can XAUUSD Hold Its Historic Breakout as Gold vs PPI Cools?
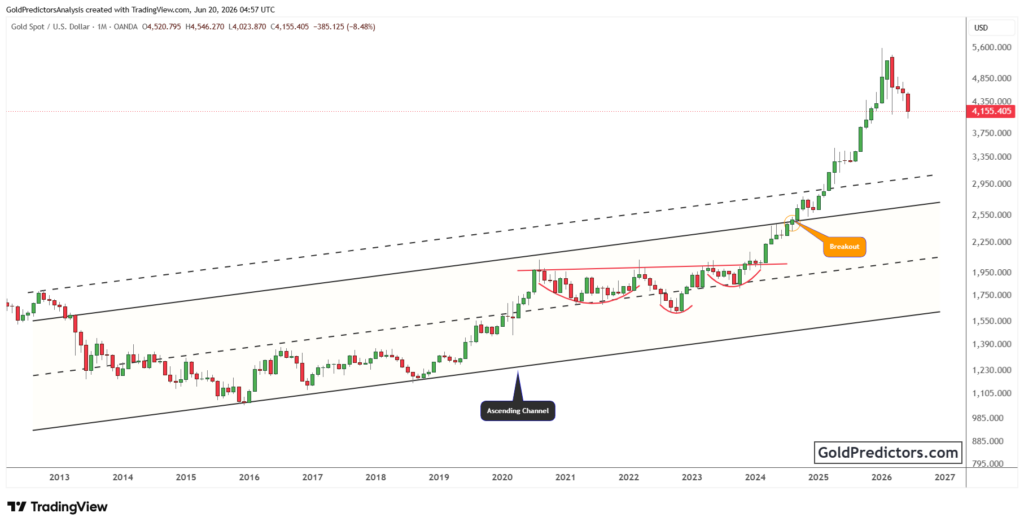
Gold (XAUUSD) is undergoing a correction after breaking out of a long-term ascending triangle. The breakout followed a multi-year period of price compression and marked a major shift in the long-term trend. At the same time, the Gold versus Producer Price Index ratio is easing after breaking above multi-decade resistance. These technical developments may offer valuable insight into the future direction of gold prices and relative value trends.
Gold Technical Analysis: XAUUSD Corrects After Historic Breakout
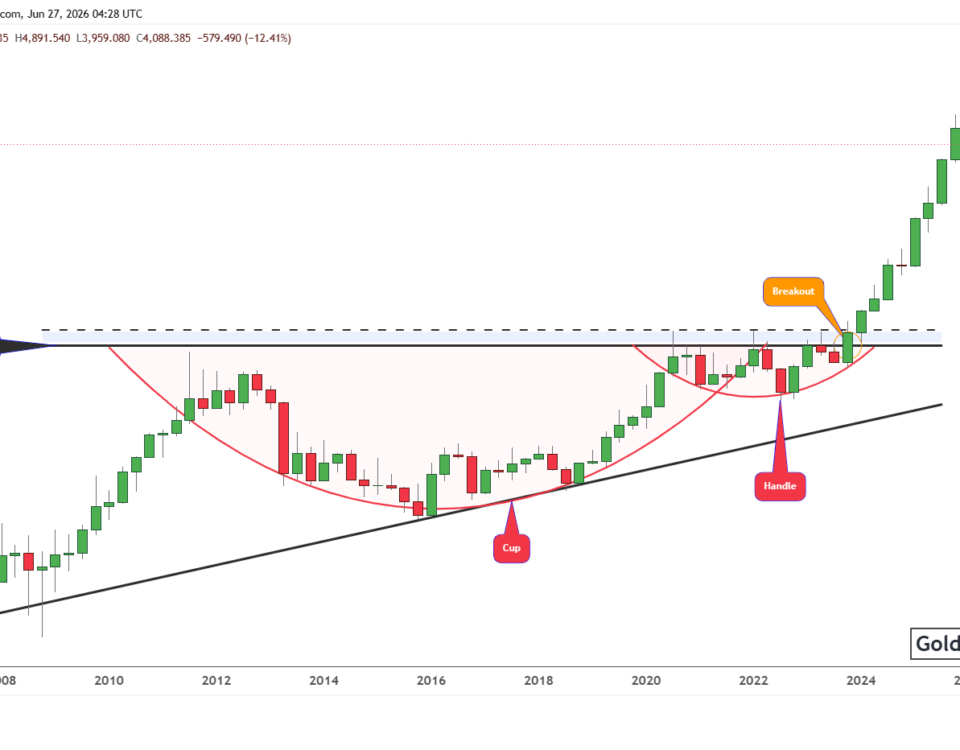
The gold chart below shows a long-term ascending triangle that developed over many years. Price remained capped beneath a horizontal resistance zone from 2011 to 2023, while higher lows formed along a rising support line. This structure reflected a prolonged period of compression before the breakout. In 2024, gold moved above the resistance zone and confirmed the long-term breakout. This marked a major shift in the technical structure and initiated a strong upward trend.
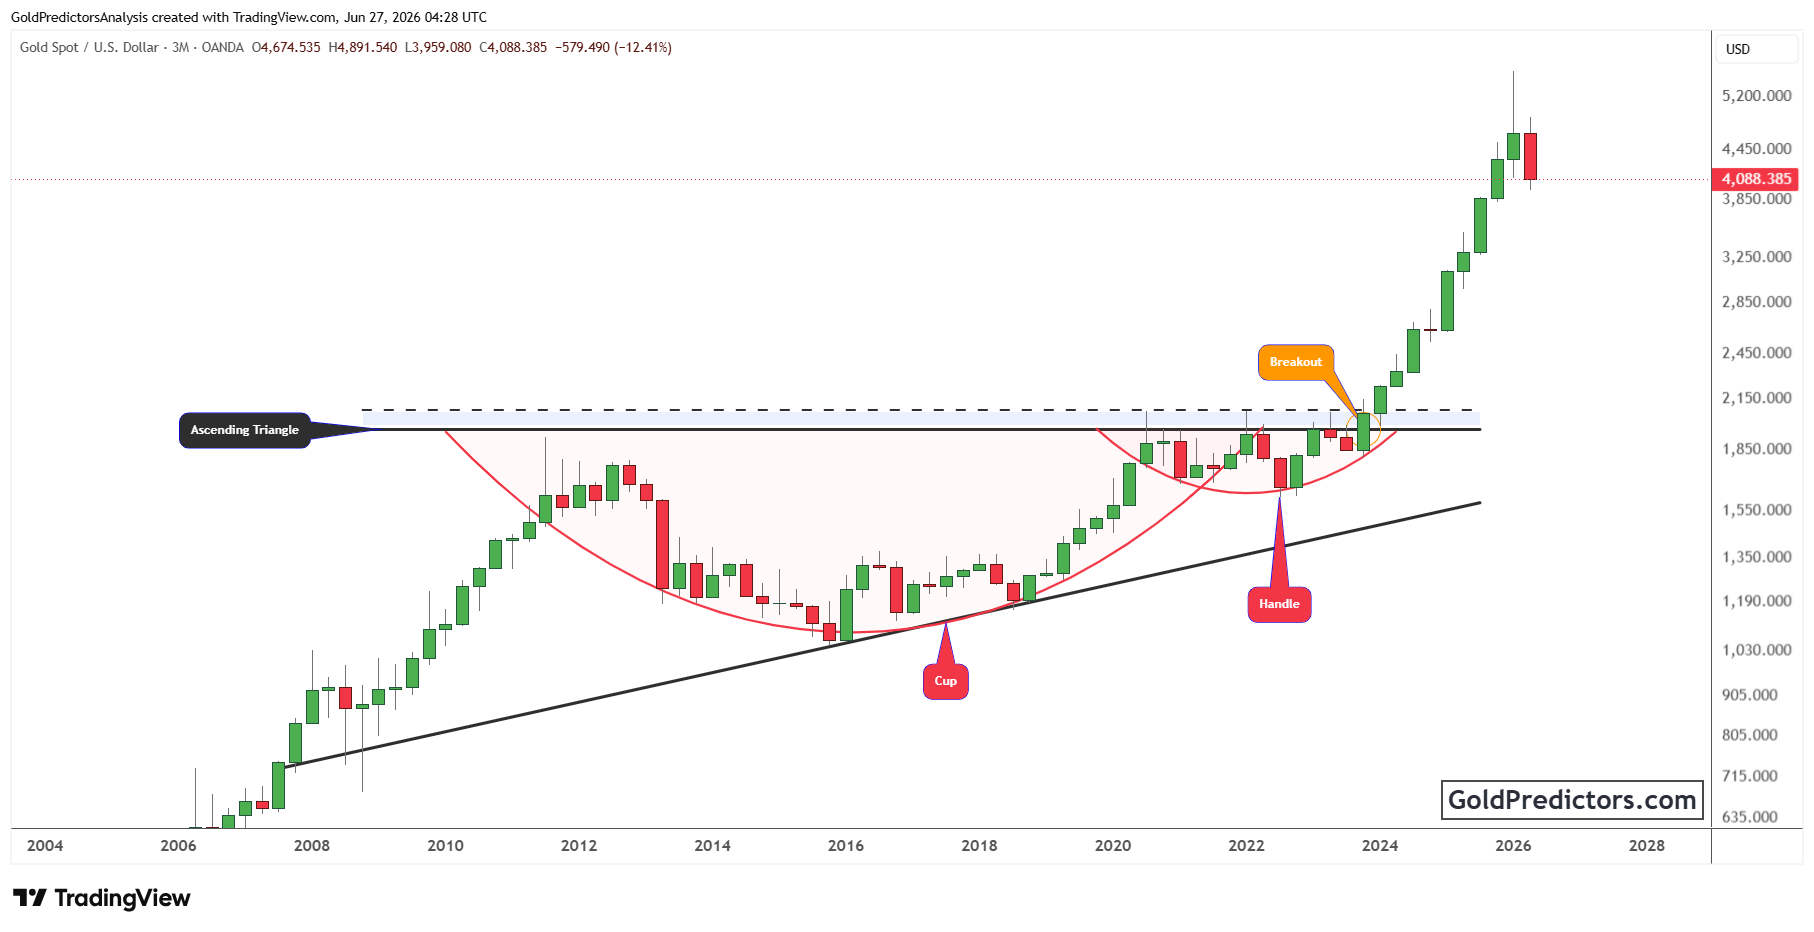
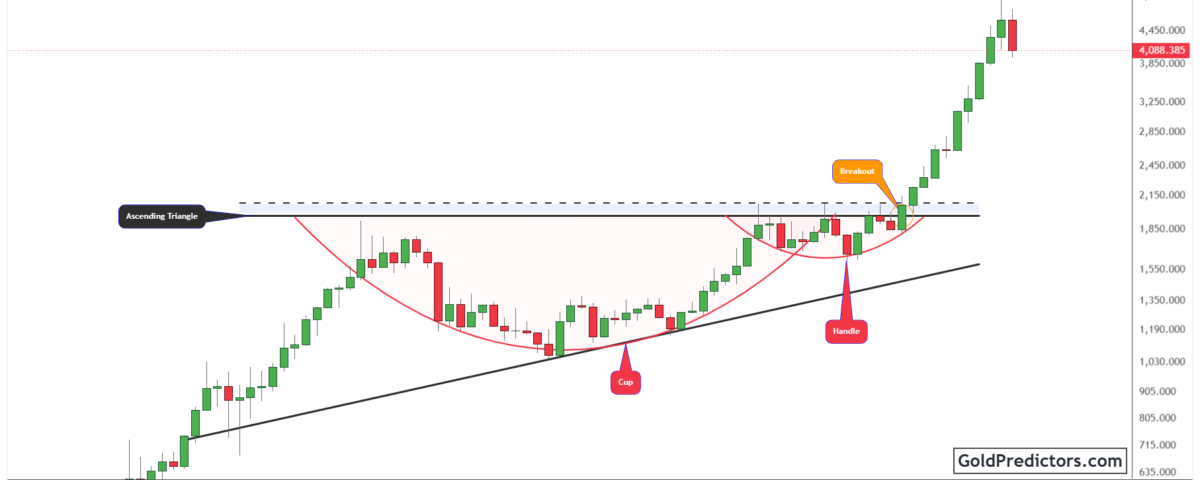
The chart also shows a long-term cup and handle pattern that developed over several years. The rounded cup reflected an extended period of accumulation, while the handle formed as a brief consolidation near the upper boundary of the pattern. Gold later broke above the handle resistance and confirmed the continuation of the broader uptrend. Momentum strengthened after the breakout and carried price well above the former resistance zone. This move confirmed the successful completion of the pattern and marked the beginning of a strong long-term advance.
The latest candle reflects a corrective move after a strong advance toward higher levels. Price now trades below recent highs as upward momentum slows. The current pullback suggests a period of consolidation following the recent gains. The next direction will depend on whether buying interest returns or the correction extends further.
Gold vs PPI Ratio Retreats after Breaking above Long-Term Resistance
The chart below shows a long-term Gold versus Producer Price Index ratio that remained below a broad horizontal resistance zone for several decades. The ratio repeatedly failed to break above this upper boundary across multiple market cycles. Over time, several rounded bases formed, reflecting extended periods of compression before expansion. This long-term structure pointed to repeated accumulation phases that eventually led to the breakout.
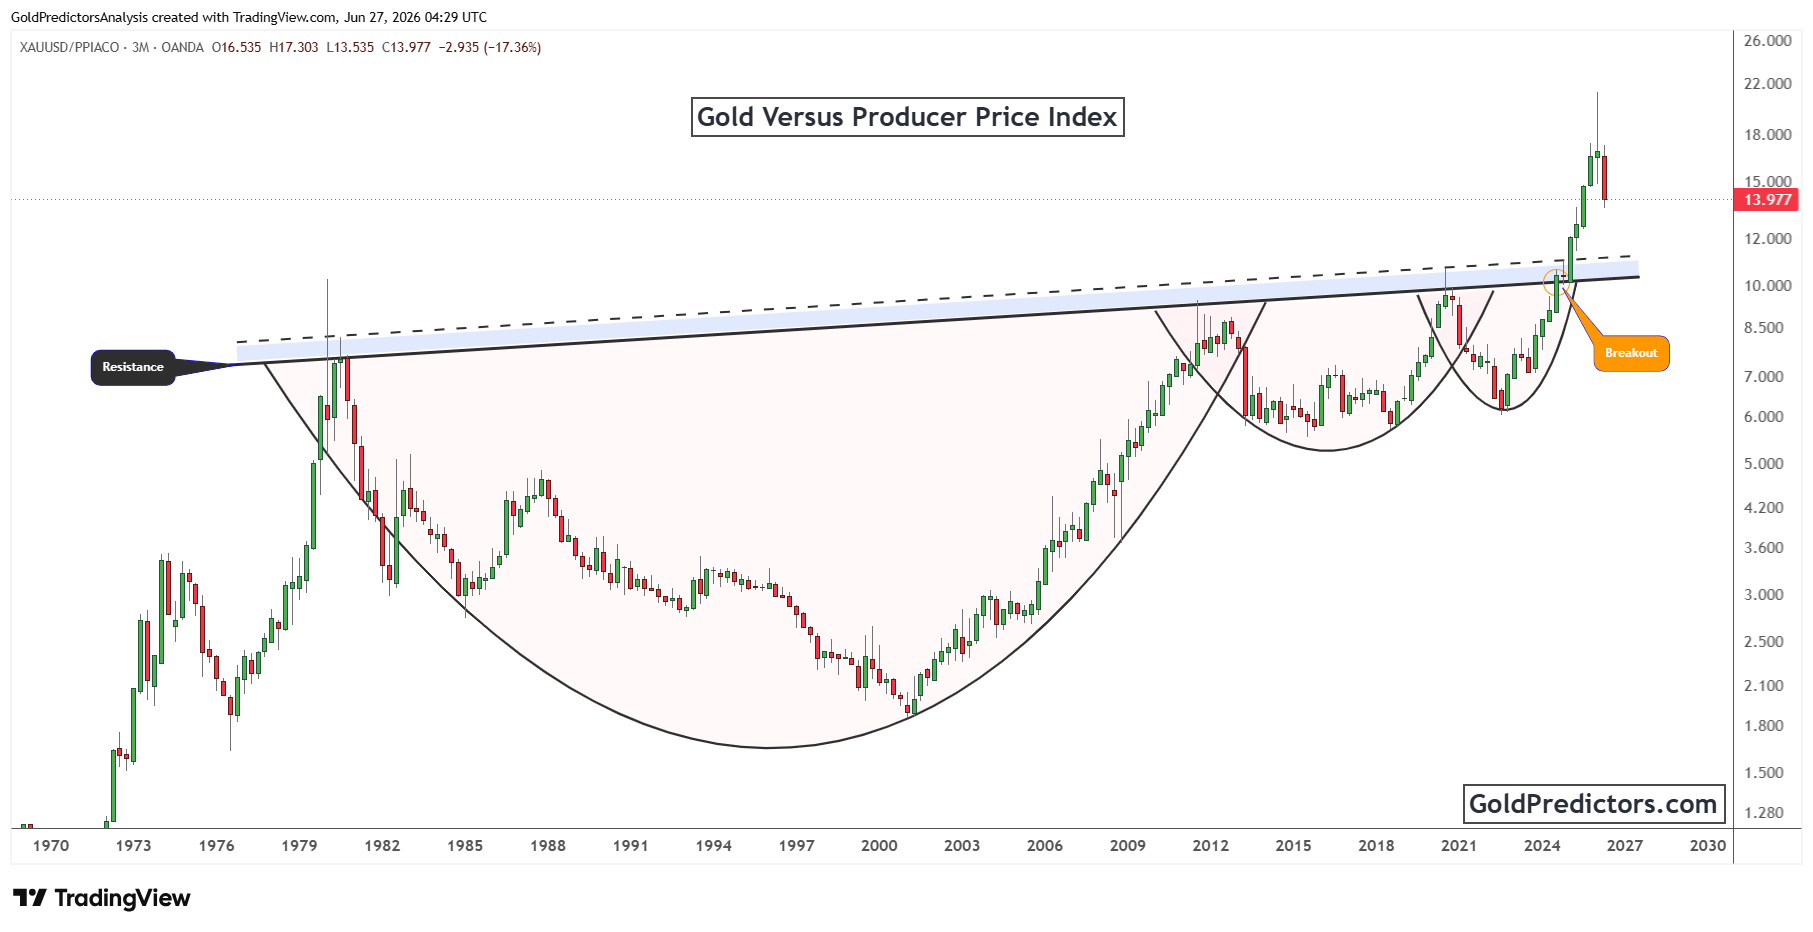
In 2025, the ratio breaks above the long-standing resistance zone after repeated failures near the upper boundary. Momentum expands sharply following the breakout. Price accelerates away from the prior range and enters a strong upward phase. This confirms a transition from long-term compression to expansion.
The ratio now trades well above the former ceiling while showing signs of a gradual decline from recent highs. This suggests that gold has started to lose relative strength compared with producer prices. The current pullback reflects a cooling phase within the broader long-term trend. Holding above the breakout area would support the long-term structure. However, a move back below this level could weaken the breakout and shift the ratio toward its previous range.
Conclusion: Gold Prices Correct as Gold vs. PPI Ratio Enters a Cooling Phase
Gold has entered a corrective phase after breaking out of a long-term ascending triangle. The breakout followed a multi-year period of price compression between 2011 and 2023 and marked a major shift in the long-term trend. Gold is now trading below its recent highs as the market digests the strong advance. The next direction will depend on how price behaves around current levels.
At the same time, the Gold versus Producer Price Index ratio has started to ease after breaking above multi-decade resistance. The ratio expanded sharply following the breakout and confirmed a long-term shift in relative performance. It now shows signs of a pullback from recent highs. However, it continues to hold above the former resistance area, which remains an important reference zone for trend behavior.
These developments highlight a transition phase in both price and relative strength. Gold is moving through a corrective phase after a strong expansion. The ratio is also cooling after its breakout move. The next direction will depend on how price reacts around current levels. Sustained stability above key zones can support continuation, while extended weakness may prolong the corrective phase.
Gold Predictors Premium Membership
Get exclusive short-term and swing trade ideas with precise entry levels, stop-loss, and target prices, including justification and analysis — all delivered directly via WhatsApp.
Our premium service includes deep technical analysis on gold and silver markets. We cover cycle analysis, price forecasting, and key timing levels.
Members also receive a weekly market letter with detailed analysis, commentary from our Chief Analyst, including actionable insights, trade timing, and direction forecasts for gold and silver.
Stay ahead of the market — join our premium community today.