Gold vs. Silver: Is Gold Regaining Strength Against Silver?
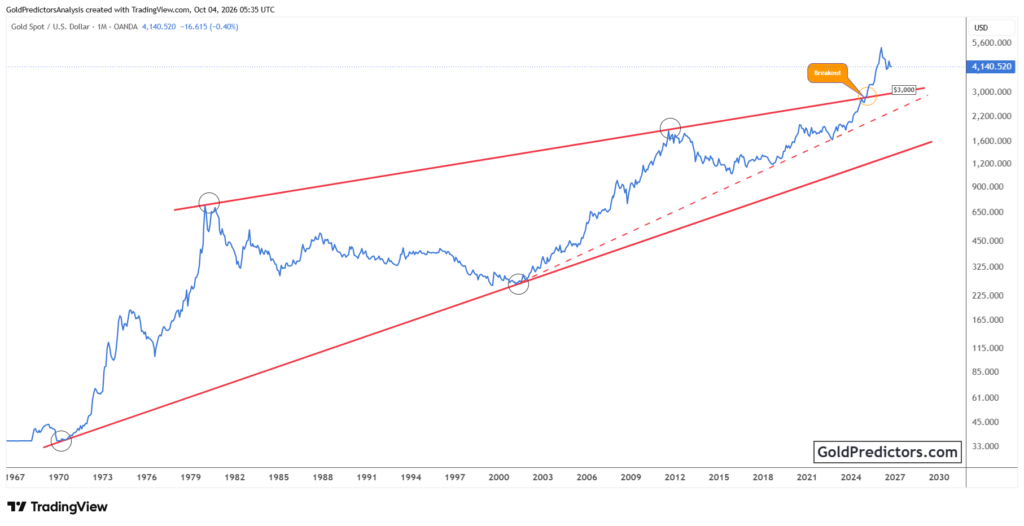
Gold (XAUUSD) has eased from record highs and is testing an important support zone within a large ascending broadening wedge. This support area could play an important role in shaping the next phase of price action. At the same time, the Gold versus Silver ratio has rebounded from an important support zone within a long-term broadening wedge. These developments could shape the next move in gold and its relative strength against silver. These charts may offer valuable insight into the broader outlook for precious metals.
Gold Technical Analysis: Key Support Zone Could Determine the Next Move in XAUUSD
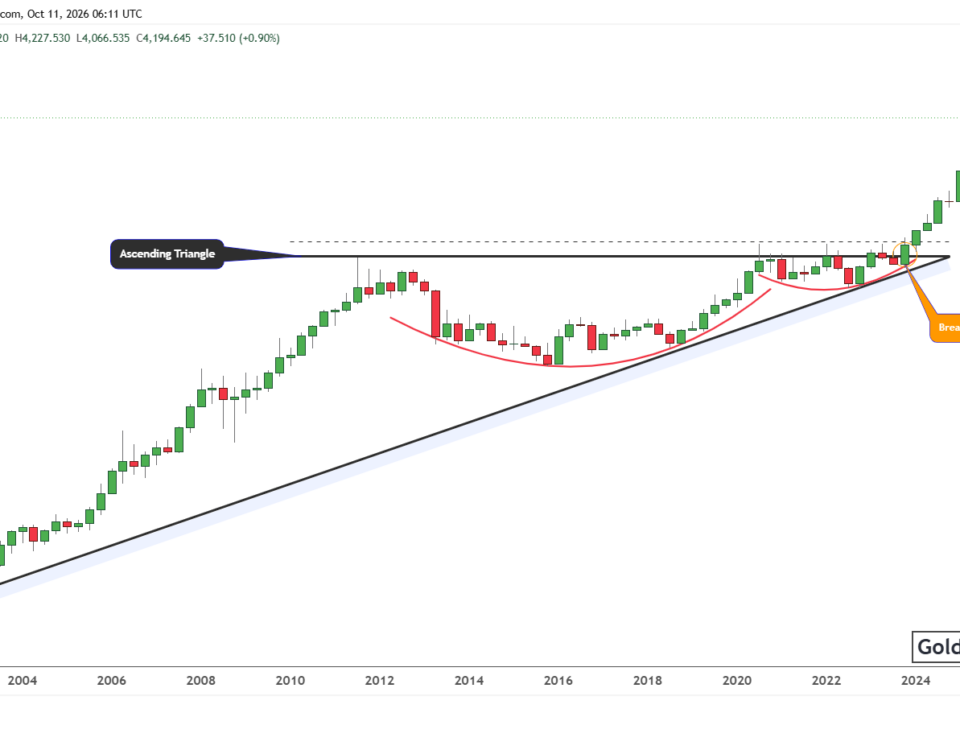
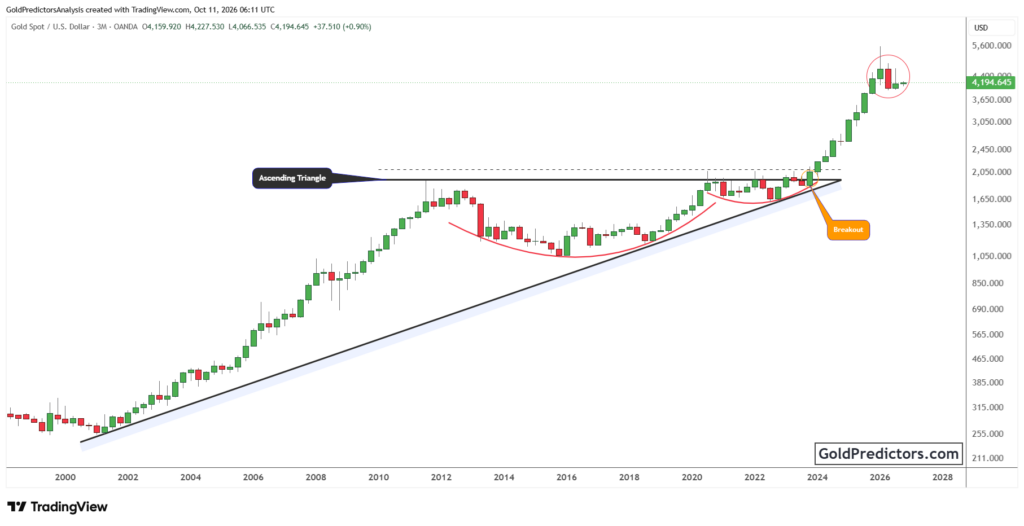
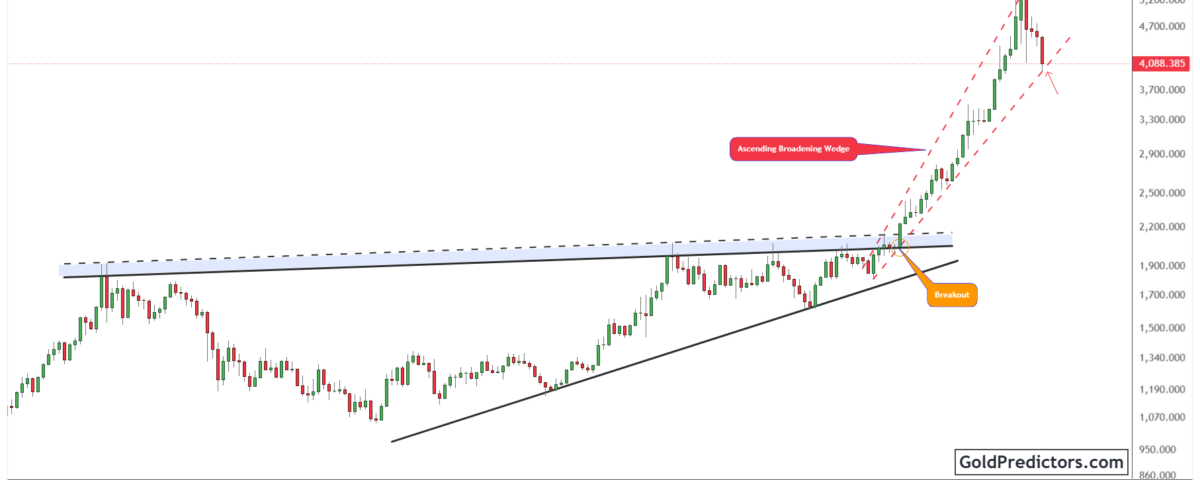
The gold chart below shows a large triangle that developed between 2011 and 2024. Gold remained within this pattern for more than a decade as the upper boundary acted as resistance and the lower rising trendline provided support. The narrowing price action reflected a prolonged period of compression before a major directional move. In early 2024, gold broke above the triangle resistance and confirmed a historic breakout. This event marked a significant shift in the long-term structure and opened the door for a strong rally.
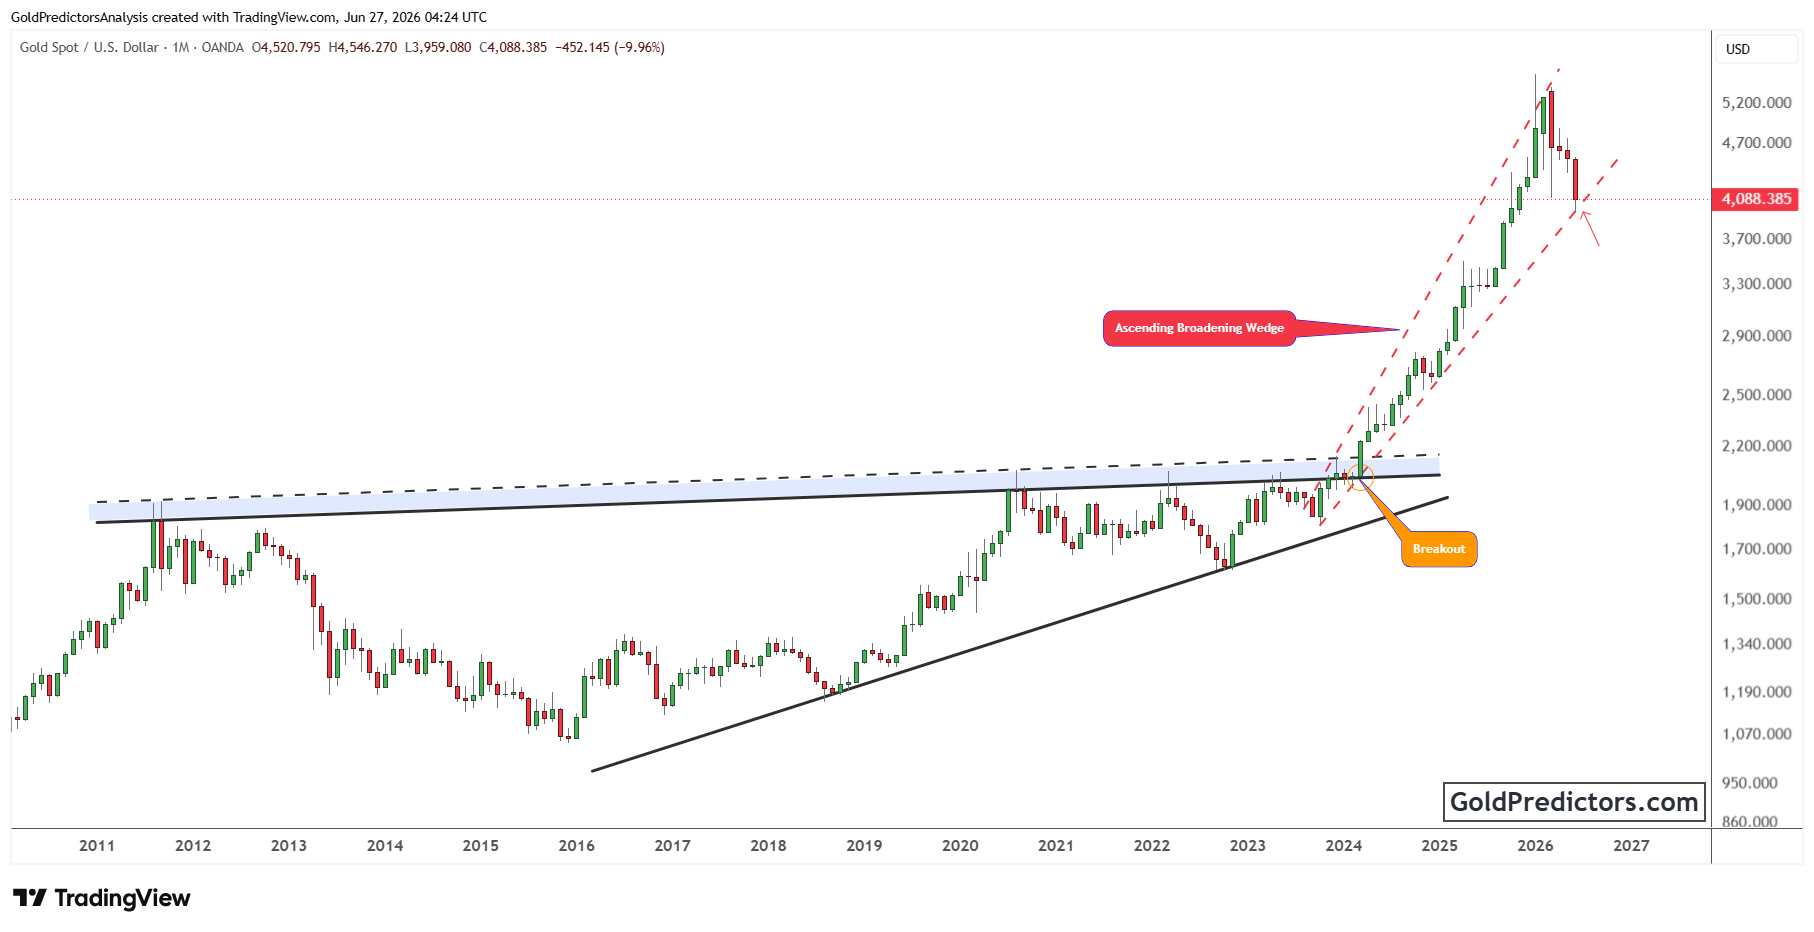
The chart also highlights a rising trendline that supported prices for several years before the breakout occurred. Gold respected this trendline through multiple corrections and maintained a sequence of higher lows. The breakout above resistance attracted strong momentum and pushed prices sharply higher. This move confirmed a new phase in the long-term trend and allowed gold to enter an accelerated advance.
After the breakout, gold formed a large ascending broadening wedge and advanced rapidly toward record highs. Price has recently pulled back and is now testing the lower boundary of the pattern. The wedge support remains an important level to watch. A move below this support could increase downside pressure, while holding above it could help maintain the long-term structure.
Gold vs. Silver Ratio Rebounds from Critical Support within a Long-Term Broadening Wedge
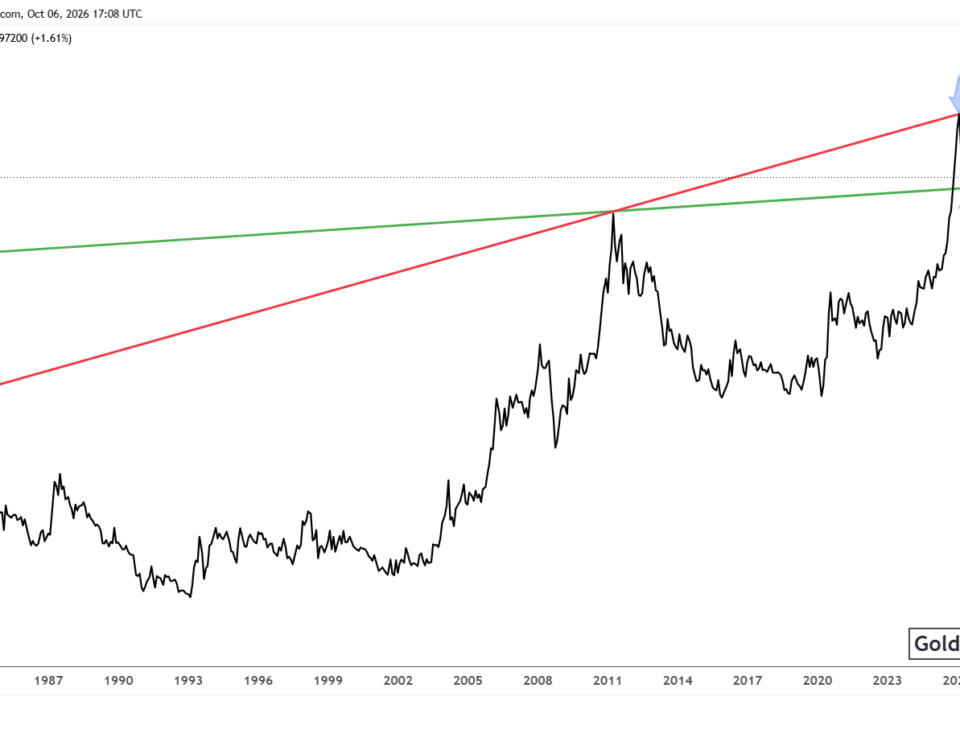
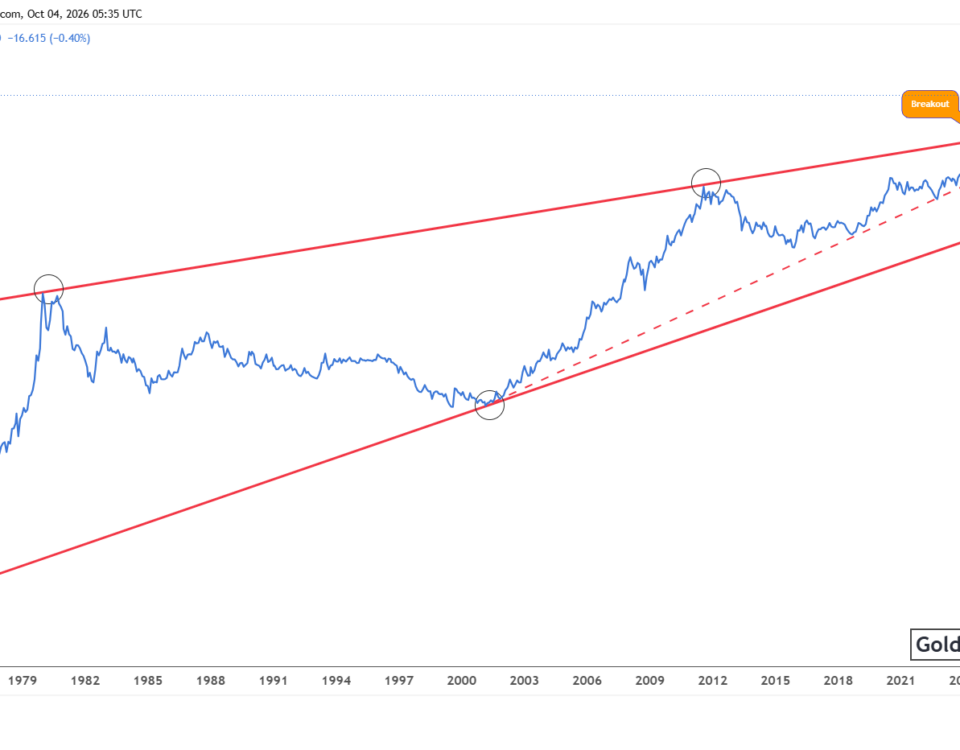
The chart below shows the Gold versus Silver ratio forming a long-term broadening wedge pattern that has guided price movements for several decades. The upper boundary has repeatedly acted as resistance, while the lower boundary has provided support during major declines. The ratio has respected these boundaries at several important turning points. This structure provides important insight into the long-term relationship between gold and silver.
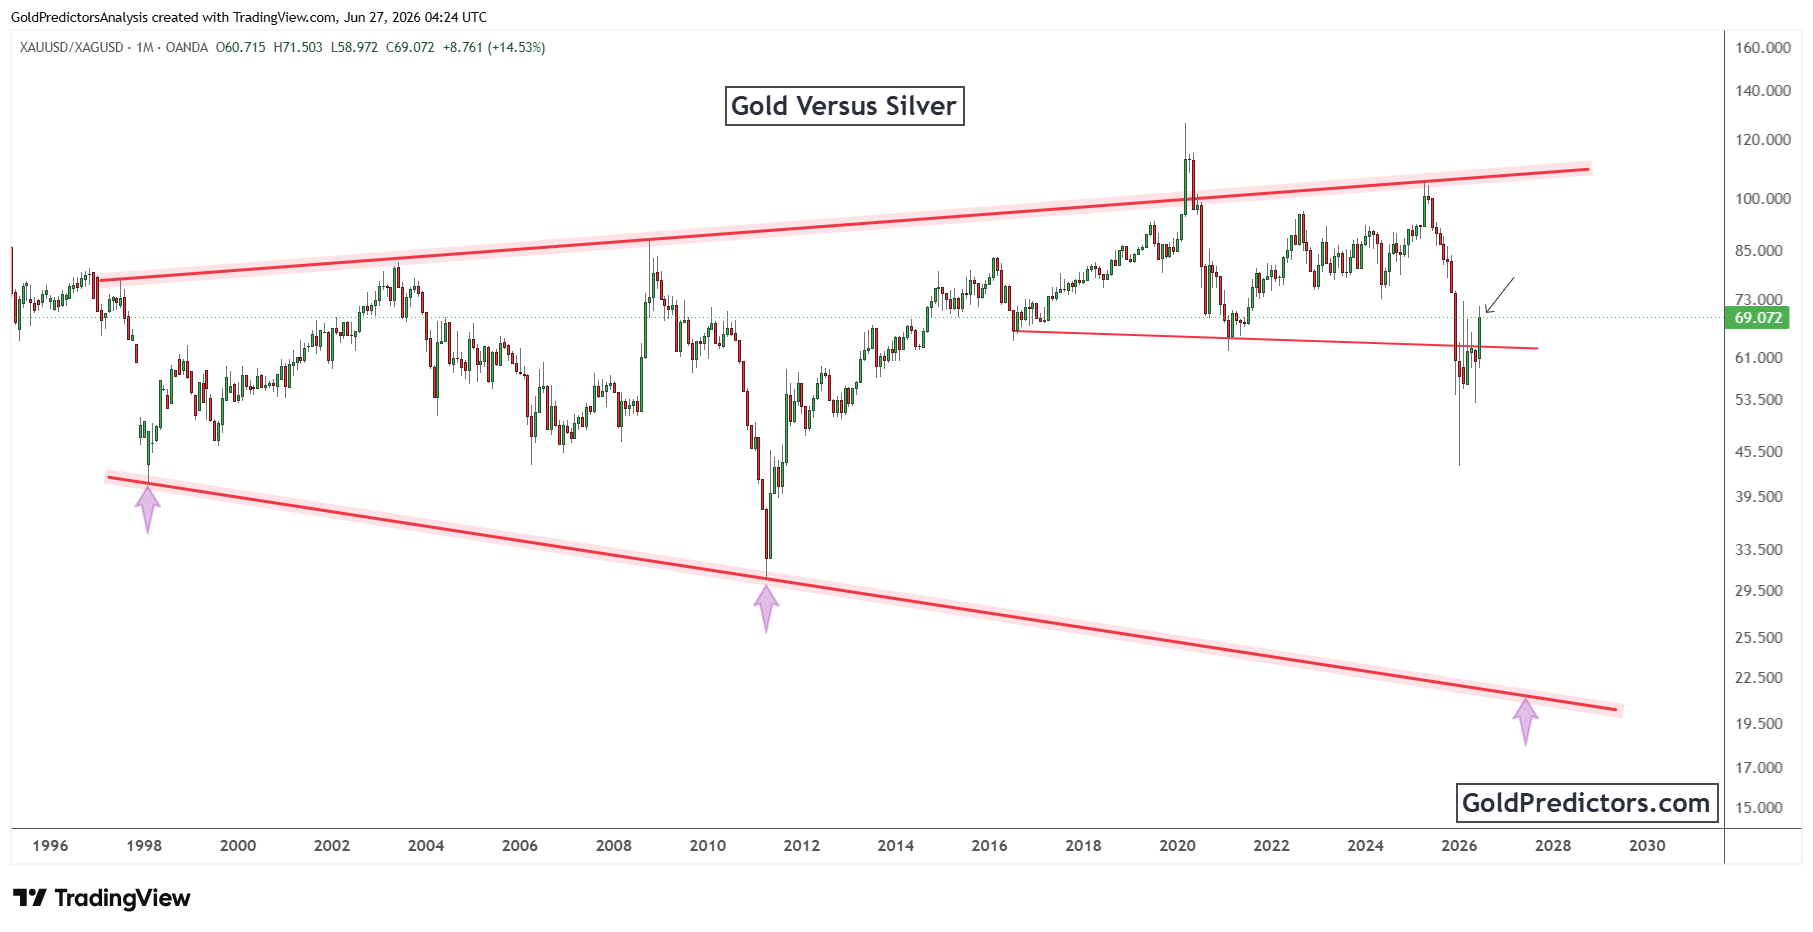
The ratio moved higher in recent years and reached an important resistance area near the upper boundary. It later entered a corrective phase and declined sharply toward an important support line in the upper half of the wedge. Price briefly slipped below this support before moving back above it. This level could help define the next phase in the ratio.
The recent rebound from this support highlights its technical importance. If the ratio continues to strengthen, gold could regain relative strength against silver. However, a move back below this support could favor silver’s relative performance. The next developments in the ratio could provide important signals for the long-term relationship between both precious metals.
Gold and Silver Outlook: Will the Recent Correction Define the Next Trend?
Gold has moved lower after a strong rally, but it continues to trade within a large ascending broadening wedge. The metal remains above important long-term levels despite the recent decline. Gold is now testing the wedge support, which could play an important role in shaping the next trend. Stability above this support could help preserve the long-term structure and support another advance over time.
At the same time, the Gold versus Silver ratio has declined toward an important support zone inside a long-term broadening wedge. The ratio briefly moved below this level before recovering above it. The recent rebound highlights the importance of this support and could provide important clues about the future balance between both metals. Continued strength in the ratio could indicate that gold is regaining relative strength against silver.
These developments highlight an important phase for the precious metals market. Gold is testing a key support level, while the Gold versus Silver ratio has rebounded from a critical support zone. The reaction around these levels could provide valuable insight into the long-term outlook for both metals. Investors will likely watch these developments closely for confirmation of the broader trend.
Gold Predictors Premium Membership
Get exclusive short-term and swing trade ideas with precise entry levels, stop-loss, and target prices, including justification and analysis — all delivered directly via WhatsApp.
Our premium service includes deep technical analysis on gold and silver markets. We cover cycle analysis, price forecasting, and key timing levels.
Members also receive a weekly market letter with detailed analysis, commentary from our Chief Analyst, including actionable insights, trade timing, and direction forecasts for gold and silver.
Stay ahead of the market — join our premium community today.