


Gold vs Stocks: Why Equities Continue to Outperform Gold in 2026
Gold (XAUUSD) has entered a corrective phase after reaching a major long-term resistance area. Price recently reversed lower after a strong advance toward the upper boundary of a decade-long ascending channel. At the same time, the Gold versus Stocks ratio continues to trade within a major triangle pattern, highlighting the relative strength of equities. These developments point to a challenging near-term outlook for gold as equities continue to outperform.
Gold Technical Analysis: XAUUSD Pulls Back After Hitting Long-Term Channel Resistance
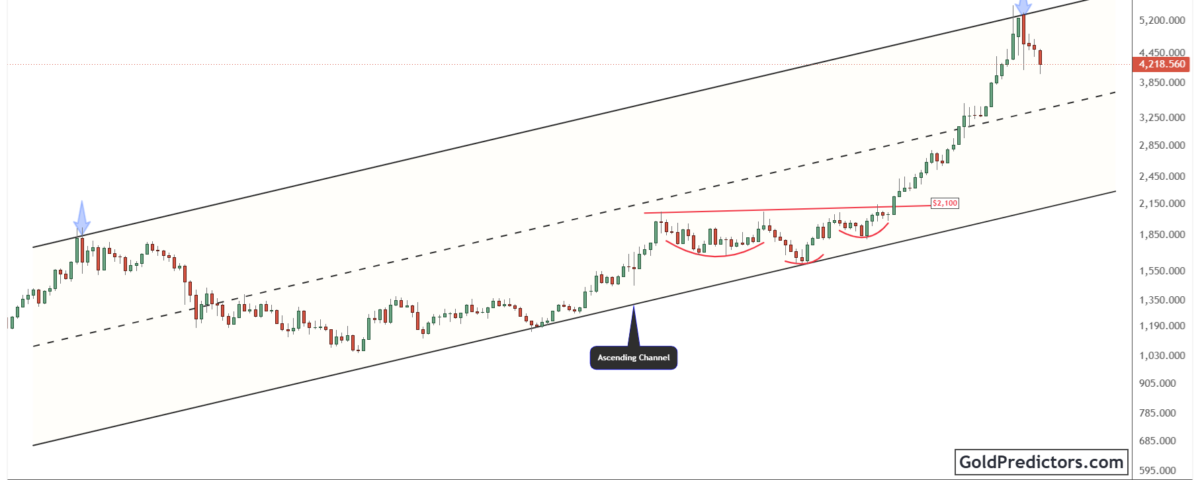
The gold chart below shows price trading within a large ascending channel that has guided price action for more than a decade. Price has repeatedly respected both the upper and lower boundaries of this formation. Previous advances reached the upper trendline before entering extended correction phases. The latest rally lifted gold toward the top of the channel, where resistance limited further gains and triggered a decline.
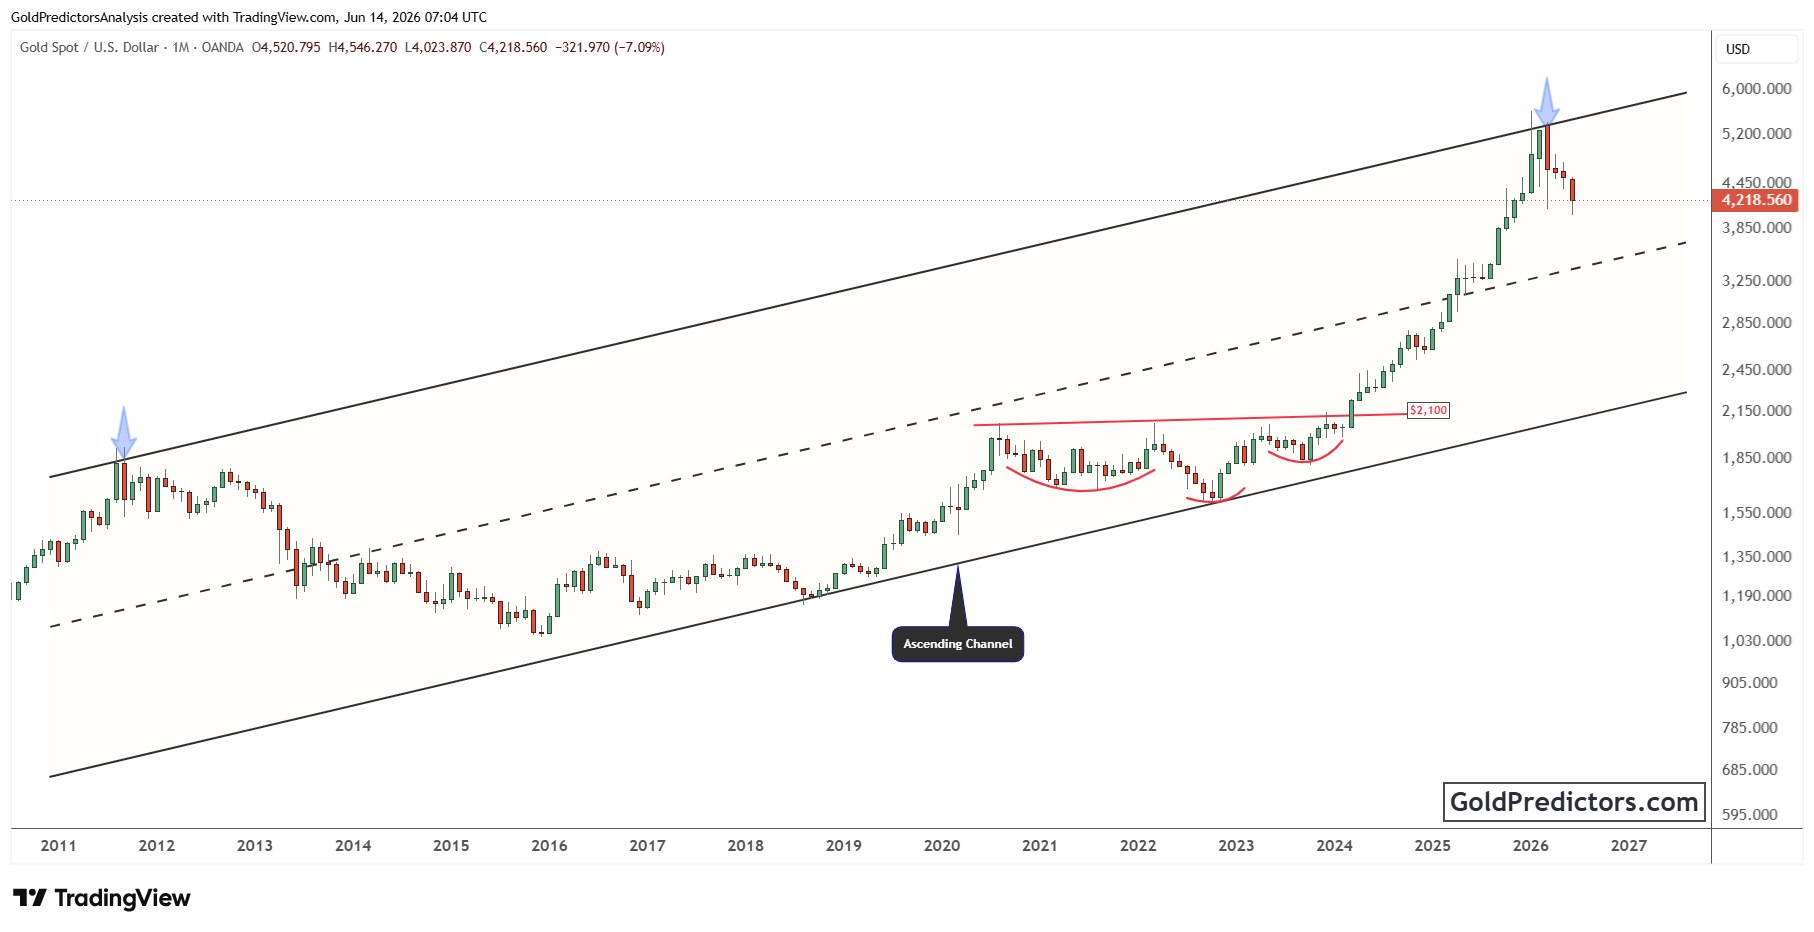
The chart also highlights a series of rounded bottom formations that developed during major periods of consolidation. These structures appeared near channel support and marked important turning points in the market. Each rounded base marked a period of consolidation and helped establish the foundation for the next phase of the trend. The move above the $2,100 region marked a significant shift in momentum and signaled the continuation of the broader trend.
More recently, gold reached the upper boundary of the ascending channel and formed a significant peak. Following that move, price reversed lower and entered a correction. The decline reflects a notable loss of momentum after the strong advance toward the upper boundary of the channel. Price remains within the long-term channel as the market undergoes a corrective phase following the rejection near the upper trendline. The recent reversal highlights the importance of channel resistance in shaping current price action.
Gold vs Stocks Analysis: Equities Continue to Outperform Gold
The chart below shows the Gold versus S&P 500 ratio trading within a large symmetrical triangle that has developed over several decades. Price has repeatedly reacted to both the descending resistance trendline and the rising support trendline, confirming the importance of the pattern. The long-term structure highlights an extended consolidation phase, with price fluctuations becoming increasingly compressed within the pattern.
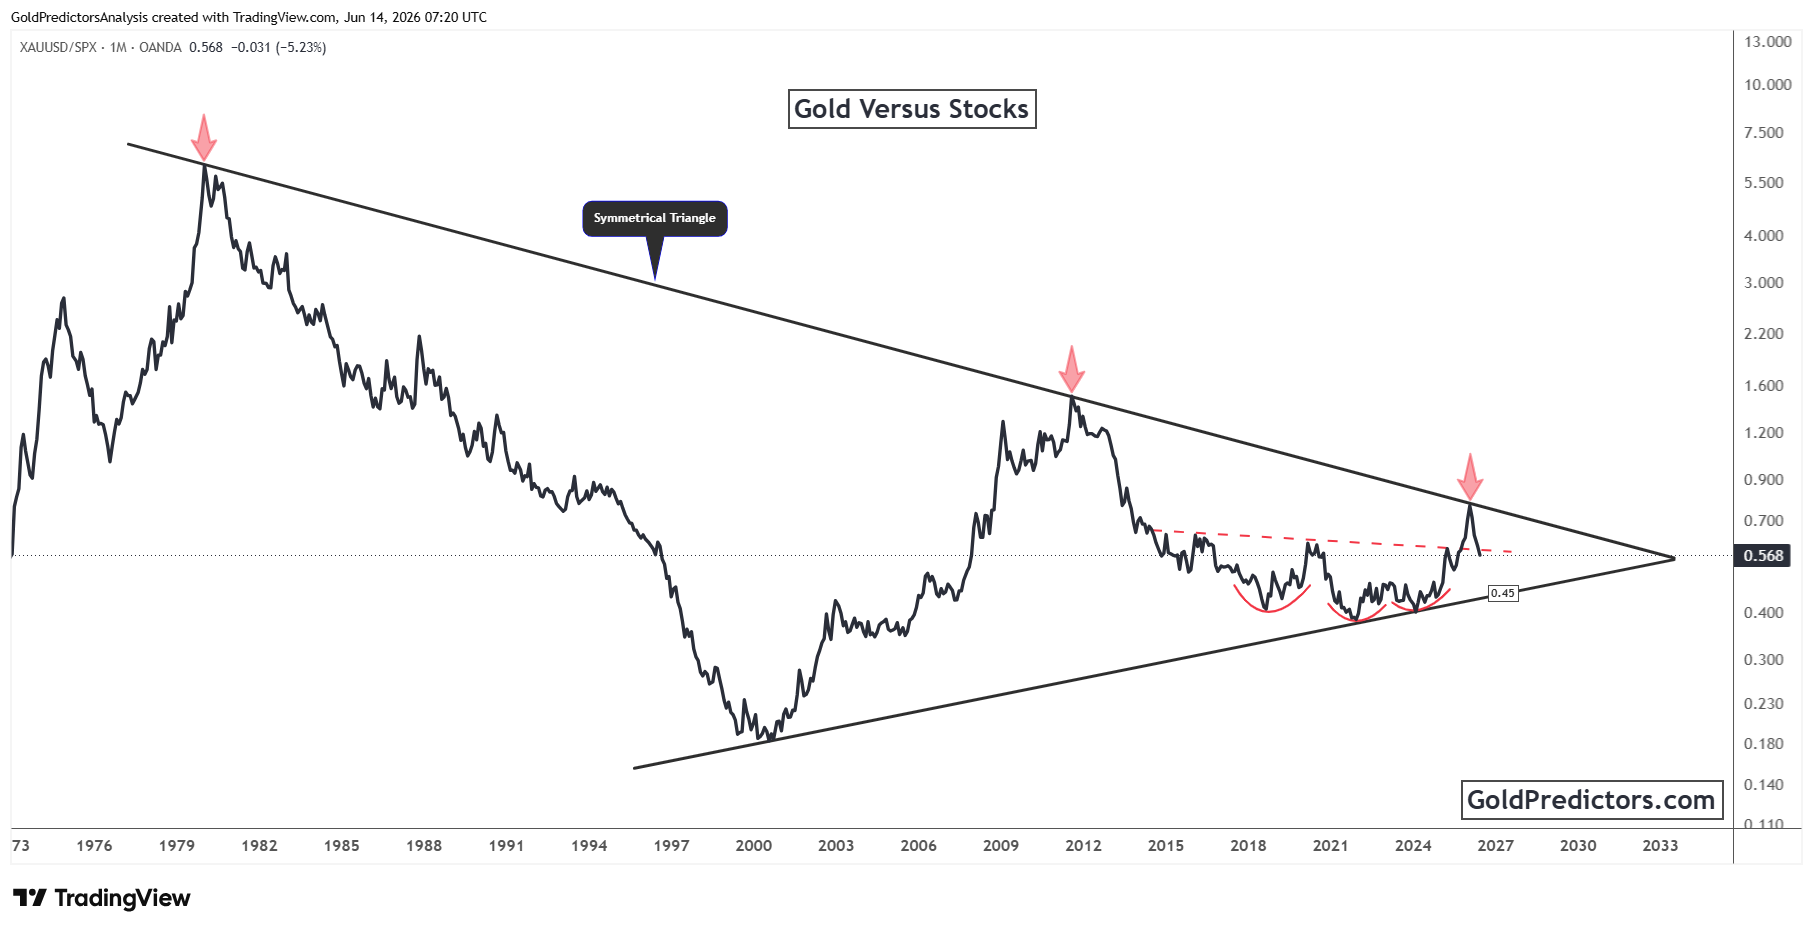
Meanwhile, several major peaks formed near the descending resistance trendline. Each rally into this area lost momentum and reversed lower, highlighting the significance of the upper boundary. More recently, the ratio advanced toward resistance once again and produced another rejection near the trendline. The latest setback suggests that stocks continue to outperform gold as the ratio remains capped beneath long-term resistance.
At the same time, the ratio continues to hold above the rising support trendline. A series of rounded bottom formations also emerged during recent consolidation phases. These formations helped stabilize the ratio and supported subsequent recoveries. This price action highlights continued support near the lower boundary of the triangle as the ratio remains confined within converging trendlines.
Conclusion: Gold Correction Develops Within a Strong Long-Term Structure
Gold has entered a corrective phase after reaching the upper boundary of a major long-term ascending channel. The recent rejection near channel resistance has weakened momentum and shifted attention toward the current pullback. While the broader trend remains intact, the correction highlights the importance of the upper trendline as a significant barrier to further gains.
At the same time, the Gold versus Stocks ratio remains confined within a large symmetrical triangle. The recent rejection near long-term resistance highlights the continued strength of equities relative to gold. The ratio continues to trade between converging trendlines, indicating that stocks maintain their relative advantage while the pattern remains intact.
These developments indicate that gold may face continued pressure in the near term. The long-term channel resistance and the relative strength of equities both point to a cautious outlook. Unless gold regains momentum and improves its relative performance against stocks, equities may continue to lead.
But the recent rebound in spot gold from $4,000 has reached the initial resistance at $4,350. A break above this level will push the price to $4,500. But the rice must break and close above $4500 to confirm the bullish trend. A break below $4000 may trigger another drop in gold within the long-term bullish trend. However, the gold price is preparing for the next move during the correction in the first half of 2026.
Gold Predictors Premium Membership
Get exclusive short-term and swing trade ideas with precise entry levels, stop-loss, and target prices, including justification and analysis — all delivered directly via WhatsApp.
Our premium service includes deep technical analysis on gold and silver markets. We cover cycle analysis, price forecasting, and key timing levels.
Members also receive a weekly market letter with detailed analysis, commentary from our Chief Analyst, including actionable insights, trade timing, and direction forecasts for gold and silver.
Stay ahead of the market — join our premium community today.


