


Silver Price Forecast: Multi-Decade Breakout and Ratio Reversal Point to Strong Upside
Silver (XAGUSD) has broken out of a multi-decade consolidation pattern, marking the start of a major bull phase. After years of tightening price action within an ascending triangle, silver has surged decisively above the $50 resistance level.
This breakout follows a textbook cup-and-handle formation, confirming strong long-term momentum. At the same time, the silver-to-gold ratio has reversed its long downtrend, signaling silver’s return to leadership within the metals space. These moves highlight a structural shift and open the door to significant upside potential in the months ahead.
Silver Breaks Out of Multi-Decade Triangle, Signals New Bull Market Phase
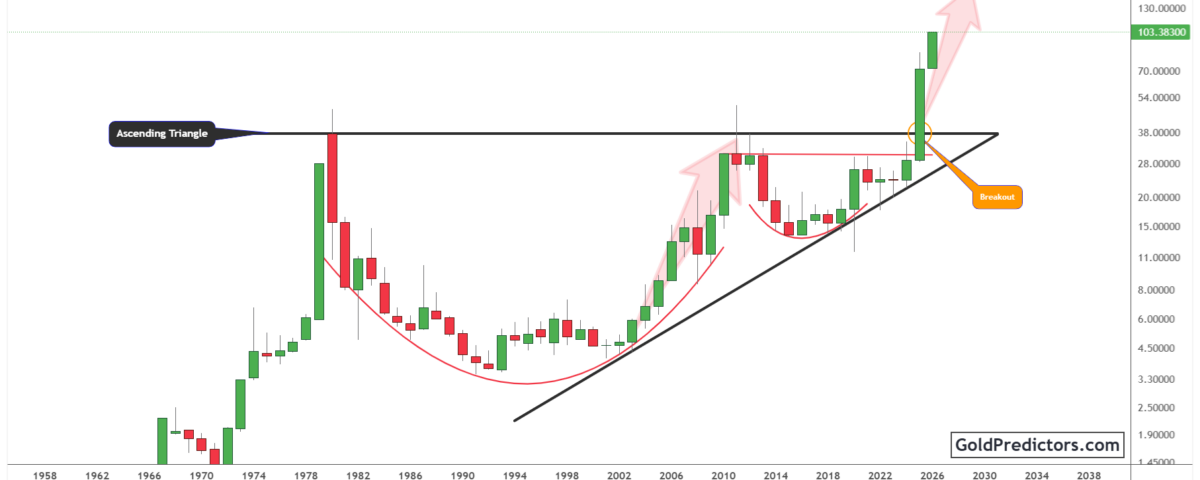
The silver chart below shows a breakout from a multi-decade ascending triangle pattern that began forming after the 1980 peak. The structure is defined by a horizontal resistance near $50 and a rising trendline connecting successive higher lows. This formation reflects long-term consolidation and tightening price action over several decades. It highlights sustained accumulation and sets the stage for a significant structural shift.

In 2025, silver decisively broke above the horizontal resistance, confirming the pattern and signaling the start of a powerful bullish phase. Moreover, the breakout followed a well-defined cup-and-handle formation that unfolded over an extended period. Price action carved a deep, rounded base, followed by a prolonged period of stabilization just below key resistance. This classic continuation pattern suggests a major shift in long-term momentum. The breakout candle is large and decisive, reflecting strong upward pressure and providing clear confirmation of the move.
With this breakout, silver has entered open territory with little overhead resistance. Former resistance around $50 may now act as support. The pattern reflects a steady buildup in momentum that ultimately led to this breakout. The sharp move higher confirms strong follow-through and suggests further upside. If momentum continues, silver could be entering a revaluation phase similar to previous major bull cycles.
Silver-to-Gold Ratio Reverses Long Downtrend, Confirms Silver’s Outperformance
The chart below shows a decisive breakout in the silver-to-gold ratio from a prolonged downtrend. After years of underperformance, silver has surged above the descending trendline that had acted as resistance since the 2011 peak. This breakout signals a major trend reversal and highlights growing momentum in silver relative to gold.
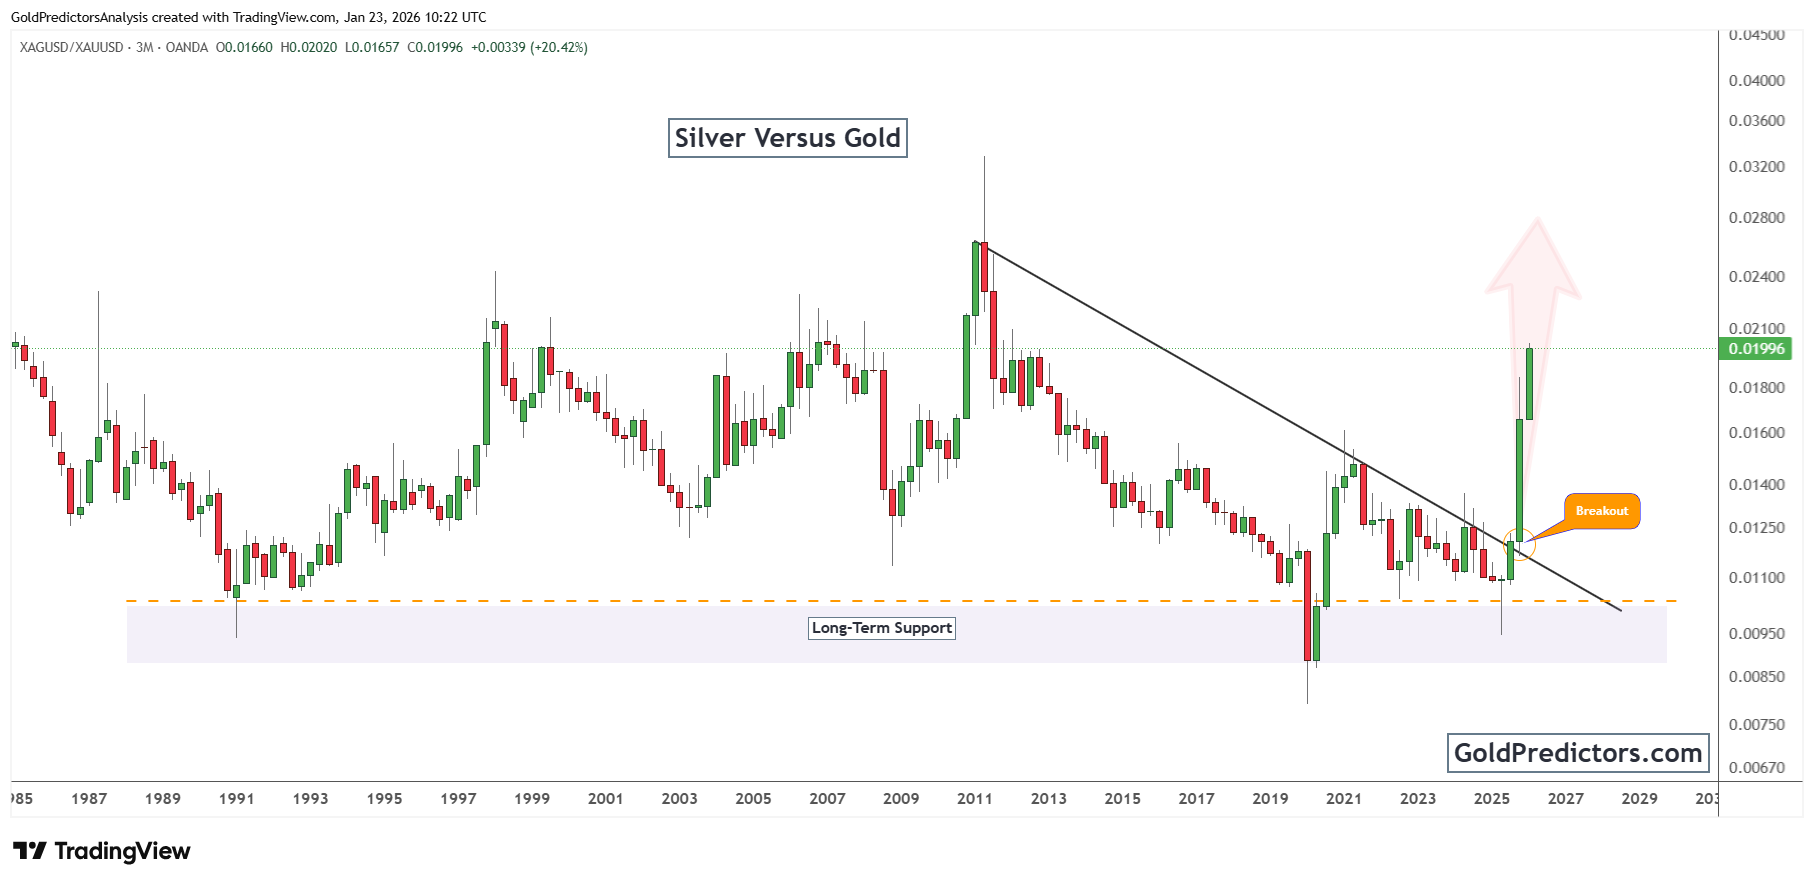
Over time, silver formed a solid long-term base, creating the foundation for its recent breakout. The support zone repeatedly held during multiple retests, serving as a key accumulation area that limited downside pressure. This persistent strength laid the groundwork for a sharp upside move. Once price broke above the descending trendline, momentum accelerated with strong follow-through, confirming a decisive shift in the market structure.
Moreover, the recent breakout marks a potential turning point in the silver-to-gold ratio. This move suggests that silver could begin outperforming gold over the coming quarters. With the breakout validated and previous resistance now acting as support, the ratio may continue climbing toward higher historical levels. This upward shift reflects a broader rotation into silver and signals a new phase of relative strength within the metals space.
Silver Forecast: Technical Breakout and Ratio Reversal Support Major Upside
Silver’s breakout from a multi-decade ascending triangle signals the beginning of a powerful bullish cycle. After years of compression below the $50 threshold, the price has surged decisively above resistance. The size and duration of the pattern confirm a major structural breakout. This move opens the door for a sustained advance toward higher long-term levels.
At the same time, the silver-to-gold ratio has broken out of a prolonged downtrend, signaling silver’s renewed leadership within the precious metals space. The ratio’s reversal reflects strong momentum and a broader rotation into silver. This technical shift strengthens the case for sustained outperformance in the months ahead.
With both the price structure and relative ratio breaking higher, silver now enters open territory. The absence of overhead resistance and strong follow-through suggest that further gains are likely. If current momentum holds, silver could experience a revaluation phase similar to its historic bull runs, offering compelling long-term opportunities for investors.
Gold Predictors Premium Membership
Get exclusive short-term and swing trade ideas with precise entry levels, stop-loss, and target prices, including justification and analysis — all delivered directly via WhatsApp.
Our premium service includes deep technical analysis on gold and silver markets. We cover cycle analysis, price forecasting, and key timing levels.
Members also receive a weekly market letter with detailed analysis, commentary from our Chief Analyst, including actionable insights, trade timing, and direction forecasts for gold and silver.
Stay ahead of the market — join our premium community today.


