


Silver Decade-Long Compression Ends with Explosive Momentum
Silver (XAGUSD) has entered a new phase of long-term strength. After years of consolidation, the metal has broken above its multi-decade resistance near $50 with powerful momentum. This breakout confirms a major bullish formation and signals the start of a sustained uptrend. At the same time, the platinum-to-silver ratio is testing historic lows, forming a potential bottoming pattern. These developments suggest a structural shift within the precious metals market, with silver taking the lead and platinum showing signs of a delayed recovery.
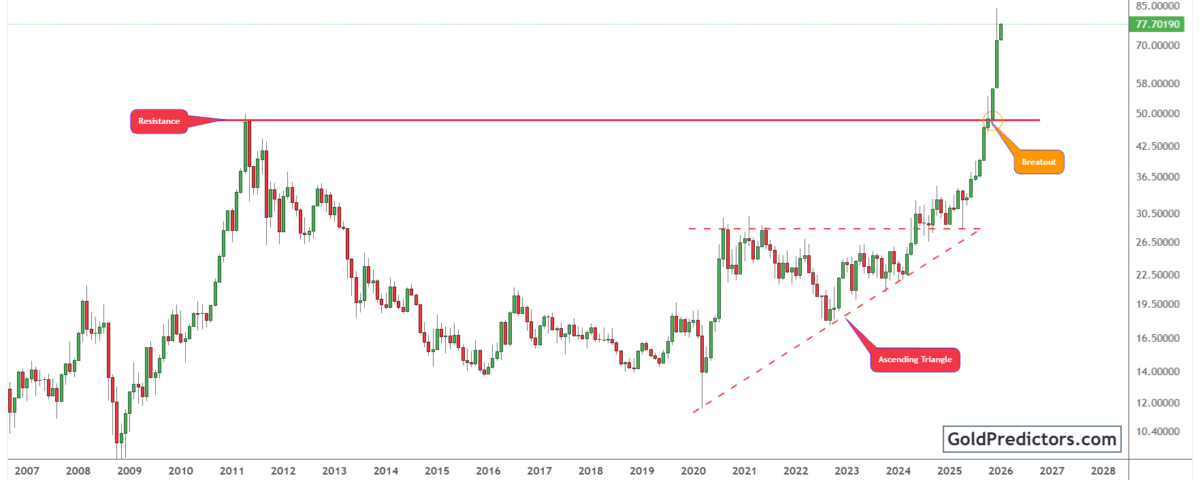
Silver Breaks Multi‑Decade Resistance and Enters Powerful Bull Market
The silver chart below shows a breakout from a historic resistance zone that rejected the 2011 bull market. This level, near the $50–$55 range, had held firm for more than a decade, acting as a strong ceiling for silver’s price. After years of compression and base formation, silver finally broke through this barrier in late 2025 with explosive momentum. The breakout triggered a sharp rally, sending prices above $80 in a single monthly candle and confirming the start of a powerful long-term uptrend.

Silver consolidated for over a decade beneath the $50 resistance, forming a well-defined ascending triangle between 2020 and 2024. This pattern reflected rising demand, with higher lows building consistent pressure against horizontal resistance. The eventual breakout in late 2025 marked the end of this compression phase and signaled the start of a powerful upward acceleration.
Notably, breakouts of this magnitude often signal the start of sustained multi-year trends. Silver’s recent move aligns with powerful macro forces, including falling real yields, rising inflation expectations, and renewed demand for hard assets. Central banks continue to accumulate gold aggressively, while silver is gaining recognition as both a monetary hedge and an industrial asset. The breakout above $50 strengthens the case for further gains, with $100 emerging as the next psychological target.
Platinum‑to‑Silver Ratio Tests Historic Lows as Reversal Risk Builds
The chart below shows a prolonged downtrend in the Platinum-to-Silver ratio, forming a clear descending wedge. This structure spans over three decades and is marked by falling highs and converging support levels. The downtrend began in the early 2000s, following repeated failures to reclaim higher levels, and has gradually narrowed into a tightening range.
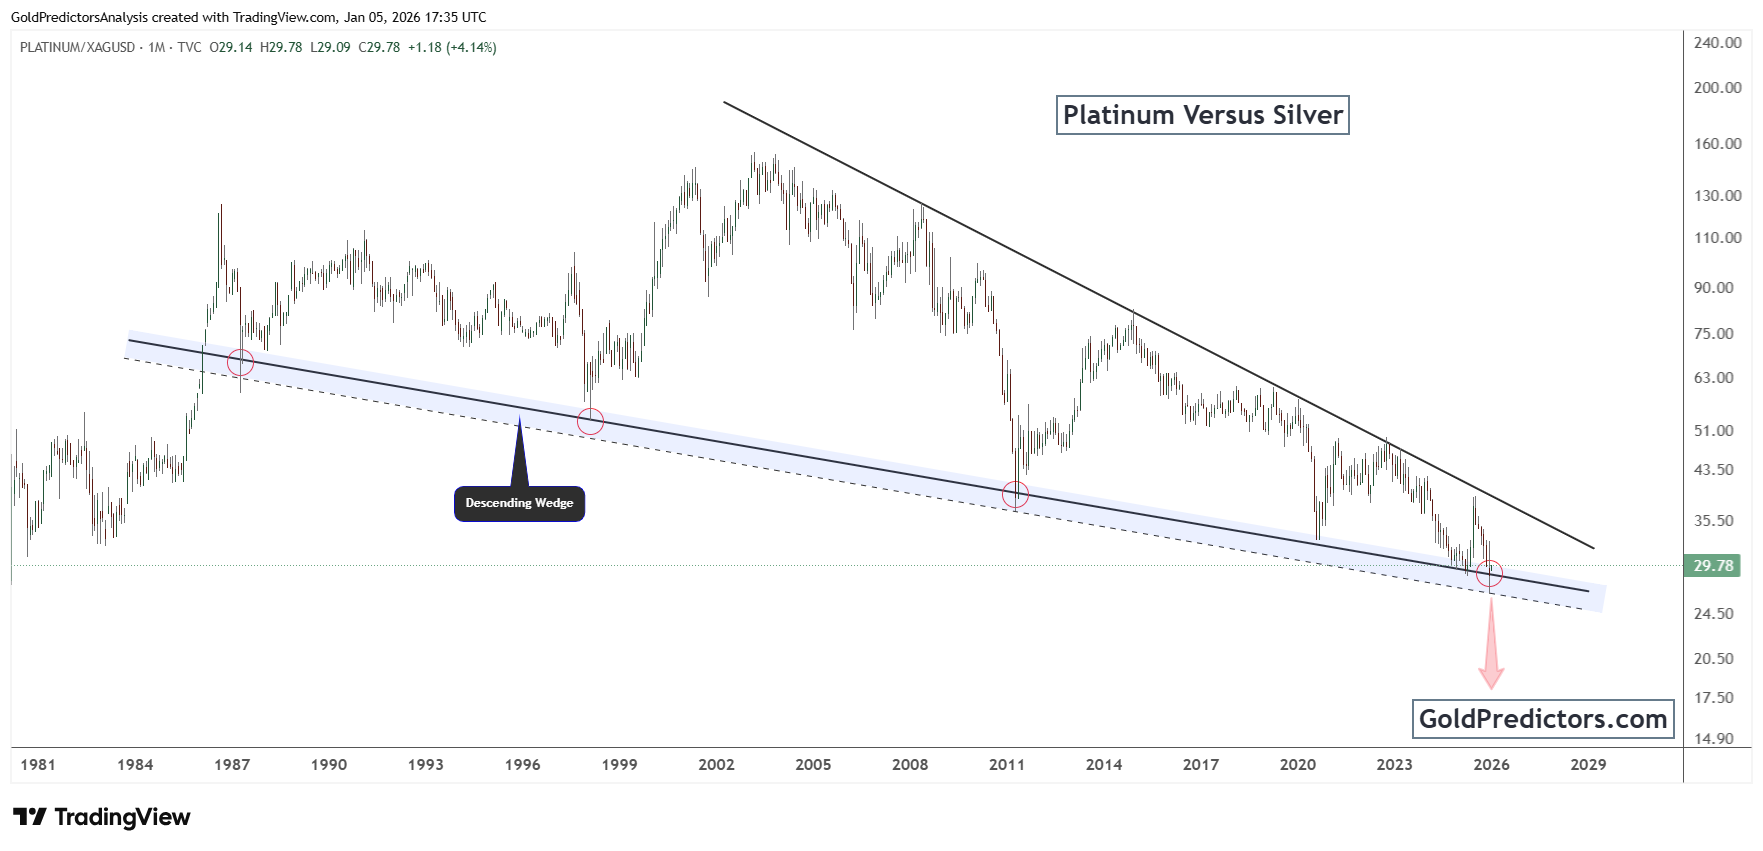
Additionally, repeated tests of the lower wedge boundary confirm its reliability as support. Each major decline found support near this zone, particularly during key inflection points where the ratio sharply reversed direction. These repeated bounces confirm the lower boundary of the wedge as a reliable support base. Price recently tested this support again in 2025, signaling the potential for another rebound.
The chart suggests a possible bullish reversal if the ratio breaks above the descending resistance line. Historically, descending wedges often signal bullish reversals following extended downtrends. If platinum begins to outperform silver from here, it would mark a structural shift and open the door to significant upside in the ratio.
Conclusion: Silver Leads Structural Rotation as Platinum Nears Potential Reversal
Silver has confirmed a major breakout after years of compression beneath a rigid resistance zone. The move above $50 marks a structural shift in the precious metals space. With momentum accelerating, silver now enters a new phase of long-term strength supported by macro and technical alignment. Price action above $79 confirms strong buying interest and signals that silver is reclaiming its role as a leading hard asset.
Meanwhile, platinum continues to lag but shows early signs of a potential bottom. The descending wedge pattern in the platinum-to-silver ratio suggests a reversal may be approaching. If this breakout occurs, it could signal renewed interest in platinum and shift the balance within the metals complex. Historically, reversals from long-term wedge structures have led to extended periods of relative outperformance.
These trends highlight a broader rotation unfolding. Silver leads with explosive momentum and strong macro tailwinds. Platinum remains undervalued but technically primed for recovery. This dual setup positions the precious metals sector for a dynamic phase ahead, driven by both breakout strength and catch-up potential.
Gold Predictors Premium Membership
Get exclusive short-term and swing trade ideas with precise entry levels, stop-loss, and target prices, including justification and analysis — all delivered directly via WhatsApp.
Our premium service includes deep technical analysis on gold and silver markets. We cover cycle analysis, price forecasting, and key timing levels.
Members also receive a weekly market letter with detailed analysis, commentary from our Chief Analyst, including actionable insights, trade timing, and direction forecasts for gold and silver.
Stay ahead of the market — join our premium community today.


