


Gold Structural Breakout Signals New Long-Term Bull Phase
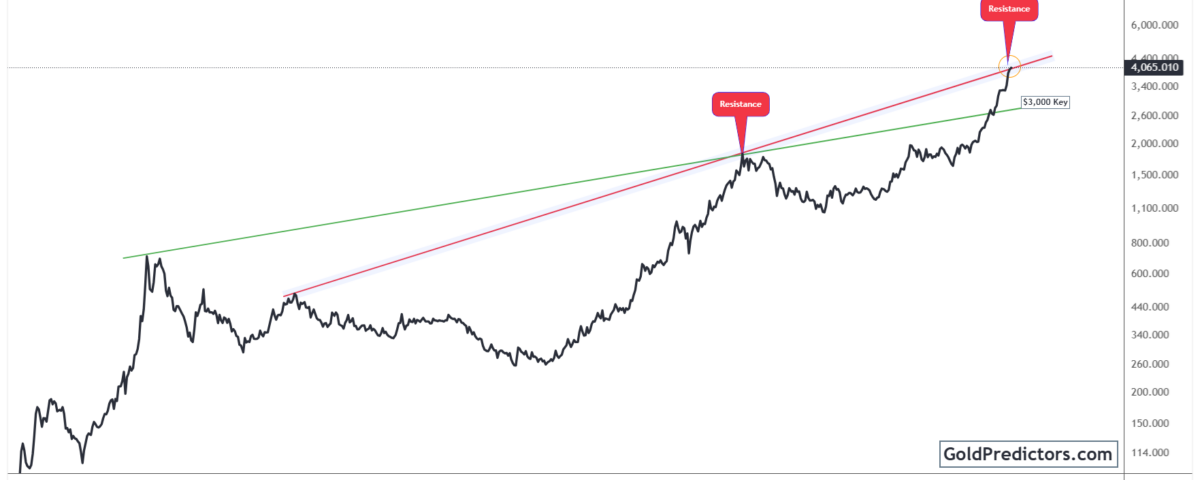
Gold (XAUUSD) has surged above a long-standing resistance, breaking the green trendline that capped its upside since 1980. This move marked a key turning point as the price accelerated beyond a structural ceiling. The breakout ends decades of compression and signals a major shift in gold’s long-term direction.
At the same time, the breakout in the gold-to-CPI ratio confirms a real increase in purchasing power, adding further weight to the bullish setup. Gold has recently approached the red resistance line drawn from two key historical highs. The focus now turns to whether this level will cap the rally or clear the way for further gains.
Gold Breaks Multi-Decade Trendline as Red Resistance Comes Into Play
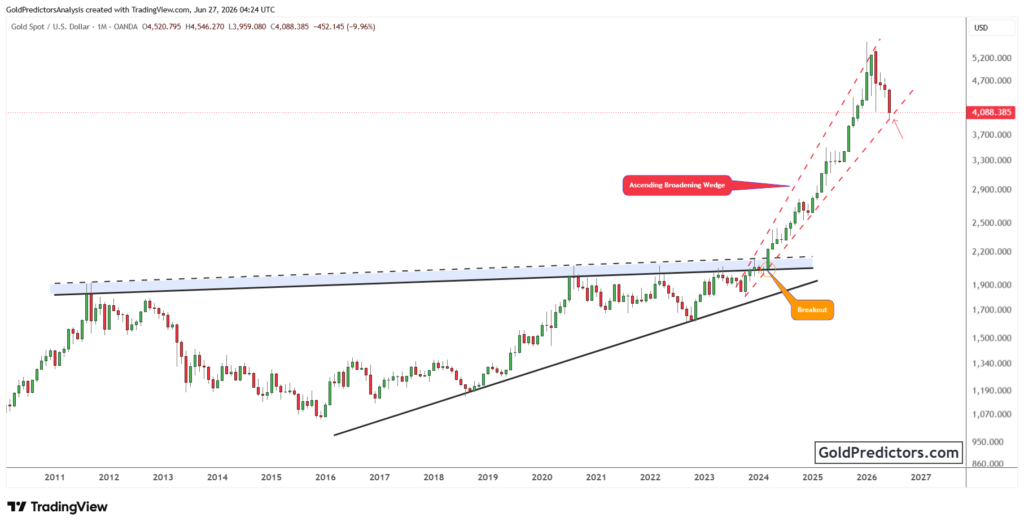
The gold chart below shows a decisive breakout above the long-term green resistance line. This trendline stretches from the 1980s high to the breakout zone where gold finally cleared multi-decade resistance. It had limited upward progress for an extended period.
The breakout occurred as gold broke through a major ceiling that had capped its upside for decades. It is now testing the red resistance line, which connects two major historical peaks and remains a key barrier in the current move.
Historically, this red trendline has served as a dominant resistance level. Gold failed to close above it during the 2011 rally and then entered a prolonged decline. The trendline connects two major peaks and has consistently acted as an upper boundary in gold’s structural setup. While price has returned to this level, a clean breakout has yet to occur. This level remains a major technical barrier that may shape the next phase of gold’s long-term trend.
Gold has now broken decisively above the green trendline, clearing a structural barrier that capped its upside for decades. This breakout marks the end of a prolonged compression phase and opens the way for a broader revaluation. As long as the price holds above this former resistance, the long-term outlook remains bullish. Attention now turns to the red resistance line, which has consistently acted as an upper boundary. A confirmed break above that level could mark the start of a powerful new phase in gold’s long-term trend.
Gold-to-CPI Ratio Breaks Long-Term Ceiling, Validates Real Purchasing Power Surge
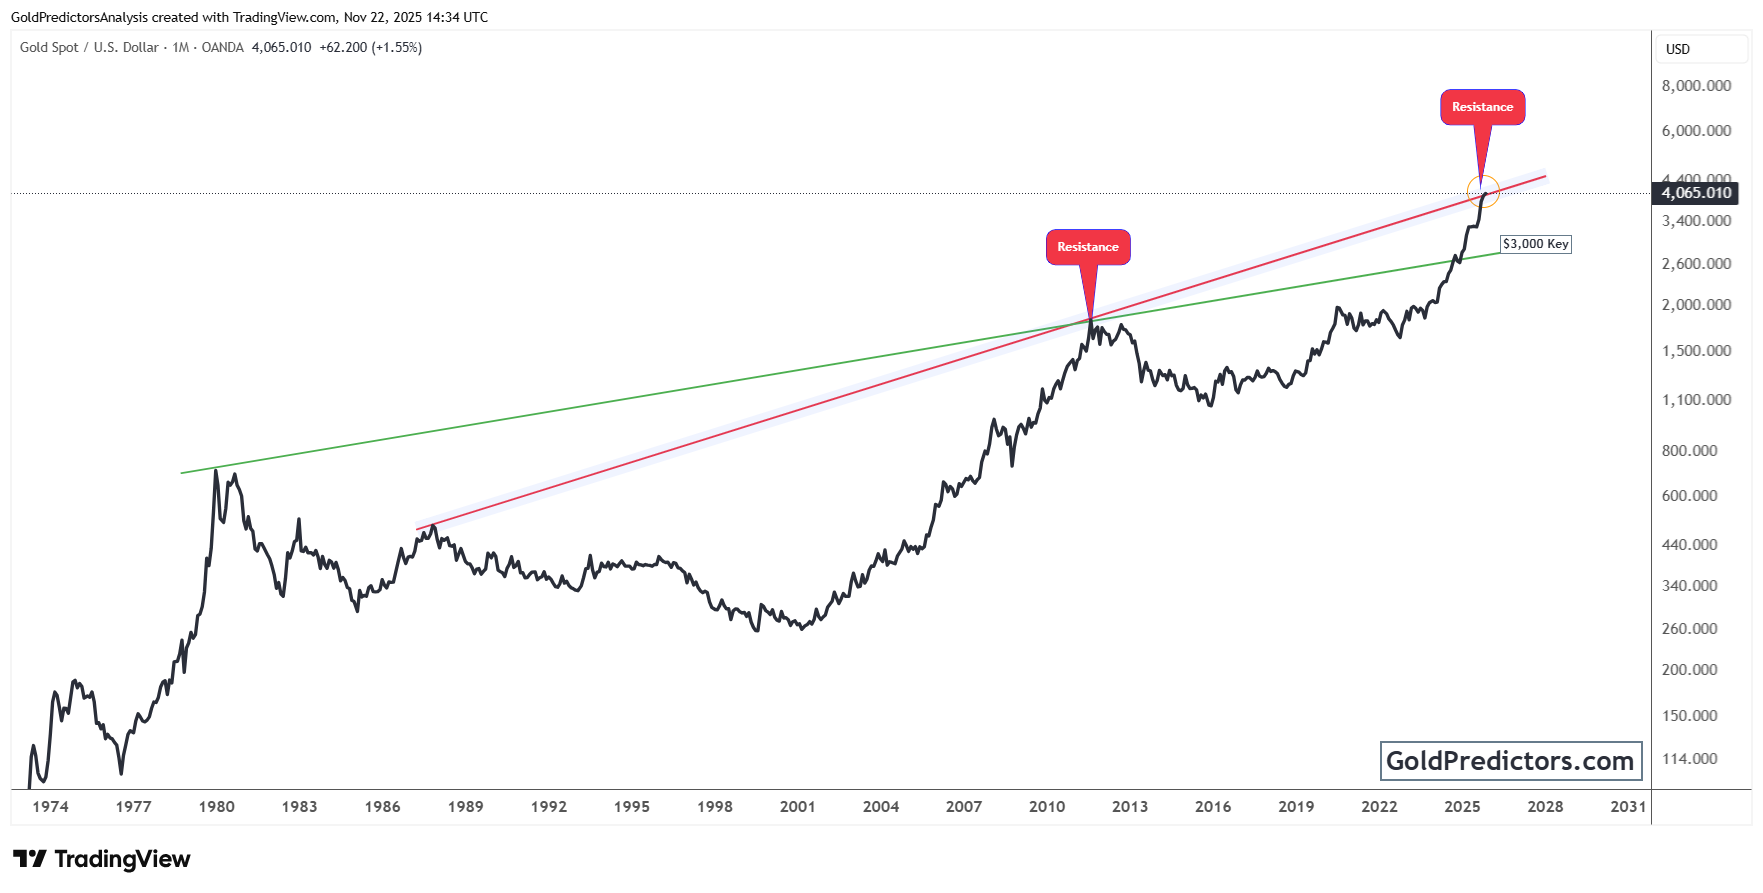
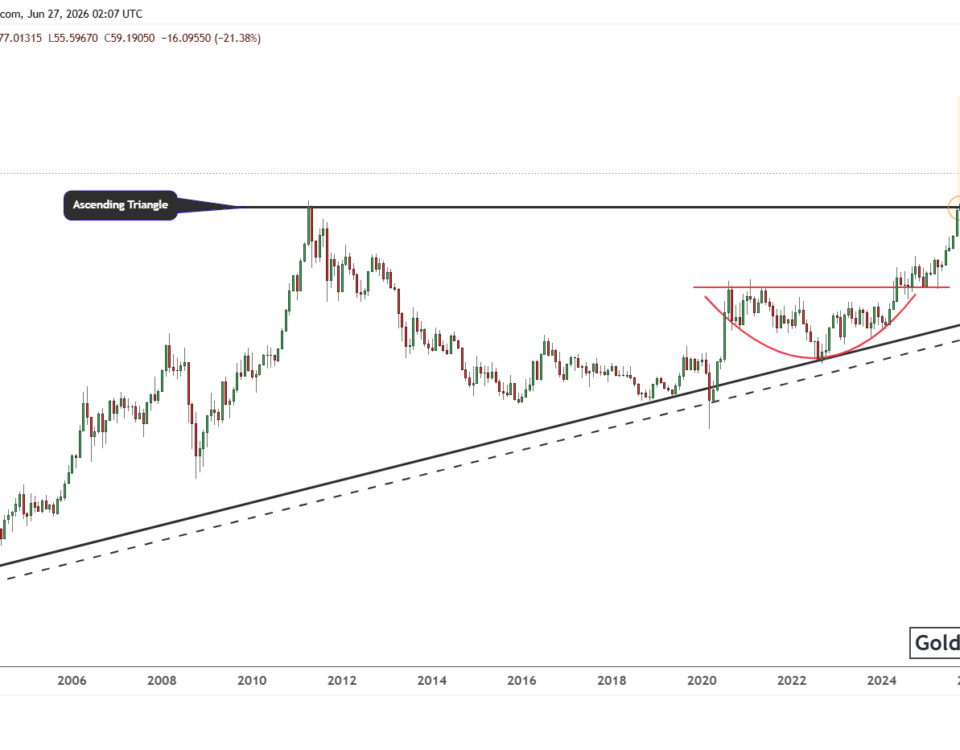
The chart below illustrates gold’s performance relative to the U.S. Consumer Price Index (CPI), providing a long-term perspective on its inflation-adjusted purchasing power. Historically, this ratio peaked during the inflation spike of the early 1980s, creating a well-defined resistance zone that has remained in place for decades. For more than forty years, this zone has acted as a structural ceiling, limiting the upside in gold’s real value.
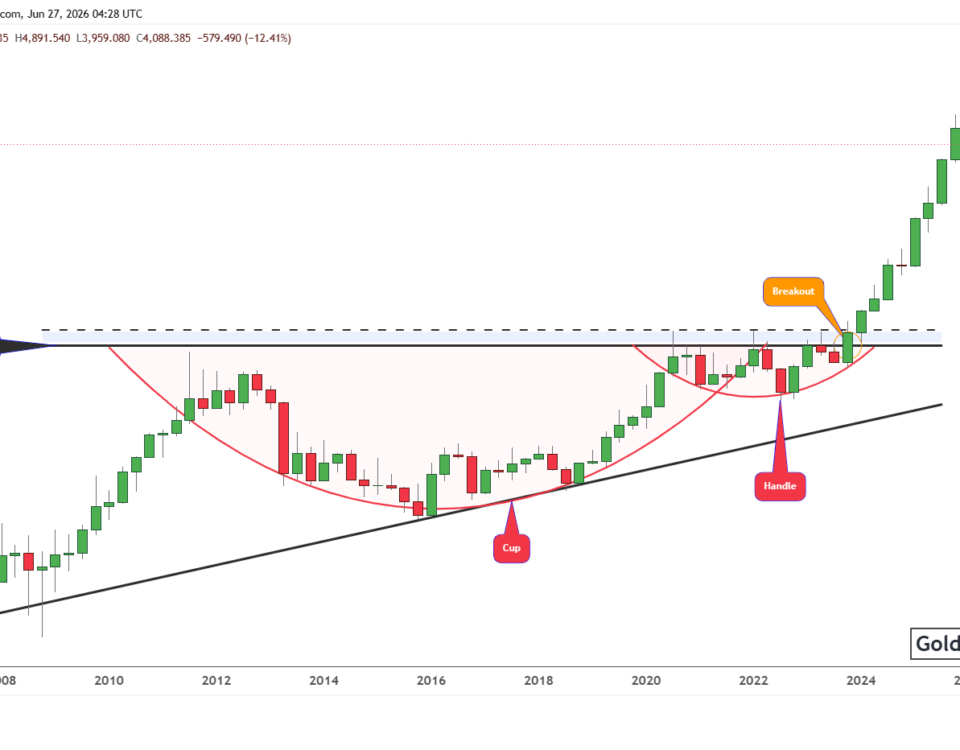
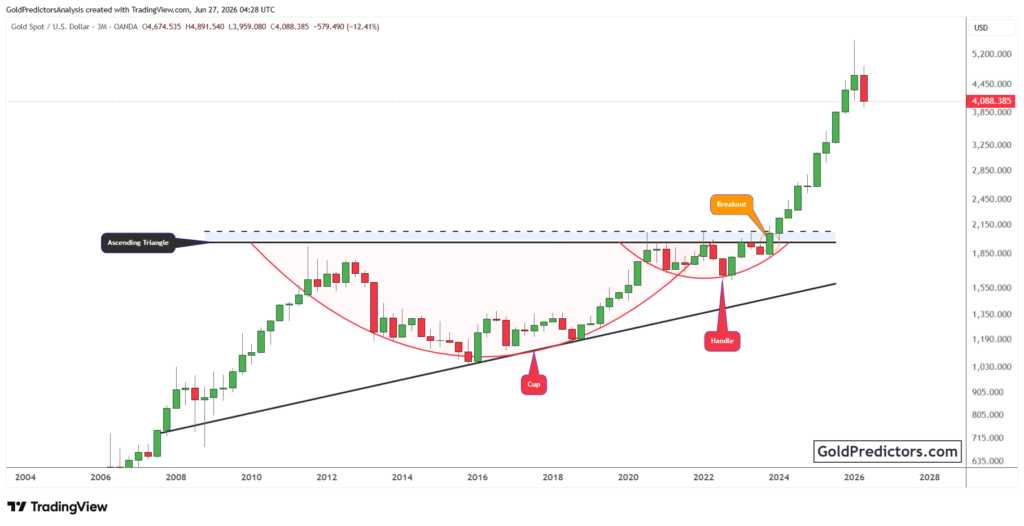
In 2024, the gold-to-CPI ratio finally broke above this resistance, signalling a real gain in gold’s value relative to inflation. This move followed the completion of a massive cup-and-handle formation that had been developing since the 1980 peak. After decades of compression, the pattern resolved to the upside, suggesting a structural shift in the metal’s long-term valuation.
Eventually, the breakout from the handle zone occurred near a long-standing resistance that had previously capped gold’s rallies during major peaks in past cycles. However, the ratio moved decisively above that barrier, confirming a clear shift in trend.
The move indicates that gold is not only rising in nominal terms but also gaining real value in relation to inflation. This breakout on the inflation-adjusted chart supports the broader bullish outlook. It signals that the current rally reflects deep macroeconomic imbalances rather than short-term positioning.
Conclusion: Gold Confirms Structural Breakout with Real Gains in Purchasing Power
Gold has entered a decisive new phase after breaking above a key resistance level that held for decades. The move beyond the green trendline marks the end of a decades-long consolidation and signals a significant structural shift. As long as price holds above this former ceiling, the path remains open for continued long-term upside. A sustained break above the red trendline could trigger the next phase of acceleration in gold’s long-term uptrend.
At the same time, the inflation-adjusted chart strengthens the bullish case. Gold’s breakout above the long-standing CPI resistance confirms a real increase in purchasing power. A cup-and-handle formation that developed over nearly forty years now adds significant weight to the current breakout. This breakout suggests that gold is not simply rising with nominal inflation but is undergoing a deeper revaluation against broader economic forces.
Overall, these developments indicate a significant reallocation of capital, with gold emerging as a preferred hedge in an era of increasing macroeconomic stress. The nominal and inflation-adjusted breakouts reflect rising demand for real assets amid growing economic instability. With gold trading at levels not seen in decades, its role as a reliable store of value has gained renewed strength. This breakout marks a critical moment for those seeking durable positioning within an increasingly unstable global system.
Gold Predictors Premium Membership
Get exclusive short-term and swing trade ideas with precise entry levels, stop-loss, and target prices, including justification and analysis — all delivered directly via WhatsApp.
Our premium service includes deep technical analysis on gold and silver markets. We cover cycle analysis, price forecasting, and key timing levels.
Members also receive a weekly market letter with detailed analysis, commentary from our Chief Analyst, including actionable insights, trade timing, and direction forecasts for gold and silver.
Stay ahead of the market — join our premium community today.