


Silver Breakout 2025: Price Eyes $50 and Beyond
Silver shows strong signs of a major breakout in 2025. Technical patterns and historical price action support a bullish outlook. The metal has surged above long-standing resistance levels. The price action reveals a structure similar to that of previous rallies, which led to sharp gains. This article explores key breakout points, analyzes technical signals, and outlines potential future price targets based on long-term and historical trends.
Silver Breakout above $30 Signals Potential Surge toward $50 in 2025
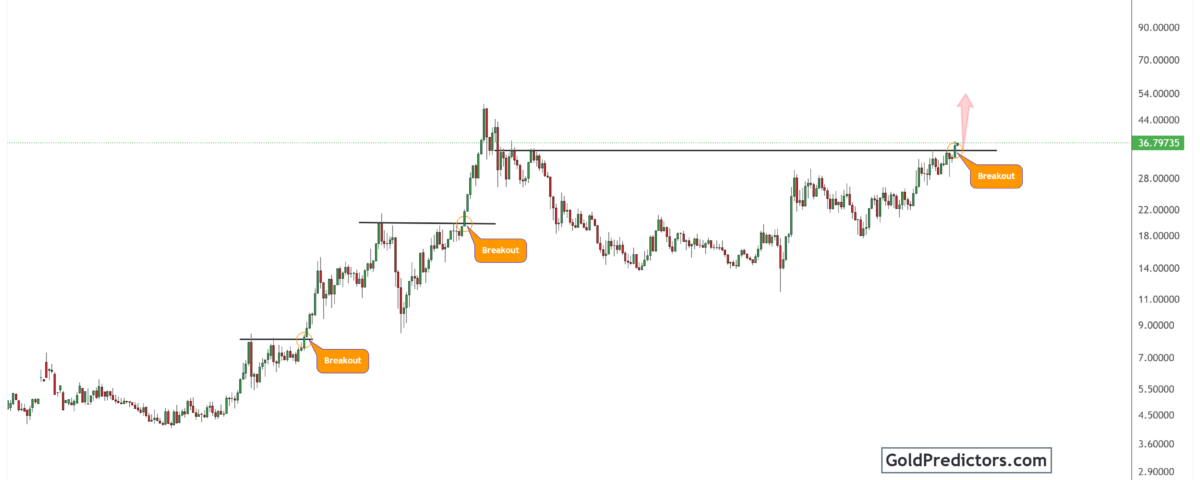
The silver chart below shows price action from 1997 to 2025, highlighting three significant breakout points that marked the beginning of major bullish trends. The first breakout occurred around 2005, pushing silver from below $10 to over $20 in a few years. The second breakout, in 2010, led to a sharp rally toward the $50 level. Now, in 2025, silver has once again broken through a critical resistance level near $30, suggesting a new bullish wave is underway.
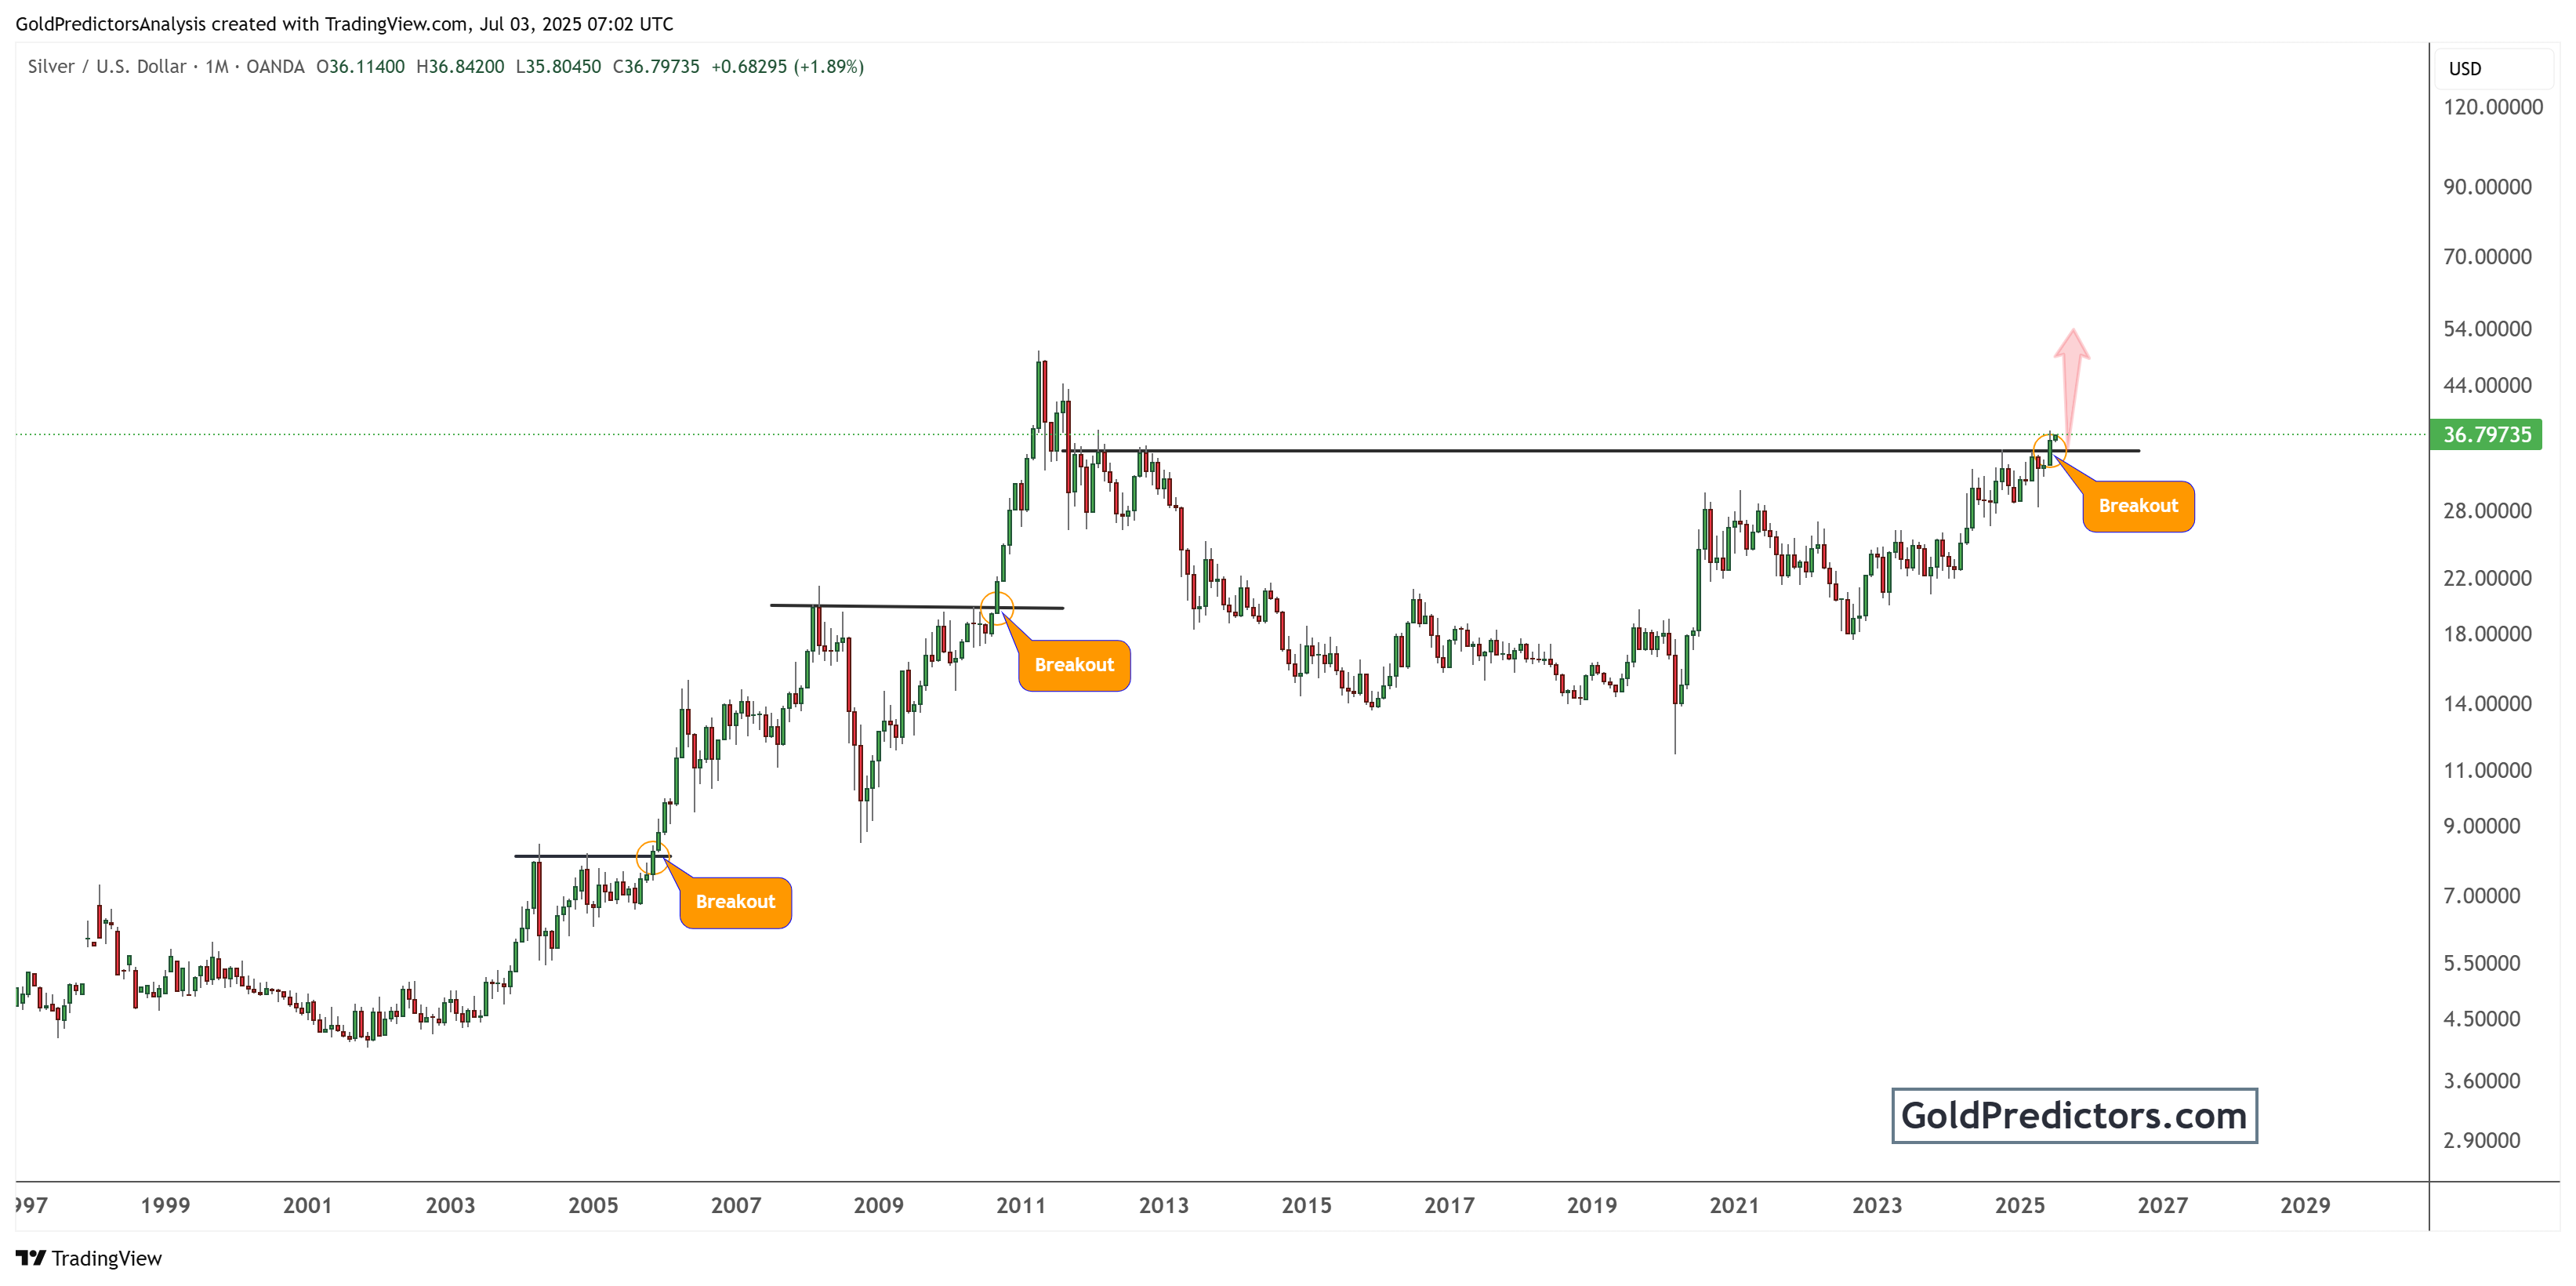
This recent breakout is significant because it mirrors historical price behaviours that led to substantial gains. The chart displays a clear horizontal resistance line that has been repeatedly tested over the years. After years of sideways movement and base formation, silver finally pierced through this resistance, confirming a bullish breakout. The highlighted arrow in the chart points toward a target above $50. This suggests the potential for a significant upward move in the coming months or years.
Technically, the breakout has formed after a well-structured ascending triangle pattern, which is a classic bullish continuation signal. Volume confirmation and long candle bodies add strength to the breakout argument. If silver holds above the $30 level, it may act as a new support base for further upward momentum.
Historic Silver Breakouts in 2020 and 2025 Set the Stage for a Bullish Run to $100
The chart below shows a broader historical perspective, tracing silver prices from 1977 to 2031. It highlights the massive breakout that occurred in the early 2000s when silver broke a two-decade-long downtrend line. This breakout resulted in a powerful rally toward $50. The chart now shows two additional breakout formations from recent years: one in 2020 and another in 2025.
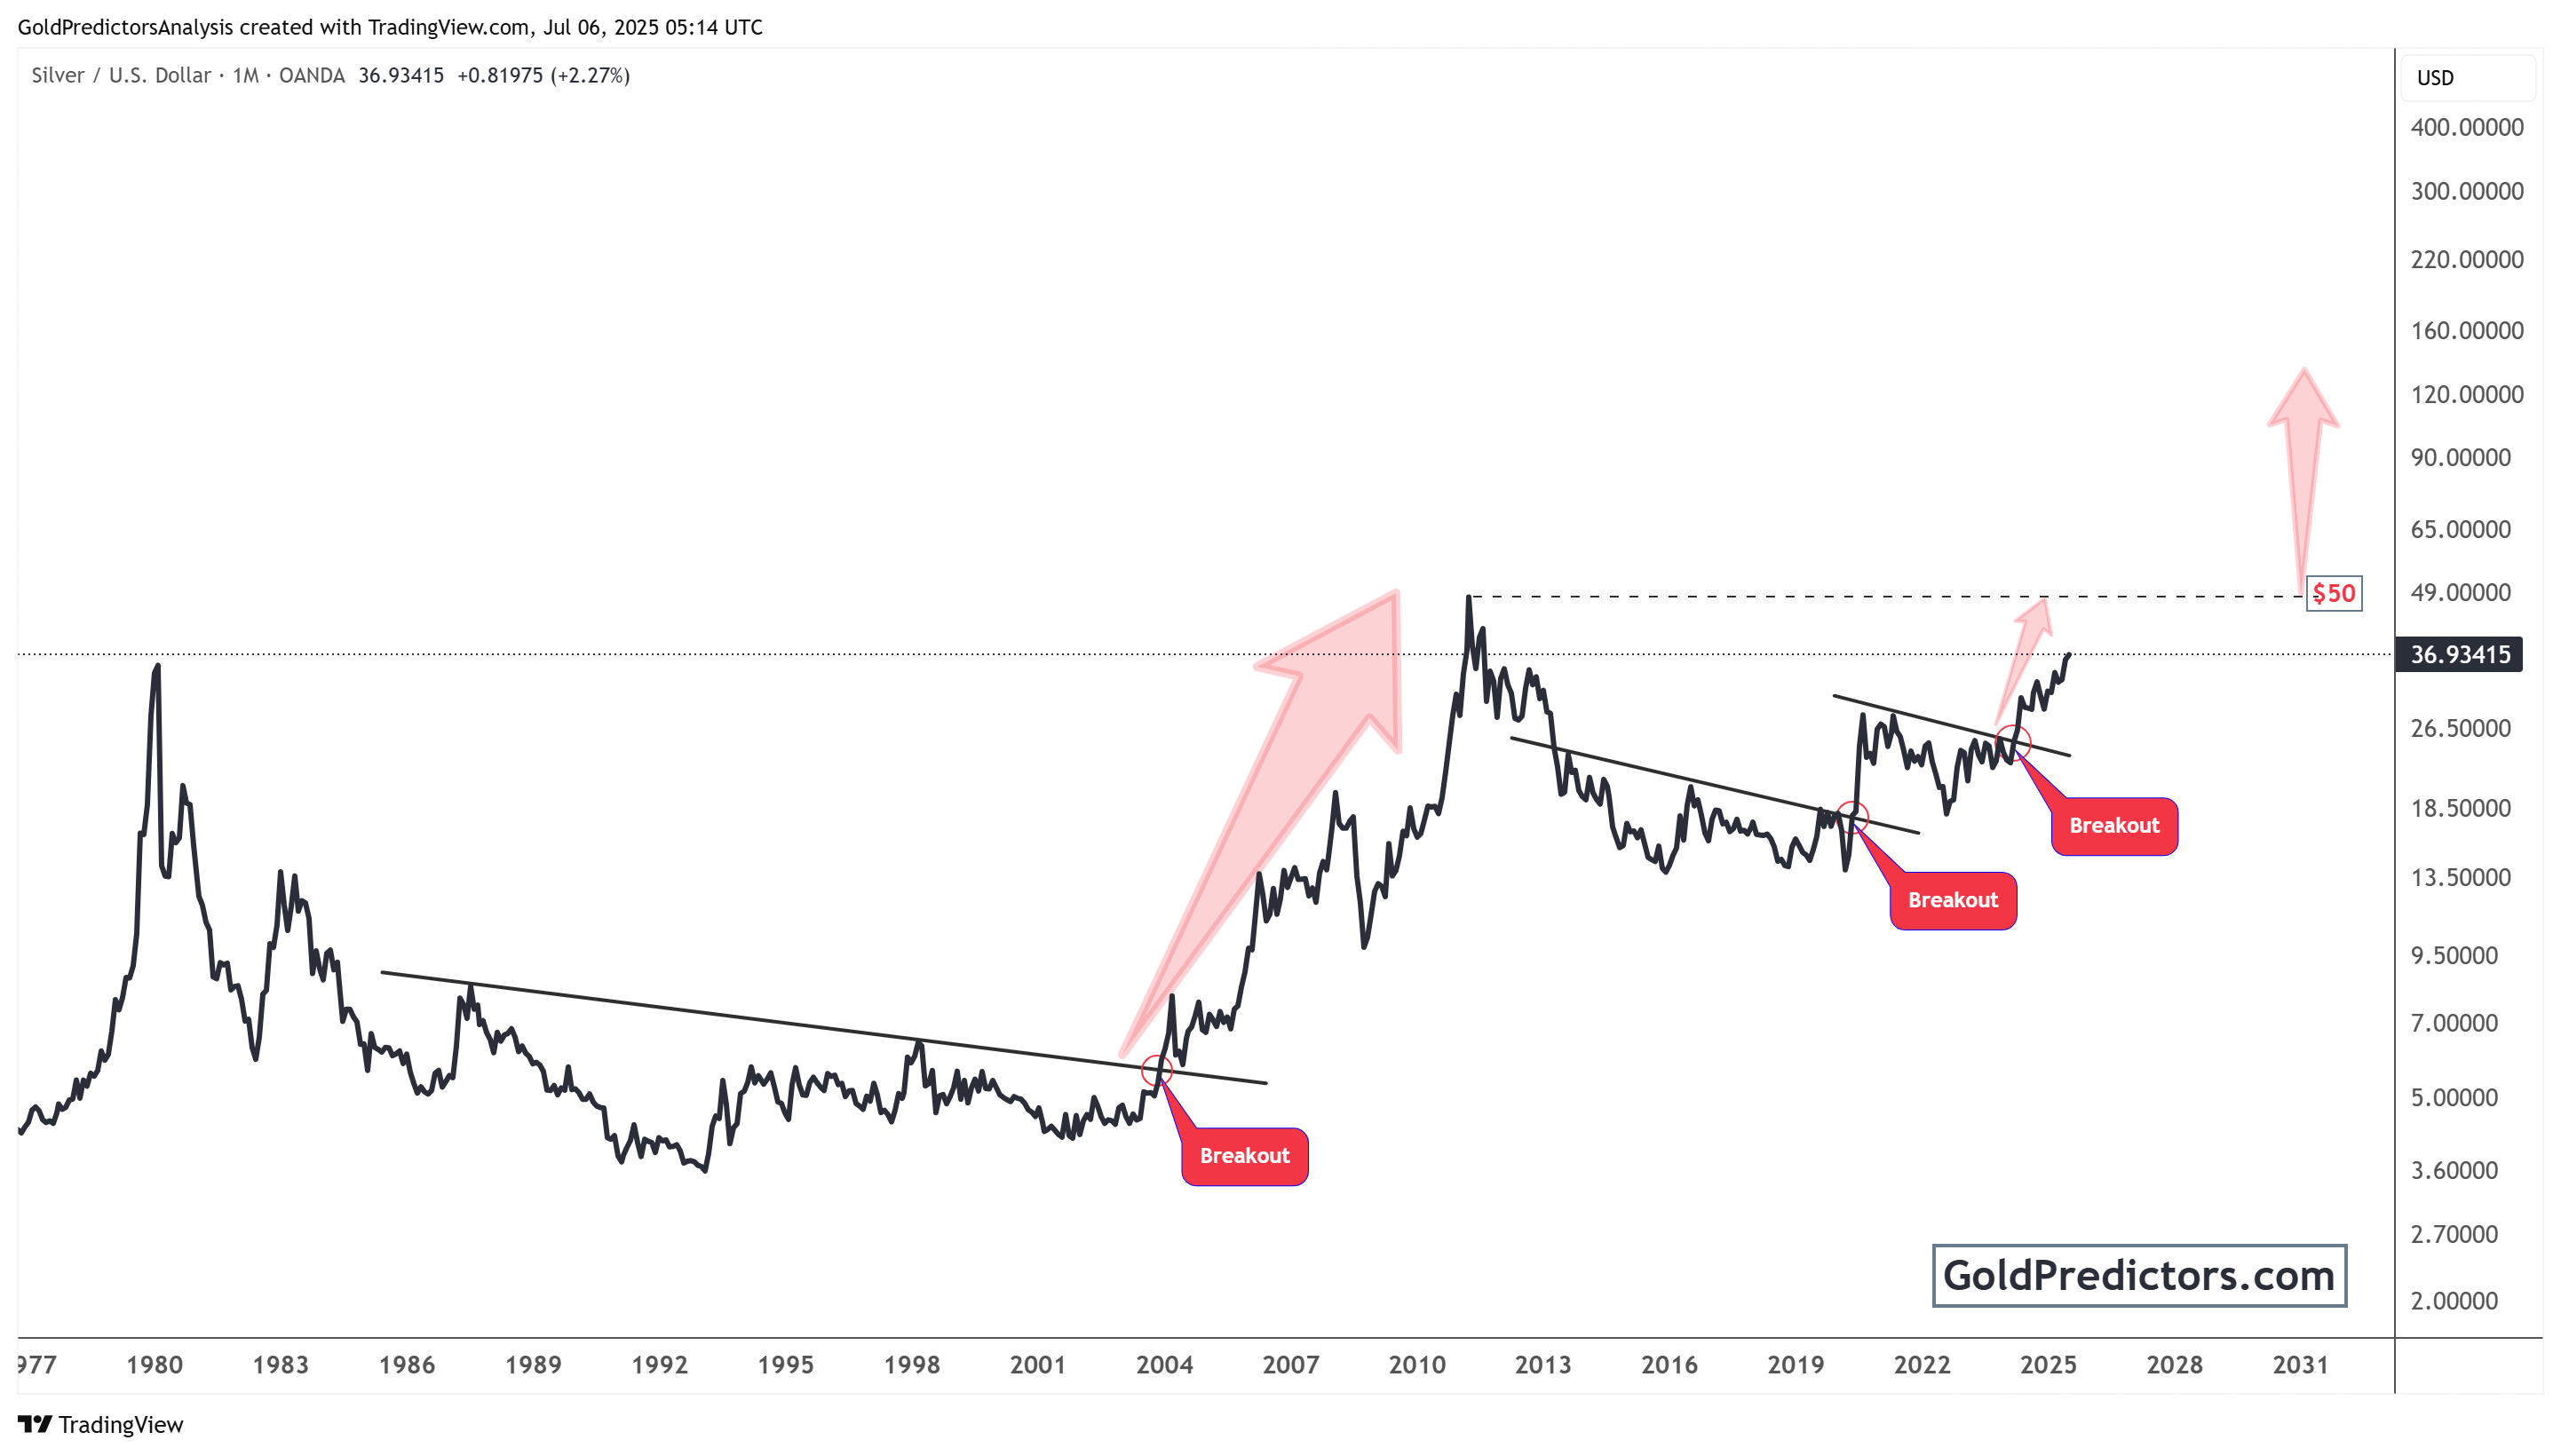
The 2020 breakout cleared a downward sloping resistance line. The 2025 breakout occurred at horizontal resistance, once again around $30. The combination of these breakout points creates a strong bullish structure. The projected arrows in the chart suggest the price could easily surpass $50. It may then head toward higher untested levels, possibly around $100 and higher, depending on market momentum and macroeconomic catalysts.
The chart also highlights the psychological resistance level near $50, which has previously acted as a ceiling. However, the multiple breakouts and the tightening pattern indicate that the price may not stay below this level for long. A monthly or quarterly close above $50 could signal the start of a super cycle in silver, similar to what occurred in 2010-2011.
Conclusion: 2025 Breakout Could Trigger Long-Term Bull Market
Silver’s recent breakout above the $30 resistance level signals the beginning of a potentially powerful bullish cycle. The price has followed a well-defined technical pattern, supported by historical breakouts that led to sharp upward moves. Investors now have strong confirmation from long-term and historical charts that silver is building momentum for higher levels.
The $50 level remains a critical psychological and technical barrier. However, past patterns suggest that once silver closes above this point, it can accelerate rapidly. The presence of multiple breakout signals in 2020 and 2025 strengthens the case for a sustained rally. If supported by global economic trends and rising demand for safe-haven assets, silver could target levels above $100 in the long run.
Traders and investors should monitor key support zones, especially around $30. Holding above this level confirms strength and maintains the bullish trend. With increasing uncertainty in global markets, silver offers safety and growth potential. The 2025 breakout may be the start of a historic move, and those positioned early could benefit from the next leg of this silver super cycle.
Gold Predictors Premium Membership
Get exclusive short-term and swing trade ideas with precise entry levels, stop-loss, and target prices, including justification and analysis — all delivered directly via WhatsApp.
Our premium service includes deep technical analysis on gold and silver markets. We cover cycle analysis, price forecasting, and key timing levels.
Members also receive a weekly market letter with detailed analysis, commentary from our Chief Analyst, including actionable insights, trade timing, and direction forecasts for gold and silver.
Stay ahead of the market — join our premium community today.


