


Gold Breakout Signals Long-Term Bull Market as Silver Prepares to Follow
Gold has broken out of a long-term inverted head and shoulders pattern within the ascending channel, signaling a significant shift in its long-term trend. This breakout marks the end of years of consolidation and sets the stage for new highs, with targets exceeding $4,000 and long-term potential reaching $6,000 and $8,000. Moreover, the gold-to-silver ratio suggests a potential silver rally, as historical peaks in the ratio have often marked silver bottoms. With both metals showing strong technical setups, the precious metals market may be entering a new structural bull phase.
Gold Breakout Confirms Long-Term Bullish Trend toward $6,000
The gold chart below shows a decades-long ascending channel, dating back to the early 1990s. For over 30 years, gold has moved within this well-defined channel, respecting both the upper and lower boundaries. During this period, major macroeconomic events, including the 2008 financial crisis, the COVID-19 pandemic, and persistent inflation, have triggered sharp rallies. These rallies occurred within the long-term ascending range.
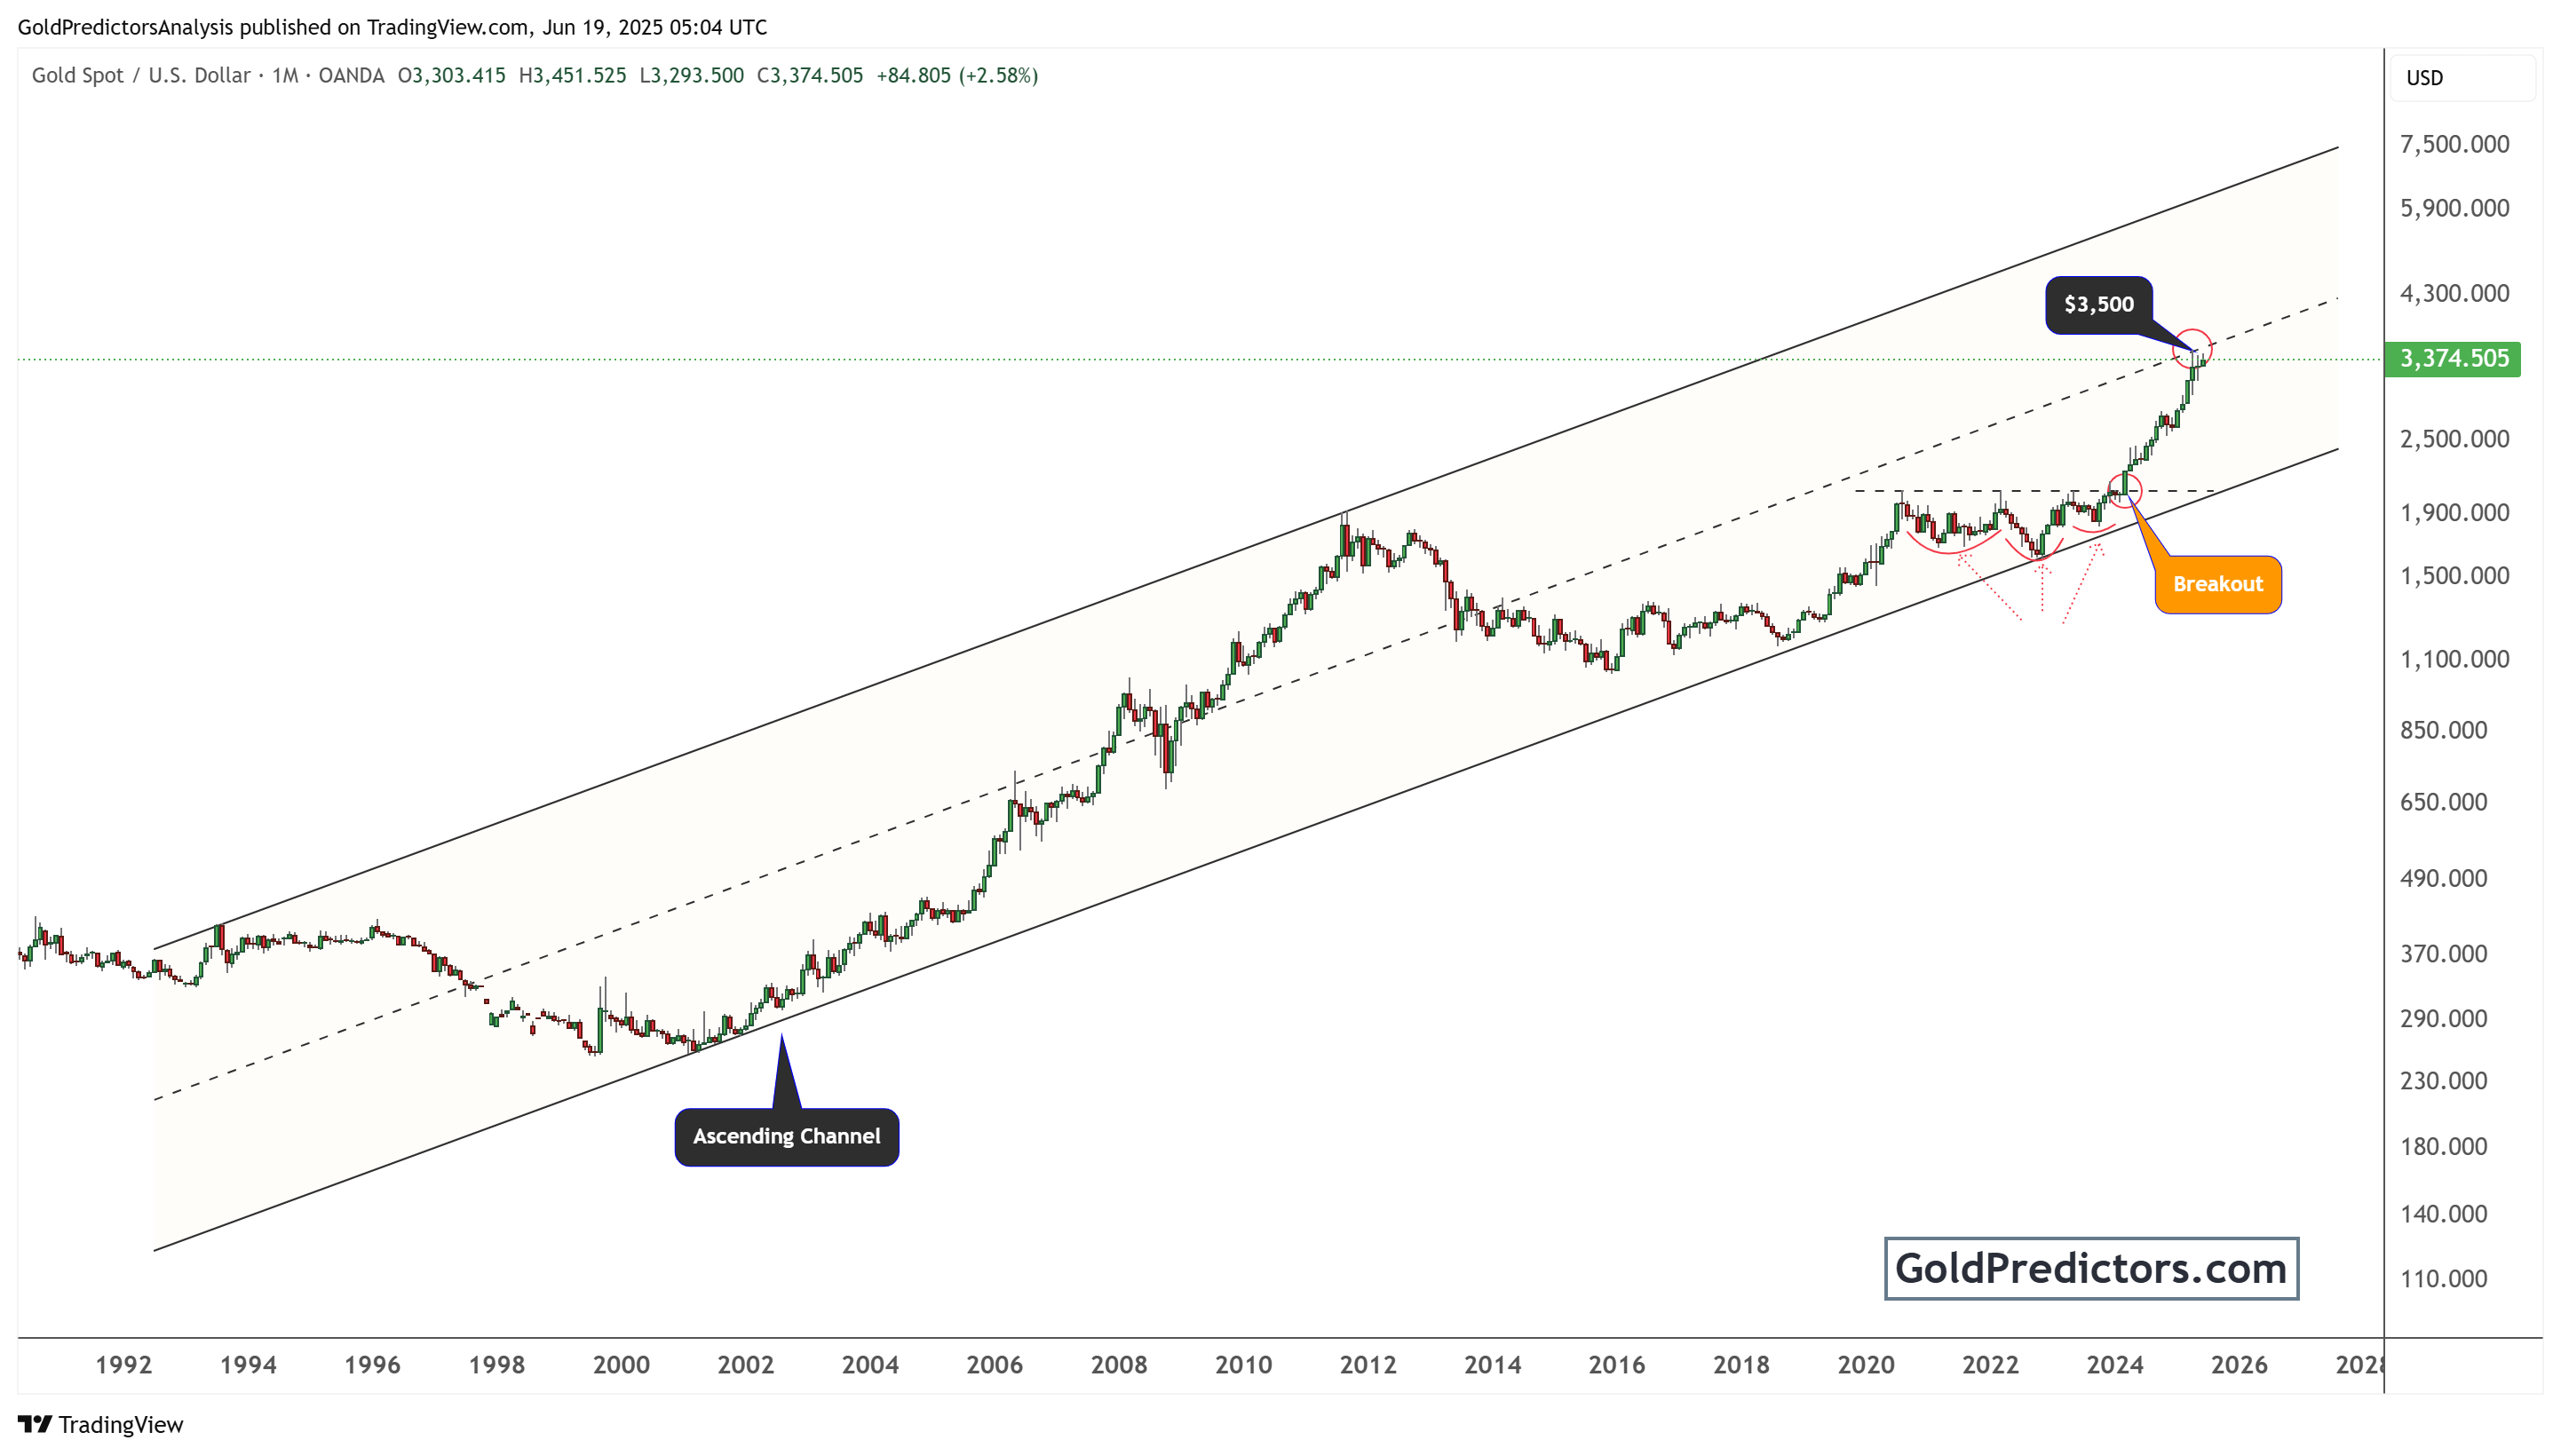
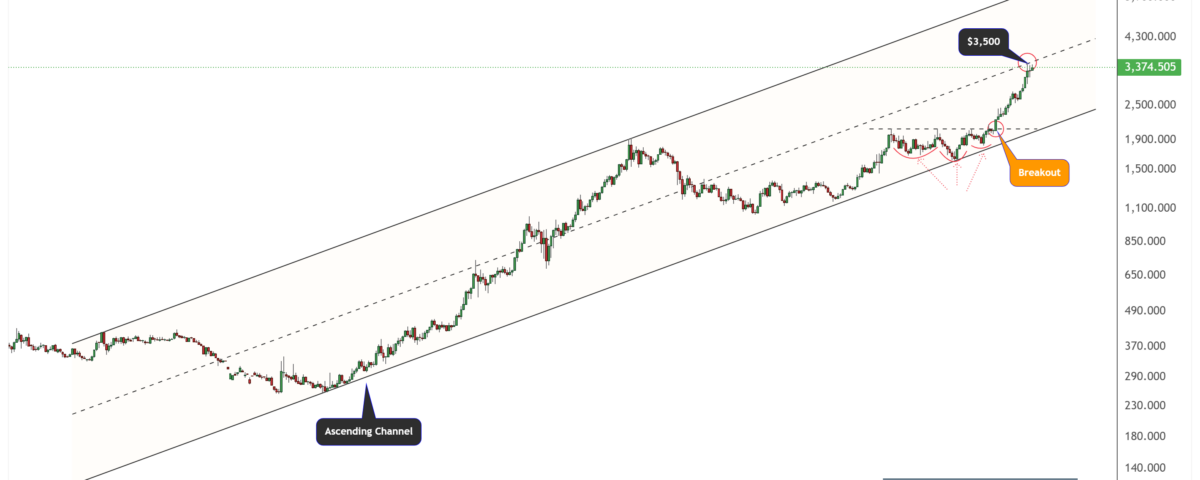
Recently, gold broke out of this channel with force. The breakout occurred after the formation of an inverse head-and-shoulders pattern, visible during the 2020–2023 period. This classic bullish reversal pattern signals a significant shift in the underlying trend. The neckline of this pattern was around the $2,000–$2,100 level. After breaching this resistance, gold surged rapidly and currently trades above $3,300.
This breakout is technically significant. Not only does it mark the end of a long consolidation phase, but it also initiates a potential new wave of price discovery. The upper parallel channel target lies around $6,000 to $8,000 zone. The first significant psychological resistance is around $3,500, a level gold has already tested. This resistance is calculated from the midline of this channel. A break above $3,500 will open the door for a surge in gold prices towards $6,000 and $8,000 zones in the coming years.
Gold-to-Silver Ratio Signals Imminent Silver Rally
The chart below shows another compelling signal in the gold-to-silver ratio (XAU/XAG). Historically, peaks in this ratio coincide with silver bottoms. The chart shows three distinct ratio tops, marked with “Silver Bottom” labels in 2008, 2020, and 2025. After each peak, silver entered an intense upward phase while the ratio declined.
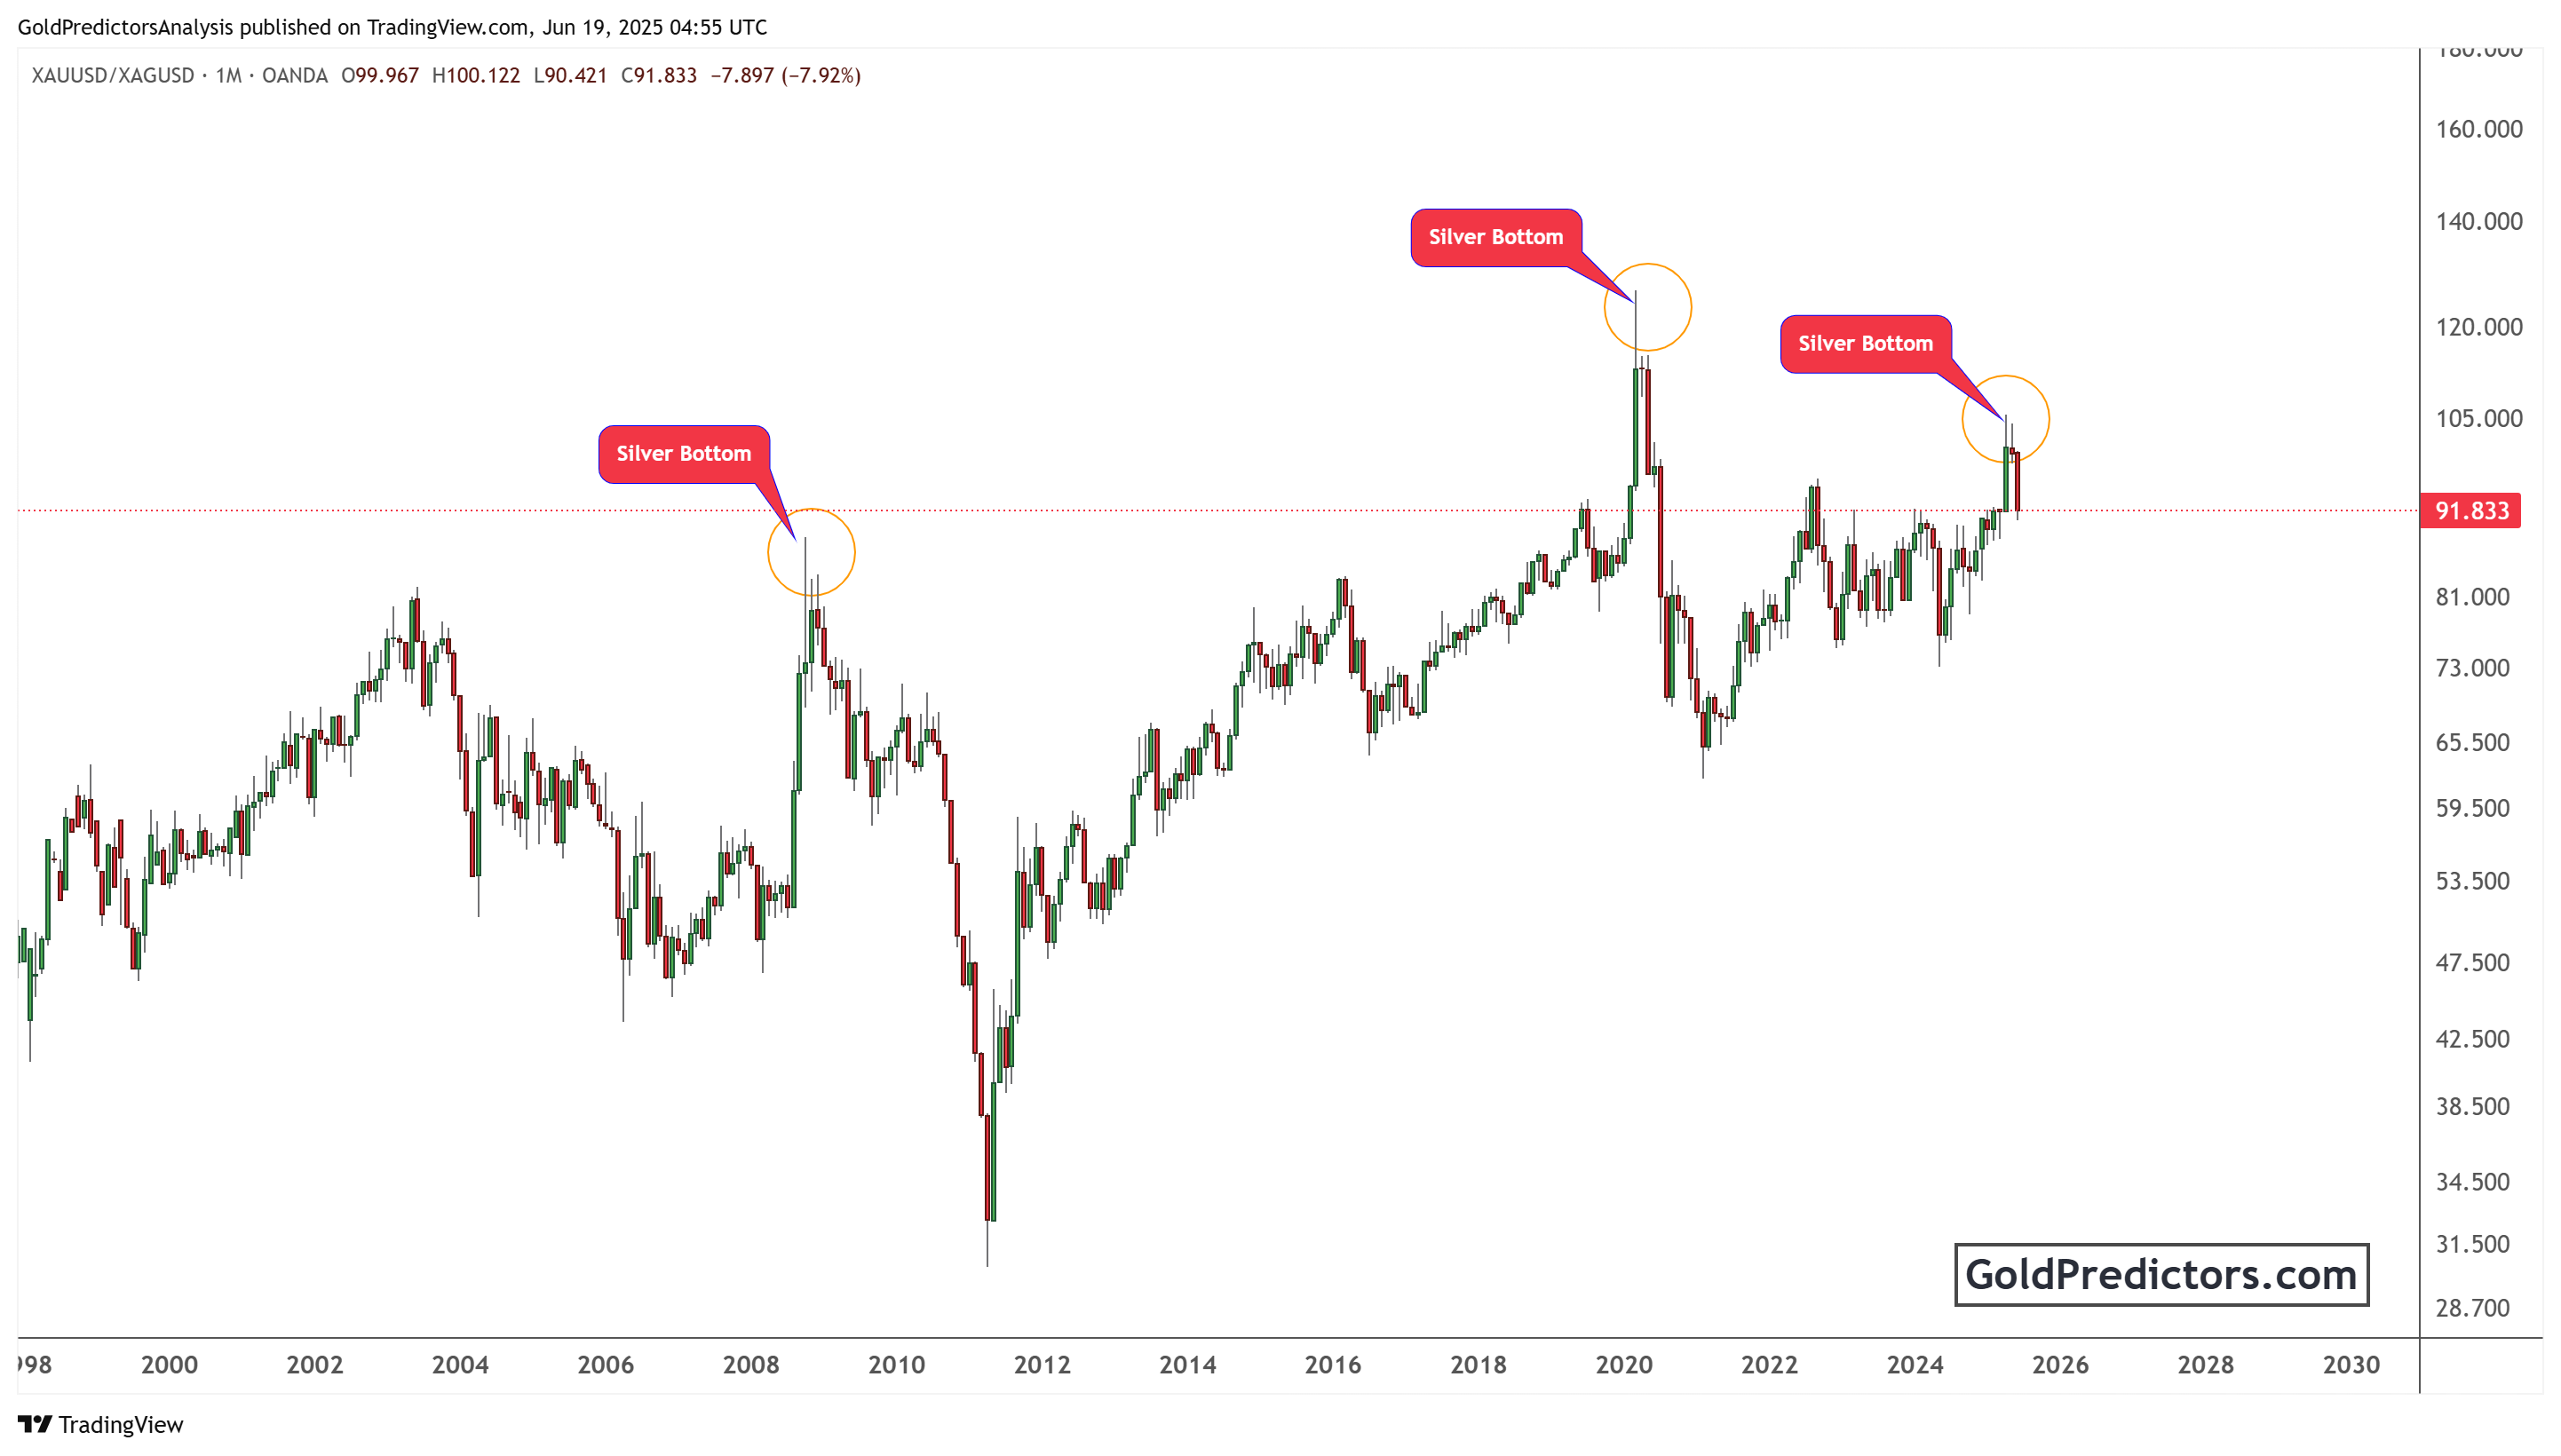
Currently, the ratio stands at 92, after peaking just above 100. This level aligns with prior turning points, suggesting that silver could soon begin outperforming gold. Historically, when the gold-to-silver ratio reverses from extreme highs, silver enters explosive rallies. This pattern could repeat in the current cycle.
The implication is clear. While gold leads the breakout, silver may follow with more aggressive percentage gains. As the market adjusts for inflation and monetary instability, investors may increasingly turn to silver, which remains undervalued relative to gold.
Conclusion: Gold and Silver Poised for Long-Term Gains
The long-term technical outlook for gold and silver has shifted decisively to the bullish side. Gold’s breakout from an inverted head and shoulders within the ascending channel marks a historic move. This breakout suggests a new macro bull cycle with price targets above $4,000. On the other hand, silver appears to be initiating a price surge to $50.
This combination signals a strong case for investing in precious metals. As inflation, debt, and geopolitical instability rise, demand for safe havens is likely to increase. Gold is now in price discovery mode, while silver offers high upside potential from current levels.
Investors and traders should closely watch both metals. Gold offers stability and long-term value, while silver presents an opportunity for high-return speculation. With both metals aligning technically and fundamentally, the next phase in the precious metals bull market may be just beginning. The gold price is trading below $3,500 due to strong resistance from the mid-level of the channel. A break above $3,500 could push prices to new highs.
Gold Predictors Premium Membership
Get exclusive short-term and swing trade ideas with precise entry levels, stop-loss, and target prices, including justification and analysis — all delivered directly via WhatsApp.
Our premium service includes deep technical analysis on gold and silver markets. We cover cycle analysis, price forecasting, and key timing levels.
Members also receive a weekly market letter with detailed analysis, commentary from our Chief Analyst, including actionable insights, trade timing, and direction forecasts for gold and silver.
Stay ahead of the market — join our premium community today.


