


Gold Breaks Multi-Decade Resistance: A New Bull Market Begins
Gold (XAUUSD) has broken above a decades-old resistance line, confirming a major bullish trend. This breakout marks the end of a long consolidation phase that began after the 1980 peak. Gold now reflects strong momentum and renewed investor interest. Past breakouts led to multi-year rallies, and this move appears even more significant. It signals a new phase of price discovery and growing demand for gold as a safe-haven asset. Global instability, rising debt, and weakening confidence in fiat currencies are driving this shift. The breakout draws institutional buyers and highlights a changing financial landscape.
Gold Breaks Multi-Decade Resistance, Signals Structural Bull Market
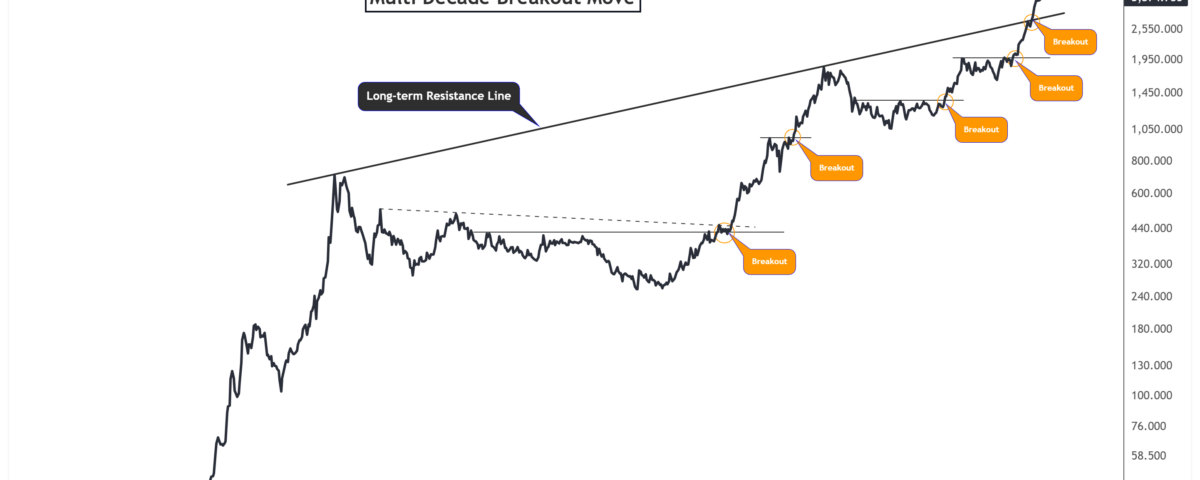
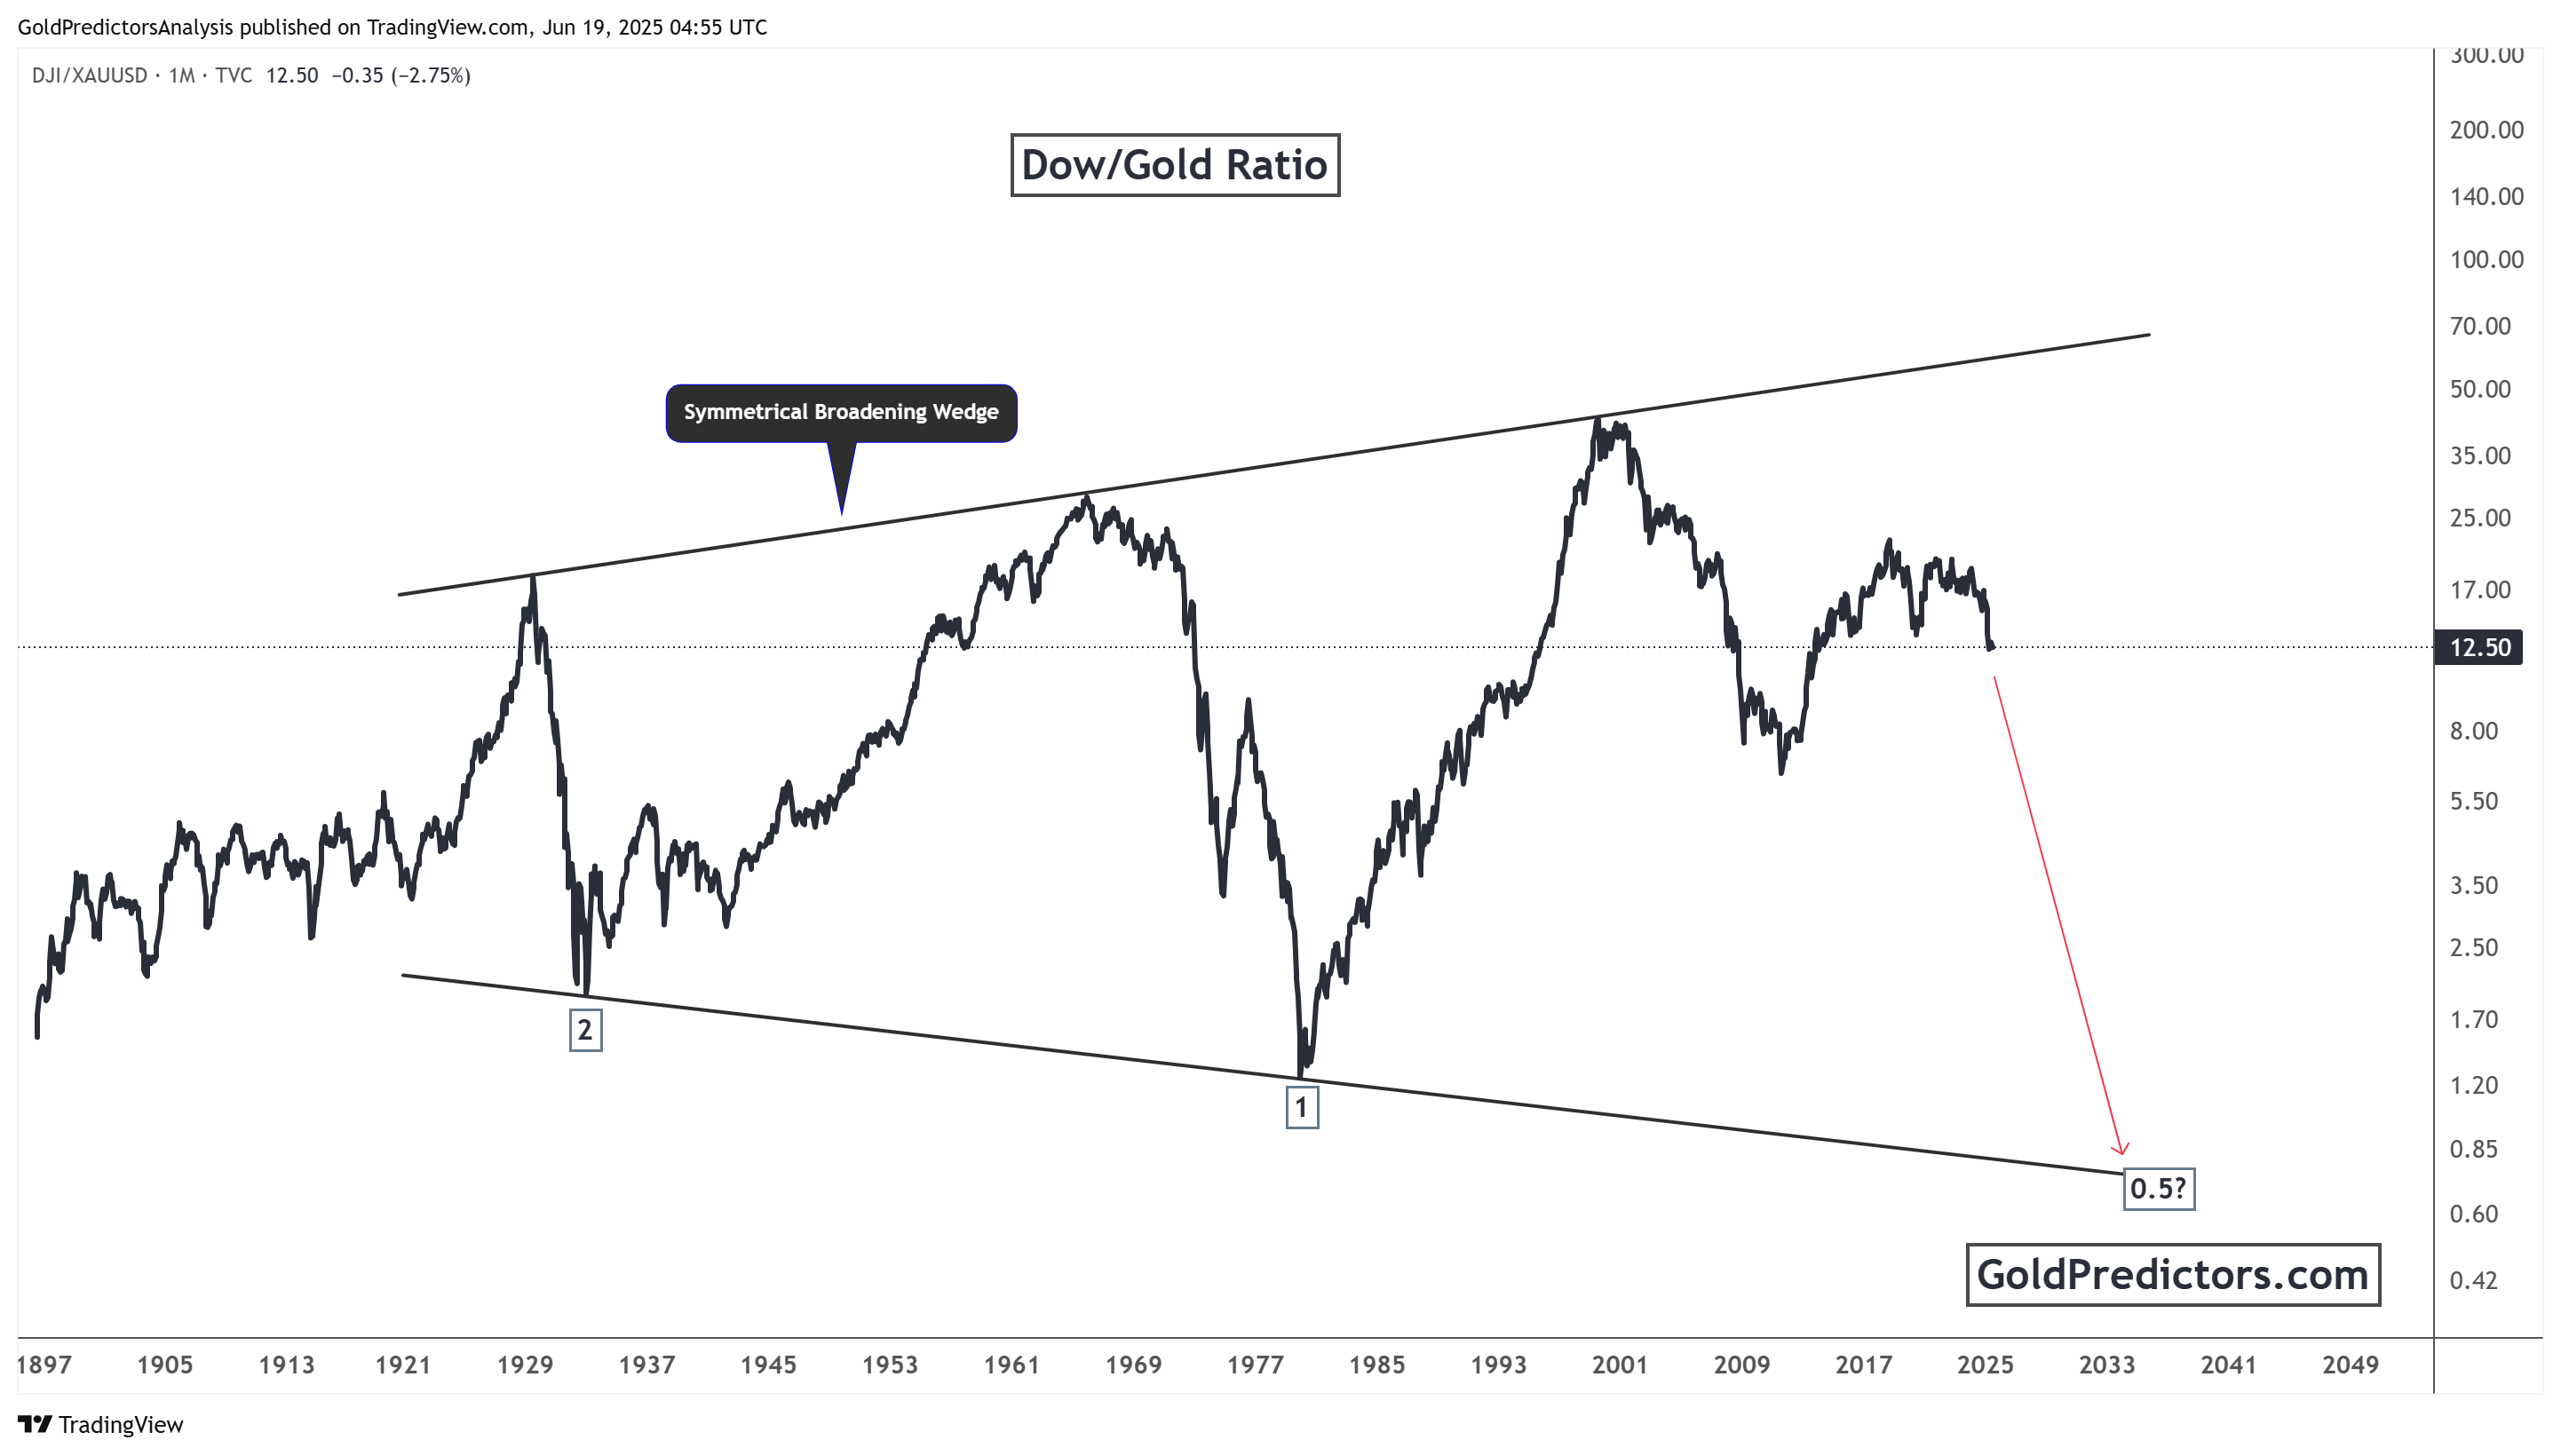
The gold chart below shows a decisive breakout above a long-term resistance line, clearly illustrating a historic shift in the metal’s price trajectory. This trendline stretches back to the 1980 peak when gold reached record highs. After decades of consolidation and multiple breakout attempts, gold has finally surged above this key resistance area, now trading above $3,000 per ounce. This move confirms a structural bull market in gold.
Historically, every breakout marked on the chart has been followed by strong upward momentum. The breakout in the early 2000s led to a multi-year rally that peaked in 2011. Another major breakout in 2019 pushed gold above $2,000 for the first time. The current breakout, which has occurred after several years of consolidation between 2011 and 2023, holds even greater significance. It completes a decades-long consolidation pattern and signals a new wave of price discovery.
The breakout above the resistance line removes a significant psychological and technical barrier. It attracts fresh buying from institutional investors, hedge funds, and central banks. The rising global geopolitical risks, including wars, economic uncertainty, and debt expansion, further support gold’s safe-haven appeal. As global confidence in traditional financial systems erodes, demand for gold strengthens.
Dow to Gold Ratio Signals Start of Major Gold Bull Cycle
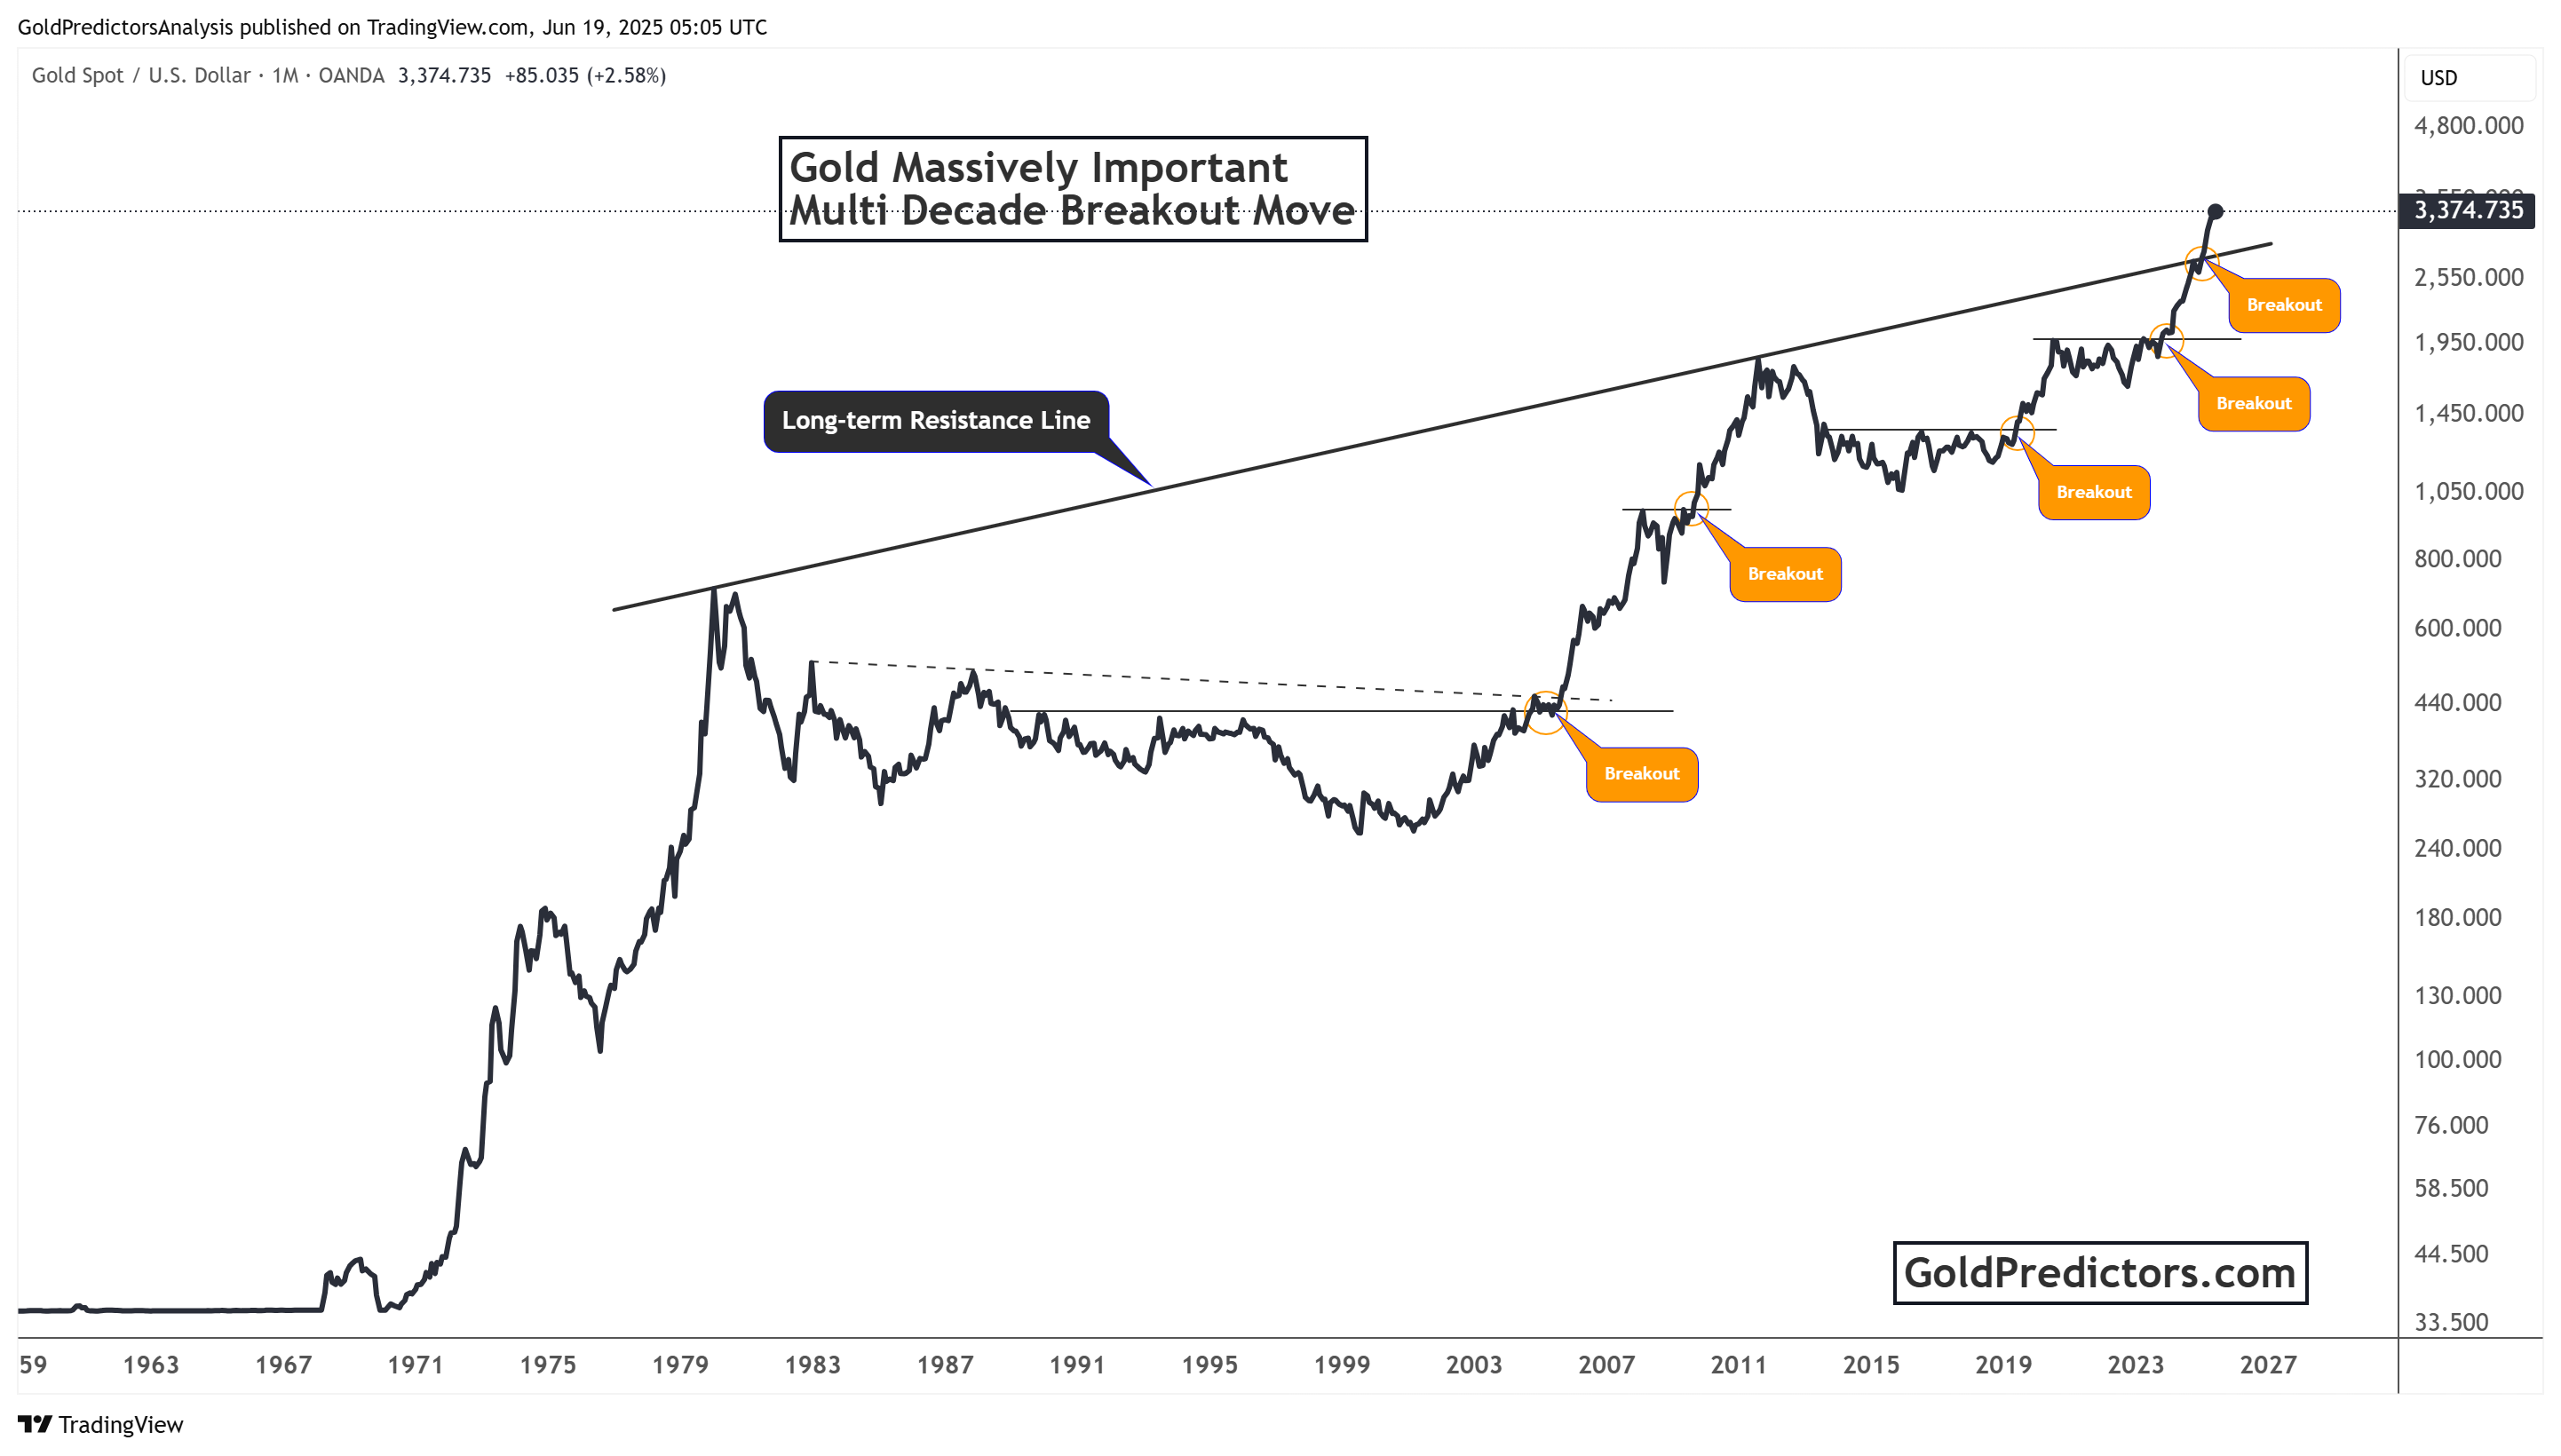
The chart below shows a long-term view of the Dow/Gold ratio, a key metric used to compare the performance of equity markets relative to gold. This ratio currently stands around 12.5, having fallen from peaks above 40 in recent decades. The chart pattern resembles a symmetrical broadening wedge, with multiple cyclical tops and bottoms.
Historically, significant declines in the Dow/Gold ratio have coincided with major shifts in investor sentiment and economic cycles. The chart shows two historic bottoms, one during the Great Depression in the 1930s and the other during the late 1970s stagflation era. In both cases, gold vastly outperformed equities.
The current trajectory suggests the Dow/Gold ratio may fall toward 0.5 in the coming decade. Such a move would imply either a substantial decline in equities, a significant rally in gold, or a combination of both. This projection aligns with the rising macroeconomic headwinds. These include surging debt levels, monetary debasement, de-globalisation, and geopolitical fragmentation.
A decline in the Dow/Gold ratio to 0.5 would reflect a complete revaluation of gold relative to financial assets. It would also indicate a paradigm shift in investor preference, moving from risk assets to safe-haven stores of value. As gold breaks out and the Dow/Gold ratio trends lower, this signals that we may be entering a gold-dominated investment cycle not seen since the 1970s.
Gold’s Breakout and Dow/Gold Ratio Confirm Shift Toward Safe-Haven Dominance
Gold’s decisive breakout above a multi-decade resistance line marks the beginning of a powerful new trend. This is not just a sign of technical strength. It reflects deep-rooted concerns about inflation, global instability, and the long-term value of fiat currencies. Investors are no longer simply hedging. They are reallocating capital in response to changing fundamentals.
The Dow/Gold ratio reinforces this structural shift. As the ratio continues its downward path, it signals a rebalancing away from risk assets toward safe-haven stores of value. Past cycles have shown that gold outperforms equities during major economic resets, and current conditions suggest that history may be repeating itself.
This moment may represent the early phase of a generational bull market in gold. With central banks buying, geopolitical tensions rising, and faith in traditional markets weakening, gold stands to gain further ground. The charts support a simple message that gold is back in charge, and the market is listening.
Gold Predictors Premium Membership
Get exclusive short-term and swing trade ideas with precise entry levels, stop-loss, and target prices, including justification and analysis — all delivered directly via WhatsApp.
Our premium service includes deep technical analysis on gold and silver markets. We cover cycle analysis, price forecasting, and key timing levels.
Members also receive a weekly market letter with detailed analysis, commentary from our Chief Analyst, including actionable insights, trade timing, and direction forecasts for gold and silver.
Stay ahead of the market — join our premium community today.


