


Gold Breakout Analysis: Structural Bull Market Targets $4,000
Gold is showing strong technical momentum driven by major breakout patterns. It has consistently broken key resistance levels, turning them into new support zones. A 4-year parabolic base also formed between 2020 and 2024, signaling a structural shift and long-term investor interest. These patterns indicate a robust and sustained bull market. As gold trades above $3,200, the charts suggest more upside potential lies ahead.
Gold Price Breakout: Key Resistance Levels Turn into Support in Long-Term Bull Trend
The chart below shows how gold has consistently broken through primary resistance levels over the past several years. In mid-2019, the yellow metal broke above its long-standing resistance, initiating a sharp move toward the $2,074 zone. After a period of consolidation between 2020 and 2023, gold retested this level and successfully broke out again in early 2024, reaffirming the strength of its bullish trend.
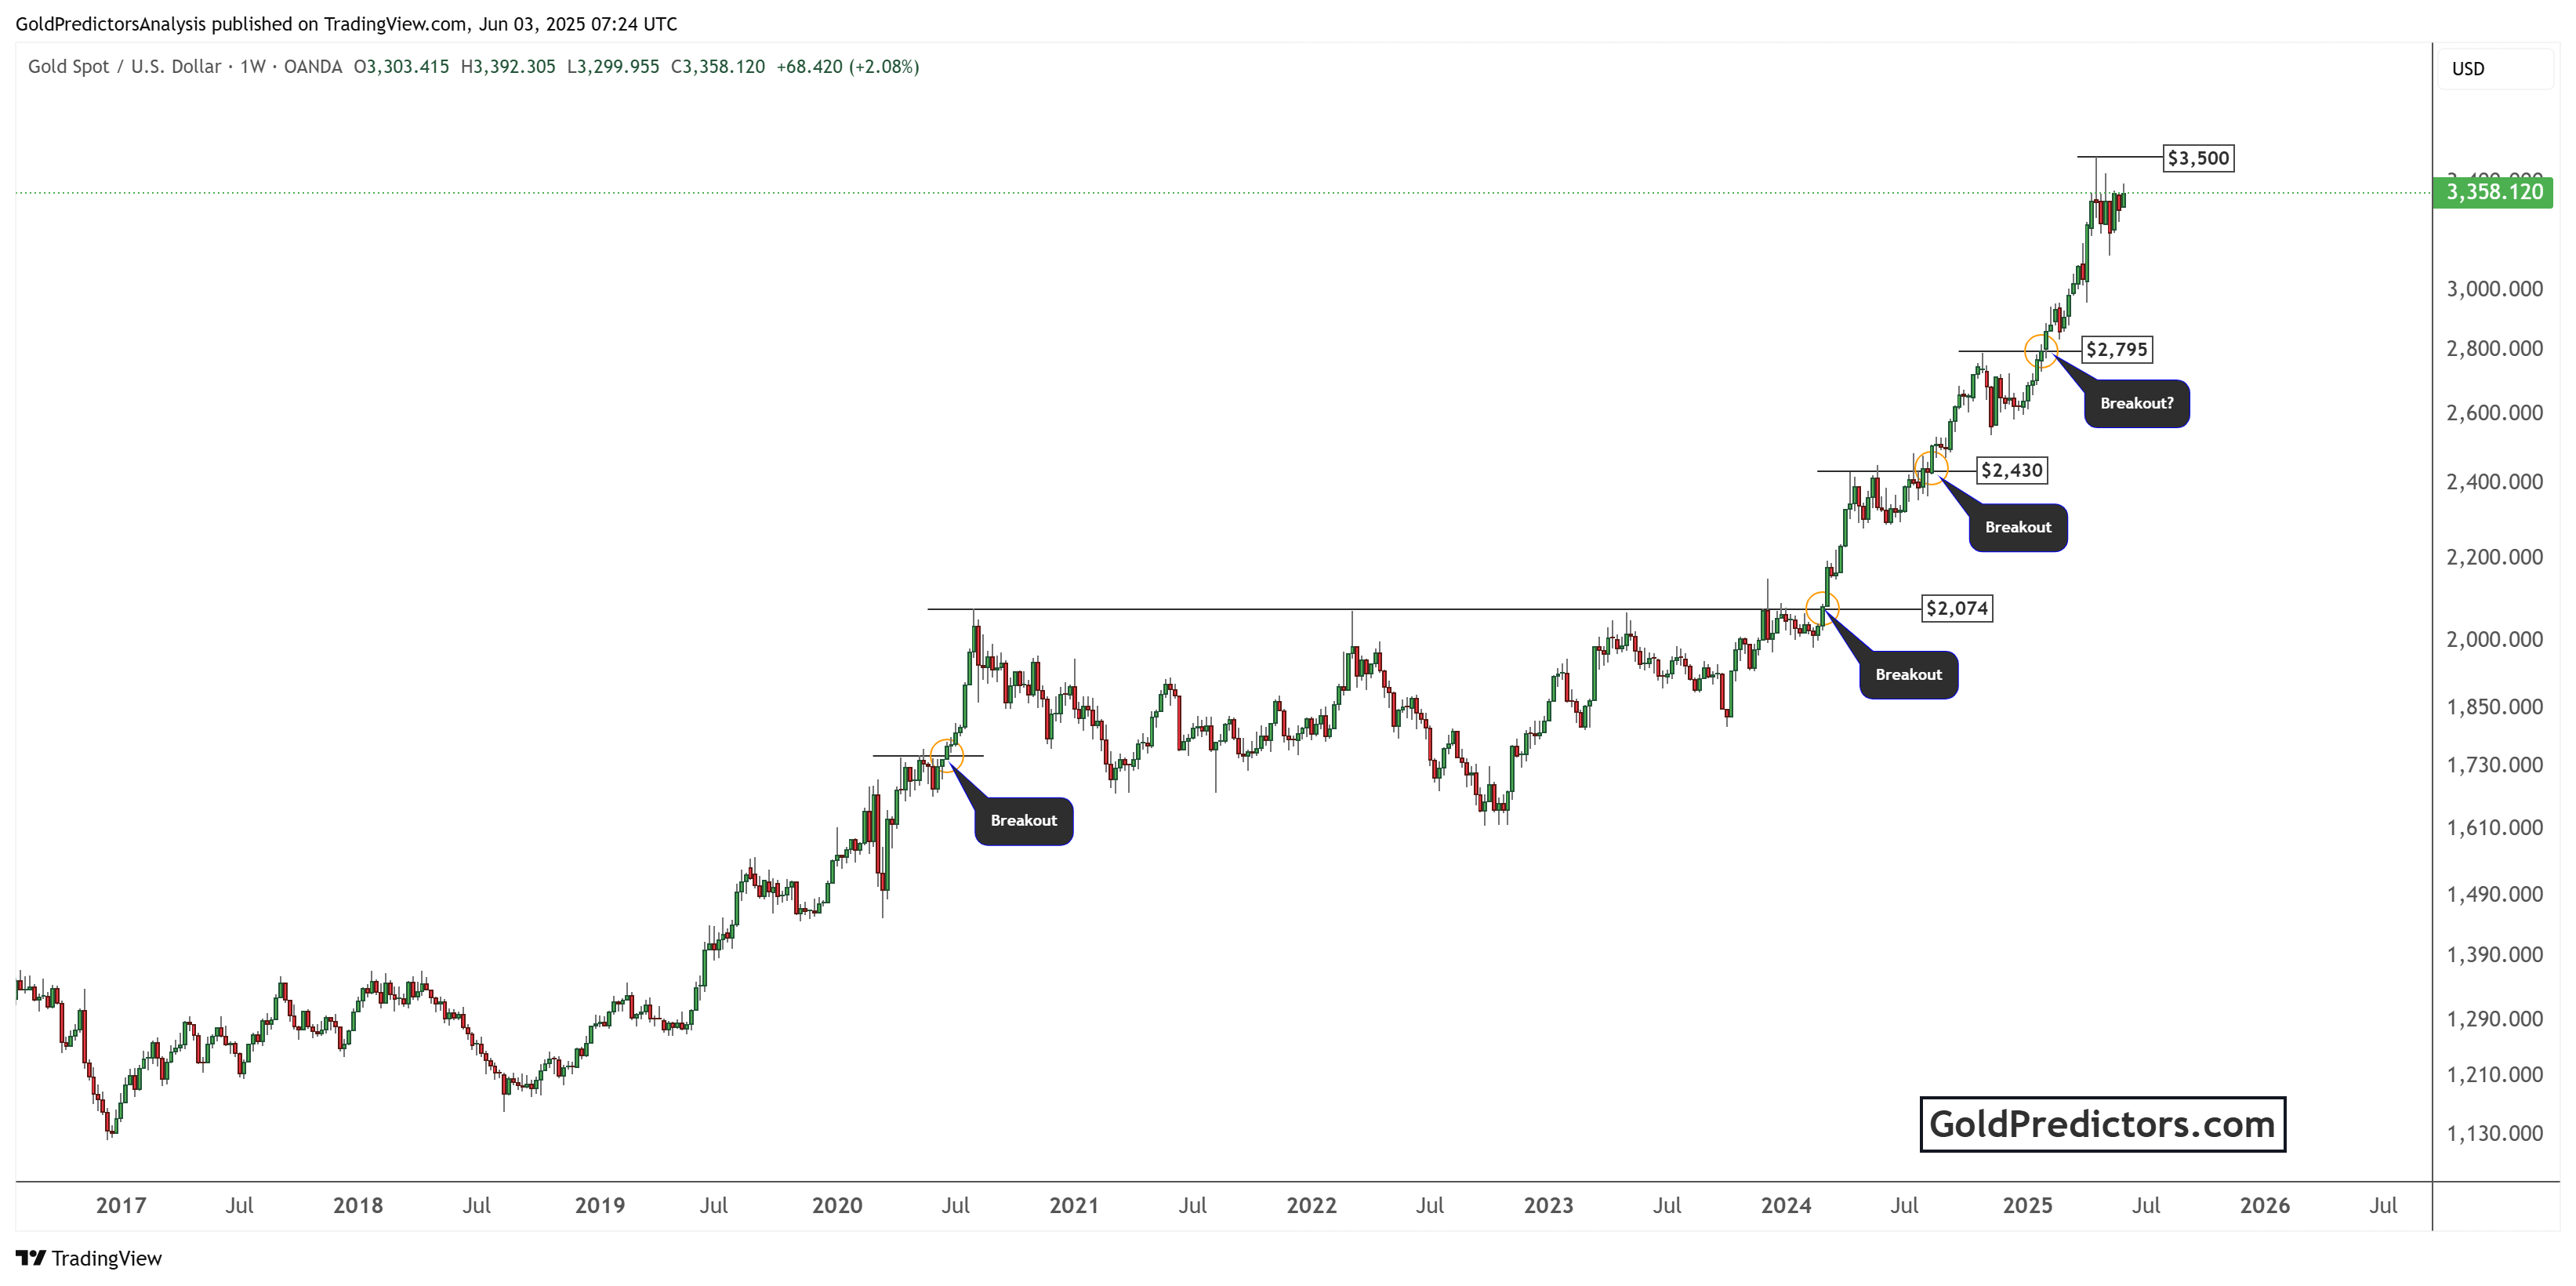
Key breakout points are clearly labeled on the chart at $2,074, $2,430, and $2,795. Each breakout was followed by a strong rally, with gold recently hitting the $3,500 mark before consolidating around $3,300. These breakouts signal institutional accumulation and increasing investor interest in gold as a hedge against macroeconomic uncertainty, inflation, and geopolitical risks.
What stands out is the repeated validation of prior resistance zones turning into new support levels. This characteristic is typical of a strong bull market, indicating that each leg higher has been supported by technical strength rather than speculative excess. The “Breakout?” label near $2,795 suggests a recent zone that may either confirm a support level.
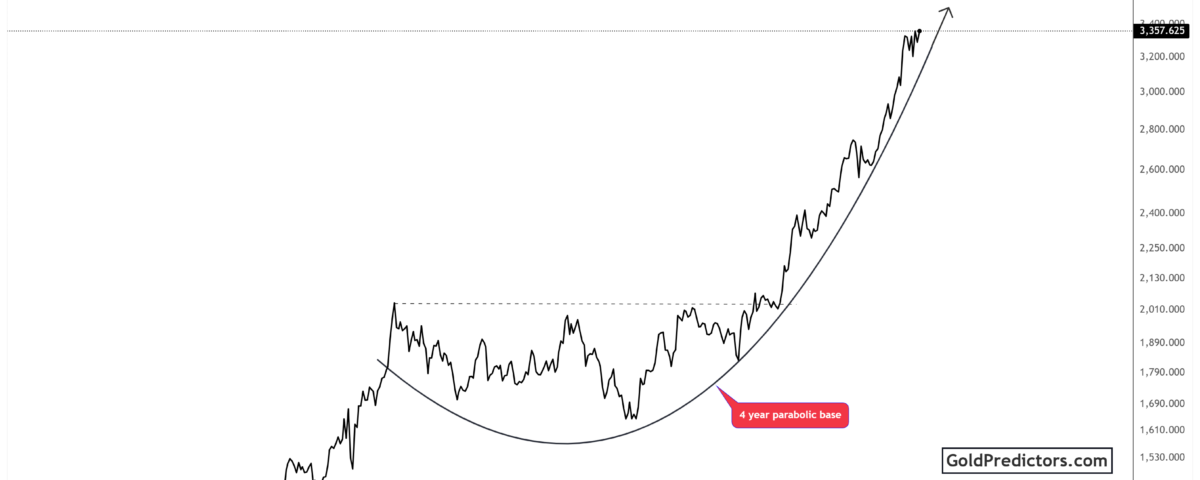
4-Year Parabolic Base Fuels Gold’s Structural Rally Toward $4,000
The gold chart below provides important context for the ongoing rally, highlighting the broader technical structure supporting the current uptrend. It shows a four-year parabolic base that formed between 2020 and 2024. This base resembles a classic accumulation pattern, often seen before long-term uptrends in commodities. Following the completion of this base, gold began a steep upward trajectory, which now appears to be entering a parabolic rise.
This pattern implies a structural shift in the gold market. Unlike short-term rallies driven by news events, a breakout from a multi-year parabolic base indicates profound shifts in investor behavior. It means long-term capital inflows and growing demand for gold as a store of value. The curve drawn on the chart indicates that the price is now accelerating upward along a steep path, suggesting the possibility of even higher prices in the near future.
Such formations are rare and often precede dramatic price increases. If gold continues to follow this trajectory, the $3,500 level could be a short-term pause before another significant move higher. Analysts may start projecting targets of $4,000 if the current structure remains in place.
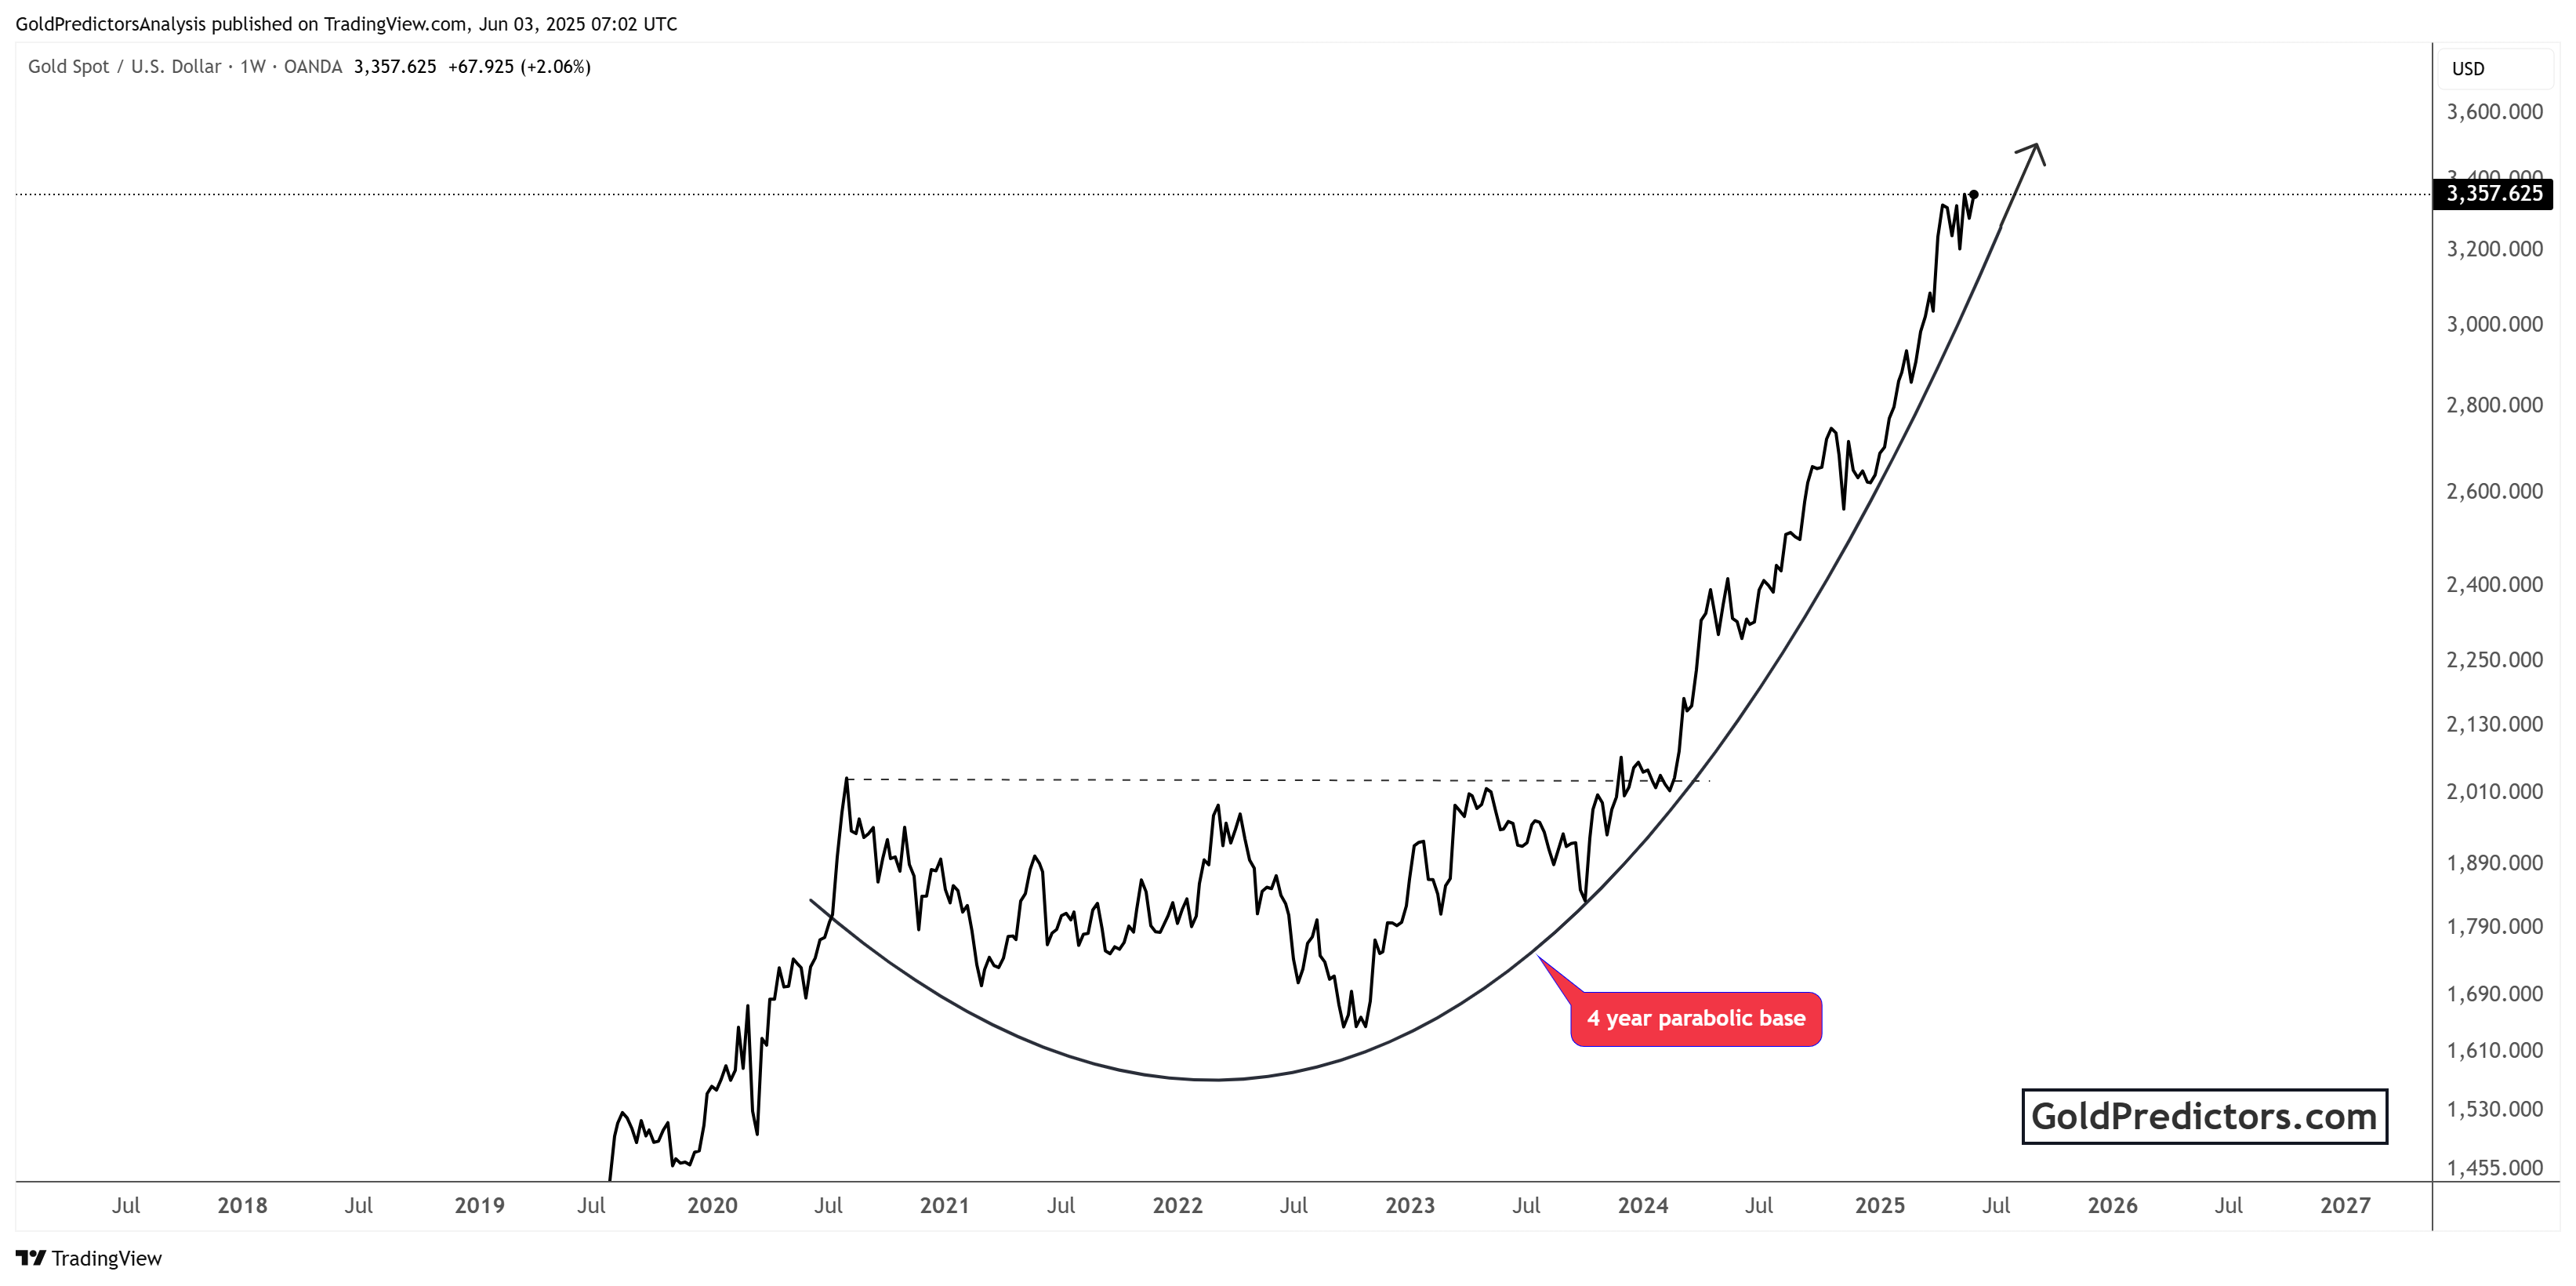
Short-Term Gold Trading Strategy: $196 Profit from Confirmed Bottom Setup
The chart below shows a short-term gold trade executed after identifying a confirmed bottom at approximately $3,130. The trade was delivered to premium members using WhatsApp. The trade was entered at $3,176 and exited at $3,372, capturing a profit of $196 per ounce. It clearly shows the method of buying after confirmation of a bottom and leaving at a predetermined resistance level. The stop loss was raised to $3,242 to protect gains. It highlights how timing entries and exits based on technical analysis can generate consistent profits.
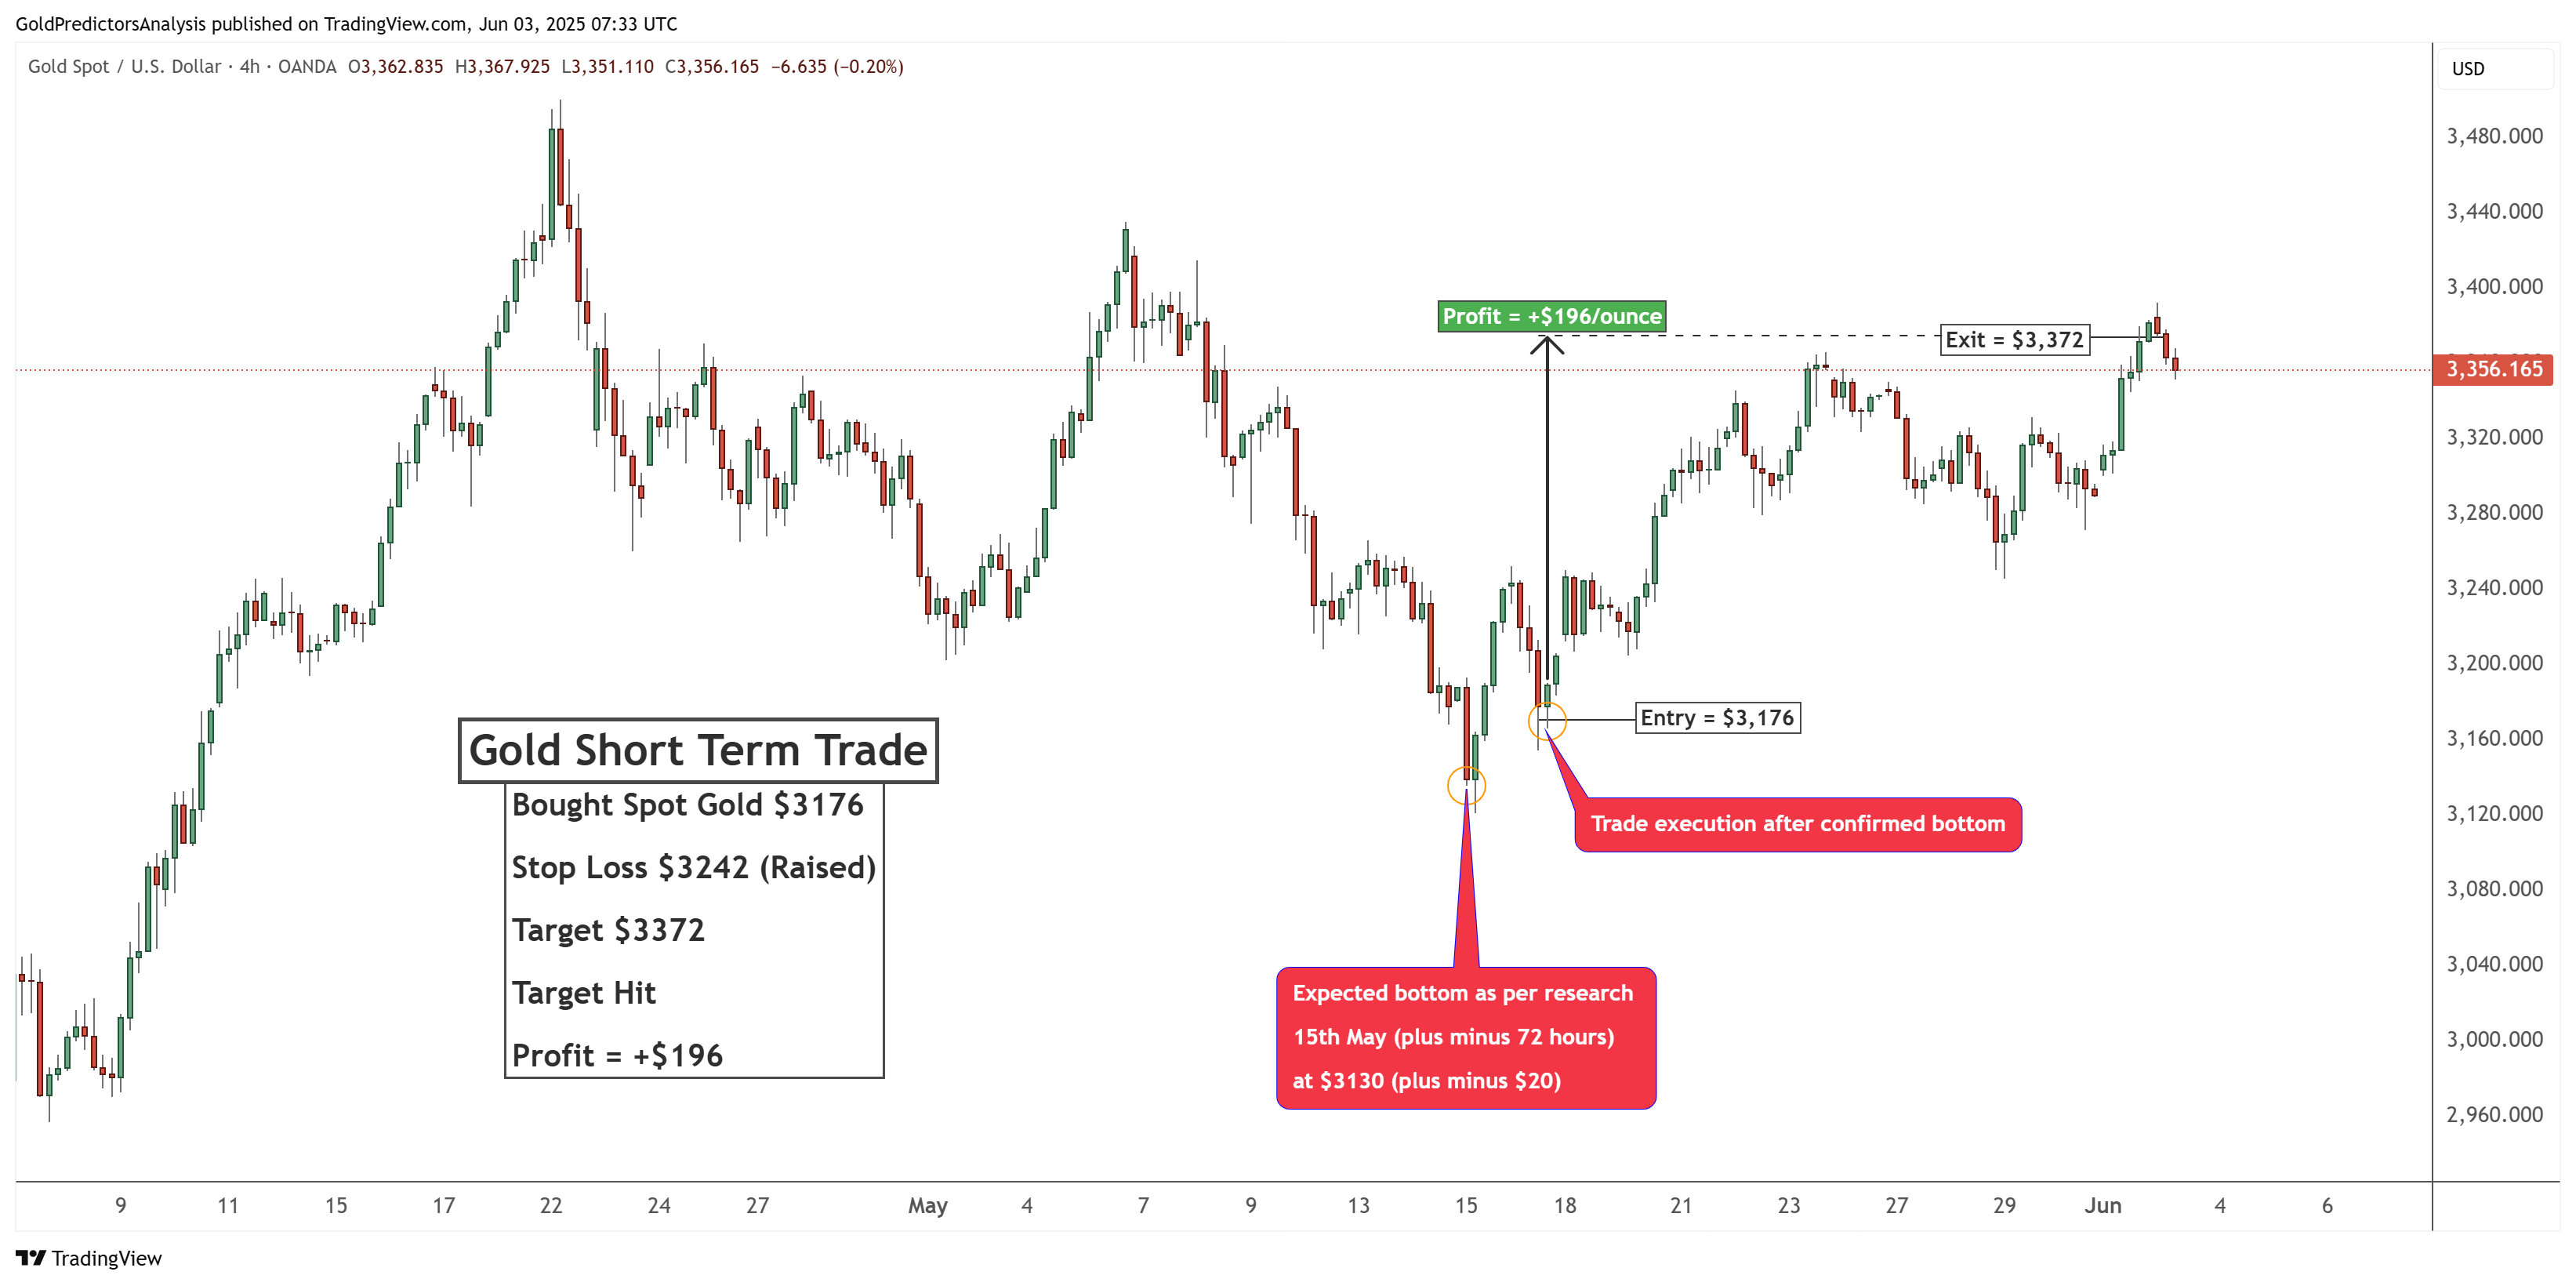
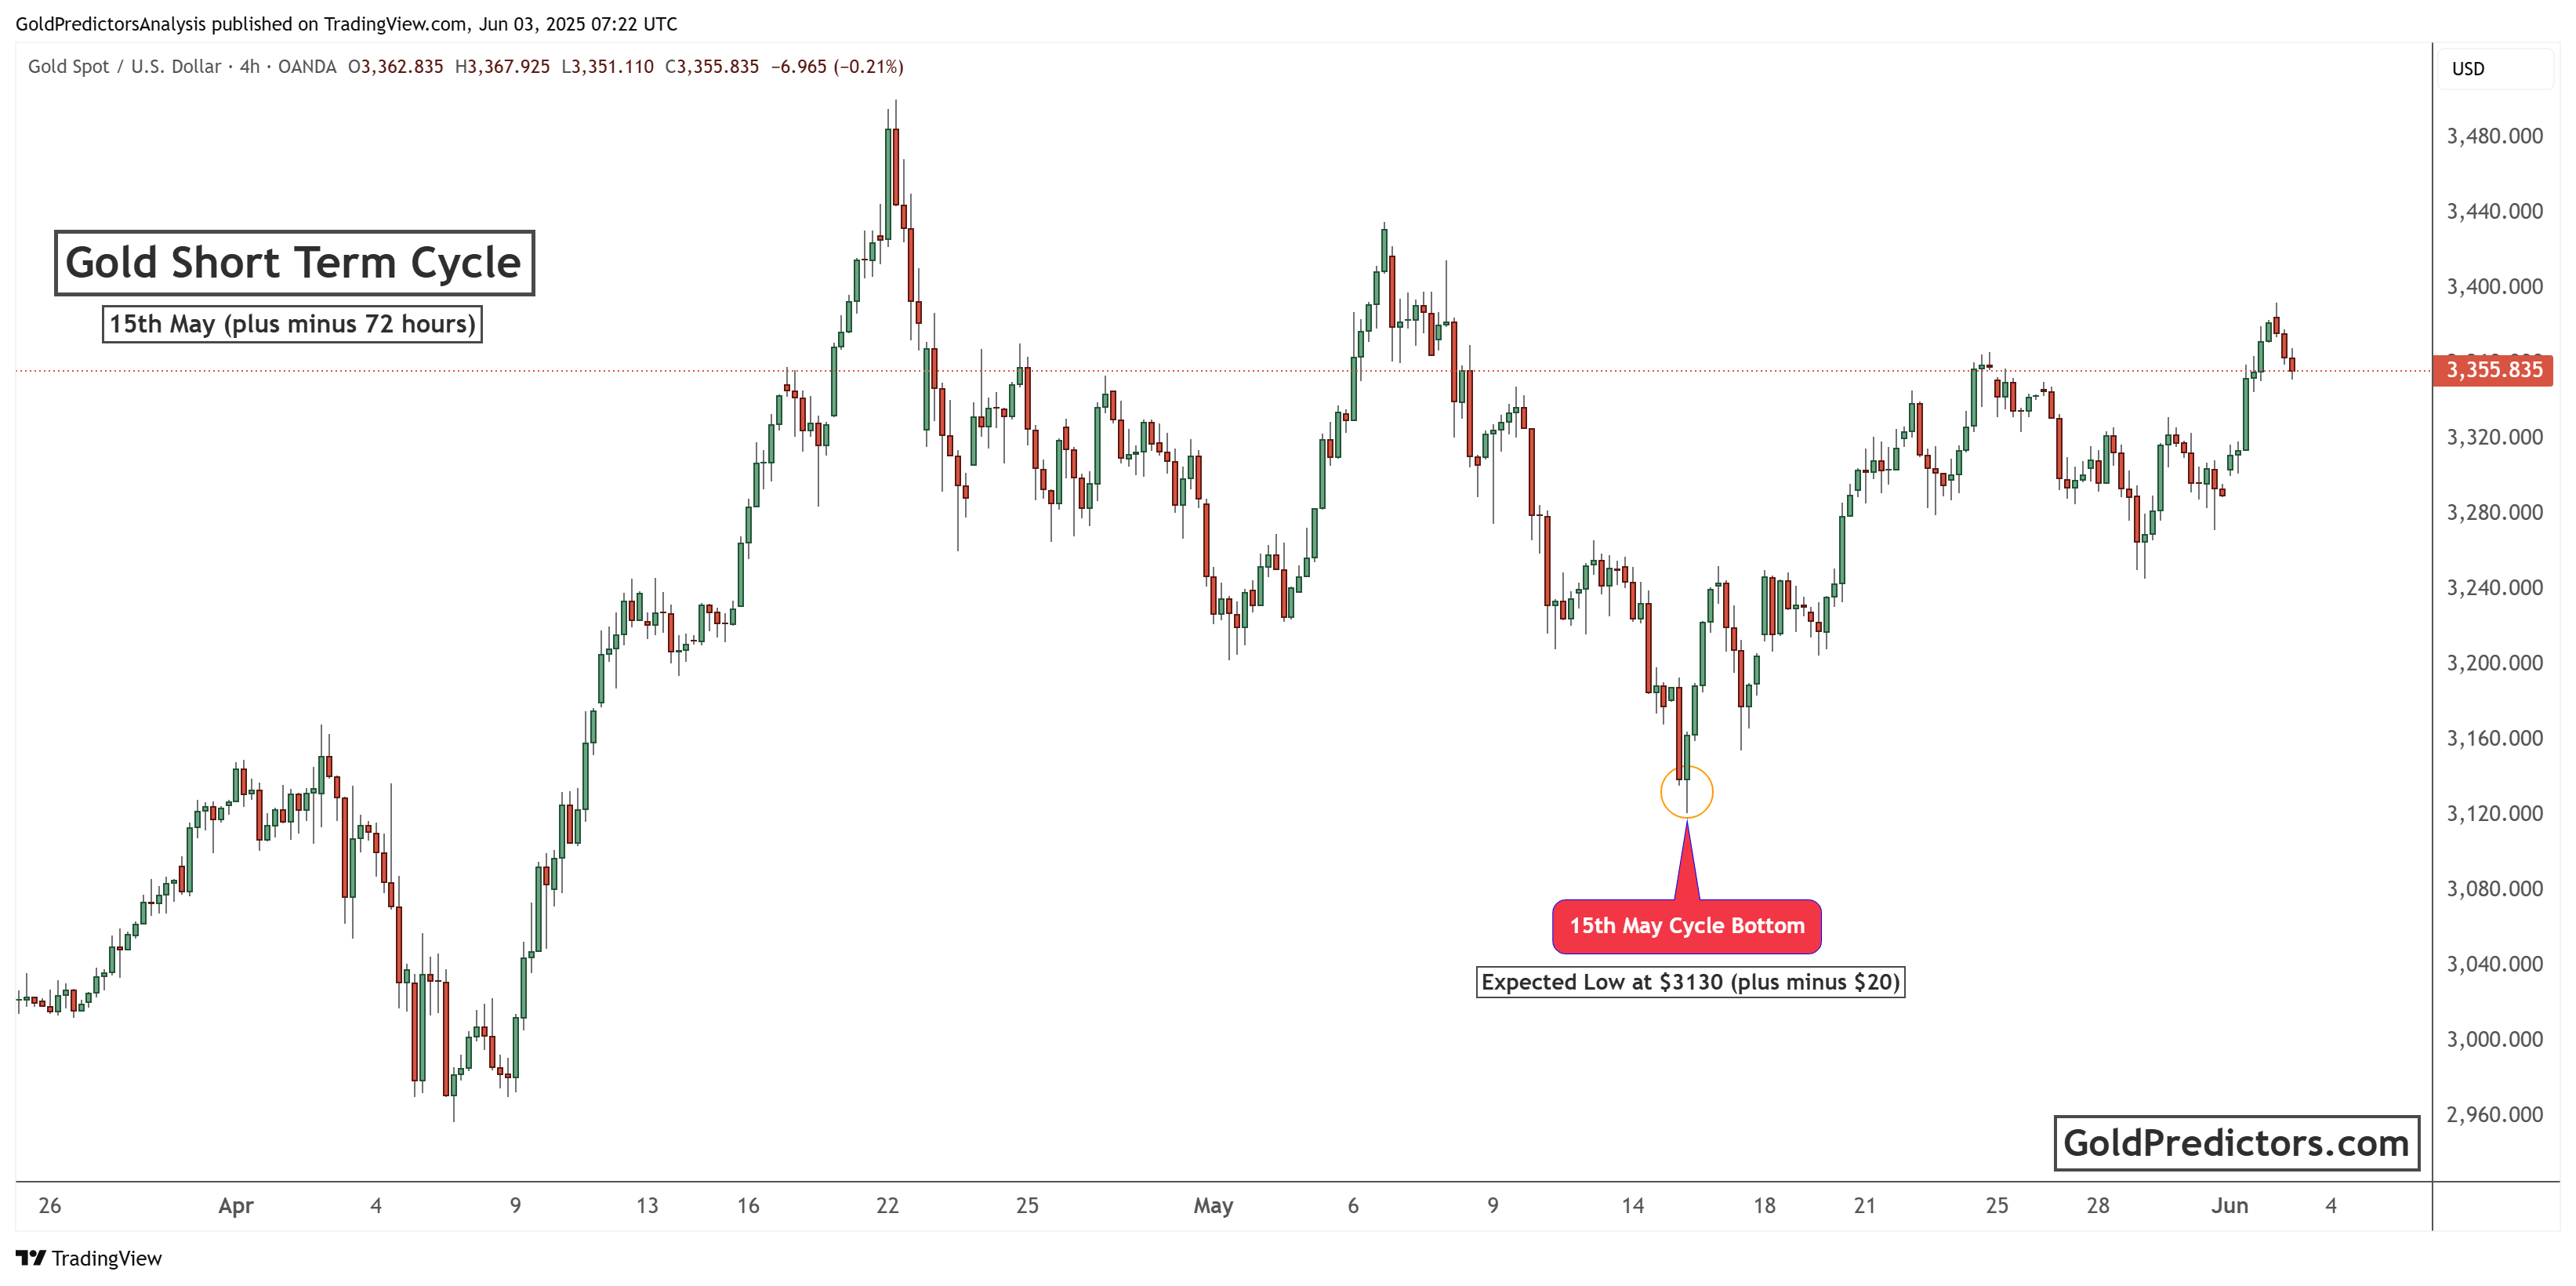
Gold Cycle Analysis: Precise Bottom Forecast Sparks Rebound from $3,130
The chart below shows the short-term gold price cycle with a projected bottom around May 15th, plus or minus 72 hours. The cycle correctly predicted a low near $3,130, as marked on the chart. After hitting this low, the price rebounded sharply, confirming the cycle bottom. The chart uses 4-hour candlesticks to show price movement and highlights the expected timing and price range of the reversal. It suggests that gold followed a predictable cycle and rebounded as forecasted.
Breakouts, Patterns, and the Road to $4,000
The combination of multiple confirmed breakouts and a 4-year parabolic base strongly supports a bullish outlook for gold. The price structure on the charts indicates that gold is not merely reacting to short-term catalysts, but is instead in the midst of a significant technical and structural bull run. As of June 2025, gold is trading above $3,350, with both technical momentum and historical patterns indicating further upside potential.
Investors and traders should closely monitor how the price behaves around the $3,500 resistance zone. A clean breakout above this level could pave the way for $4,000 and beyond. Meanwhile, any pullback toward previous breakout zones of $2,800 and $3,000 may offer opportunities for accumulation.
In conclusion, gold’s recent price action confirms its role as a safe-haven asset in times of uncertainty. With technical indicators aligning for a sustained move, gold could be entering a powerful new phase of its bull cycle.
Gold Predictors Premium Membership
Get exclusive short-term and swing trade ideas with precise entry levels, stop-loss, and target prices, including justification and analysis — all delivered directly via WhatsApp.
Our premium service includes deep technical analysis on gold and silver markets. We cover cycle analysis, price forecasting, and key timing levels.
Members also receive a weekly market letter with detailed analysis, commentary from our Chief Analyst, including actionable insights, trade timing, and direction forecasts for gold and silver.
Stay ahead of the market — join our premium community today.


