Gold Price Surge: Inflation and Trade War Spark Bullish Run Toward $6,000 | Gold Predictors - Forecasting Gold Prices

New York

London

Sydney

Tokyo

Log In

  • Register
  • Lost your password?
gold predictorsgold predictorsgold predictorsgold predictors
  • HOME
  • ABOUT US
    • About Us
    • Social Networks
    • Industry Links
    • Testimonials
    • News & Updates
  • RESEARCH
    • Scientific Trade Strategies
    • Gold Hub
    • Gold Importance
    • Silver Importance
  • GOLD HUB
  • GOLD ANALYSIS
    • Gold Analysis
    • Technical Analysis
      • Trend Identification
      • Phase Identification
      • Important Levels
      • Volatility Measurement
    • Gold Cycle
      • Short Term Cycles
      • Medium Term Cycles
      • Long Term Cycles
    • Price Action Analysis
      • Phase Identification
      • Historical Pattern Identification
      • Candlestick Pattern Identification
    • Fundamental Analysis of Gold
    • Gold Related Markets Analysis
    • Gold Seasonal
  • TRADING METHODOLOGY
    • Gold Analysis
      • Technical Analysis
      • Gold Cycle
      • Price Action Strategy
      • Fundamental Analysis
      • Gold Related Markets Analysis
      • Gold Seasonal
    • Measure Signal Strength
      • Weak Signal
      • Strong Signal
      • Confirmed Signal
    • Trading Decision
    • Trading Rules
      • Basic Trading Rules
      • Gold Predictors Trading Rules
    • Trade Examples
    • Performance
  • LIVE CHARTS
  • MEMBERSHIPS
    • Free Membership
    • Premium Membership
    • SignUp
  • MEMBERS AREA
    • Free Article
    • Premium Article
    • Trading Signals
    • Long Term Signals
    • Forex Reports
    • Crypto Reports
  • FOREX REPORTS
  • HELP
    • FAQ
    • Contact Us
Login / Register

Gold Price Surge: Inflation and Trade War Spark Bullish Run Toward $6,000

0
Published by admin at April 14, 2025
Categories
  • Free Articles
Tags
  • forex
  • gold
  • silver
  • US Dollar
gold pattern

President Trump’s decision to raise tariffs on Chinese imports to 145% has intensified trade tensions between the U.S. and China, leading to significant market volatility. Investors, seeking safe-haven assets amid fears of a global economic slowdown and potential inflation, have turned to gold, driving its price above $3,200 per ounce—a record high. The tariffs have weakened the U.S. dollar, making gold more attractive to foreign buyers and further boosting demand. Additionally, expectations of Federal Reserve rate cuts in response to economic uncertainties have contributed to gold’s appeal, as lower interest rates reduce the opportunity cost of holding non-yielding assets. This article discusses the technical charts for gold to understand the current gold market situation and possible future direction.

Gold Quarterly Performance Reflects Strong Demand

The chart below shows gold’s quarterly price movement. The data reveals a clear upward trend in gold prices over the last few quarters. Gold started its upward journey from lower levels in 2024. The first quarter of 2025 showed a sharp price rise, indicating strong investor interest in gold.

gold pattern

The key factor behind this rise is the growing demand for safe-haven assets. Global inflation is still a concern, and many investors are worried about the stability of fiat currencies. Central banks across the world have continued their gold-buying programs. This strategy supports their reserves and reduces exposure to currency risks.

Another important observation from the quarterly chart is the increasing pace of gold’s price growth. The price momentum has been stronger in the recent quarter than in the past. This is a bullish sign for the market. It shows that the buying pressure is sustained and increasing over time.

Moreover, geopolitical tensions have also contributed to this price rise. Uncertainty in international relations, wars, and conflicts always increase volatility in gold prices. The formation of an ascending channel following the breakout from the bull flag pattern indicates sustained bullish momentum. Additionally, the cup and handle formation within the ascending channel further supports a long-term target of $6,000.

Gold vs Inflation Reveals Strong Price Breakouts in 2025

The chart below highlights gold’s historical performance against inflation, focusing on two major breakout points that triggered powerful bullish trends. The first breakout appeared in the early 1970s during a surging global inflation. Gold responded strongly, breaking its long-term resistance and starting a historic rally. The chart also shows a large cup pattern formation that began after gold peaked in the early 1980s, followed by a long period of consolidation.

gold pattern

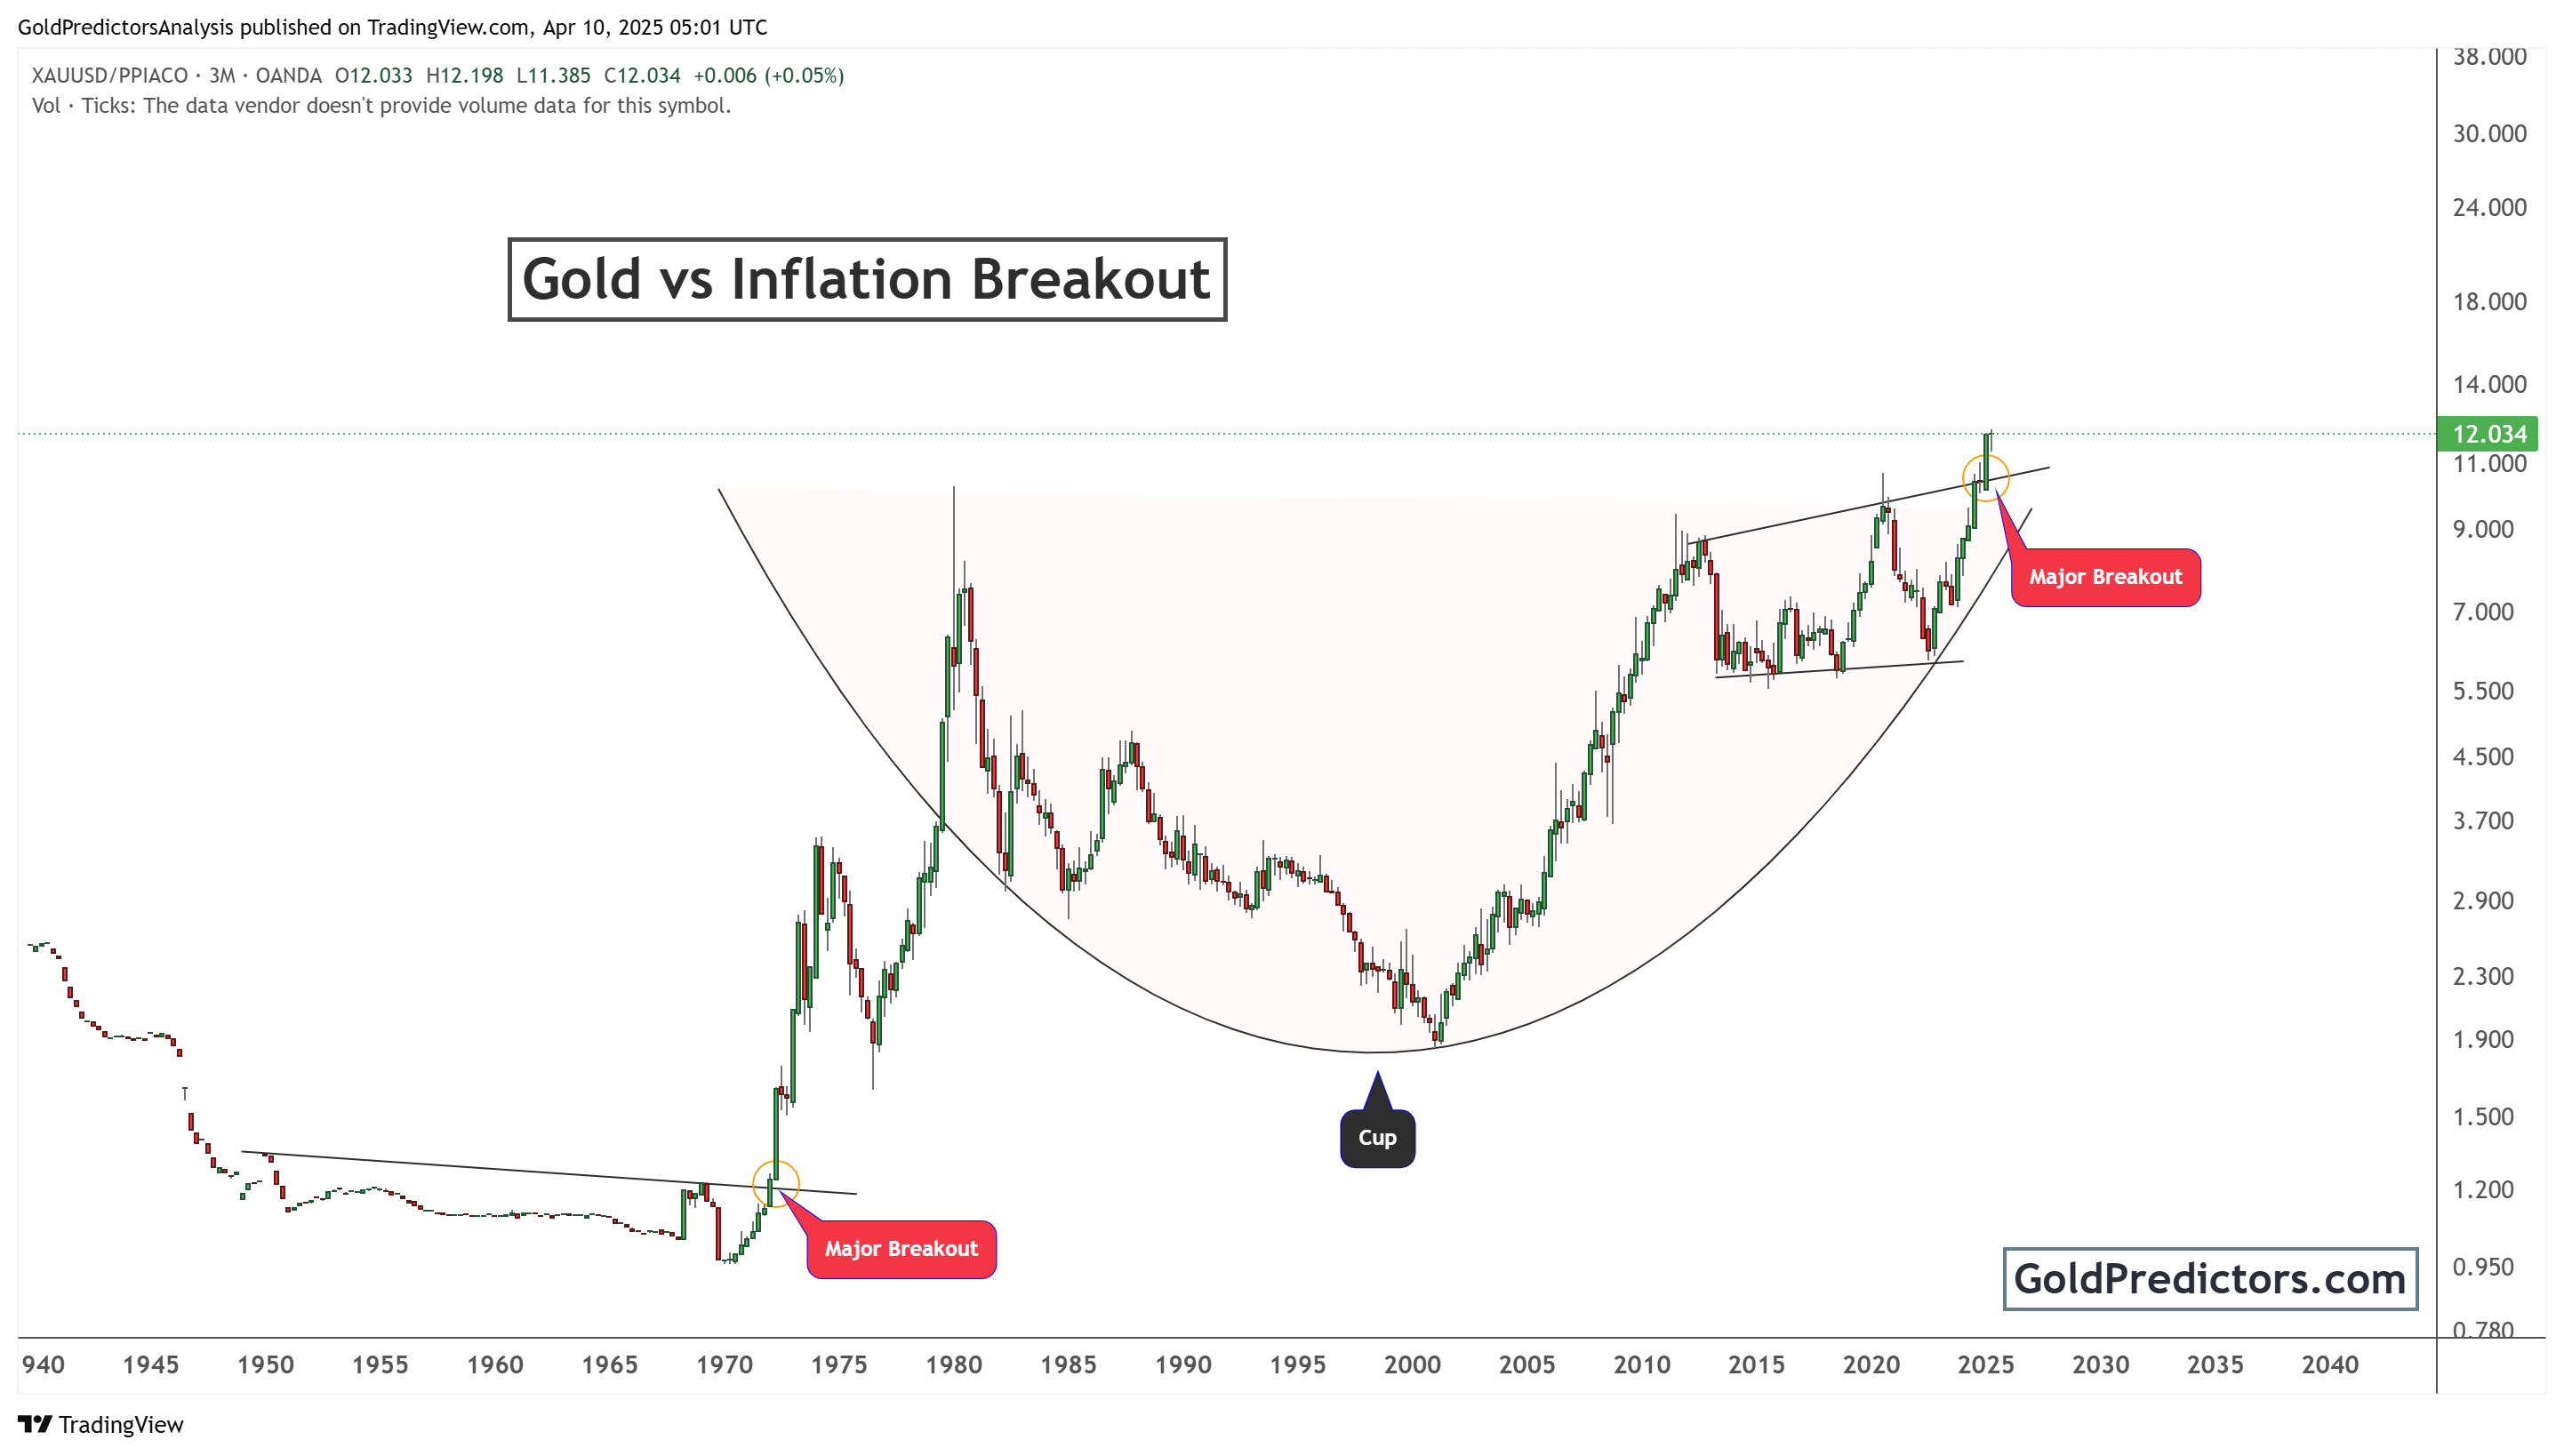
Recently, gold completed the right side of this multi-decade cup and successfully broke above its resistance zone. This second major breakout confirms a bullish pattern for gold in response to growing inflationary pressures. The rising inflation environment has once again provided strong support for gold prices. It repeats the historical pattern of gold acting as a hedge against inflation.

With this recent breakout, gold has entered a new bullish phase. The chart clearly shows that gold and inflation often move together, and history has proven gold’s ability to protect value during high inflation periods. This breakout signals the potential for gold to reach new all-time highs in the coming years, supported by the continuing threat of global inflation.

Bottom Line

In conclusion, gold has entered a strong bullish phase driven by rising tariffs, global inflation, and geopolitical tensions. President Trump’s tariff hike on China sparked safe-haven demand and weakened the U.S. dollar, lifting gold prices above $3,200. Technical patterns like the ascending channel and cup and handle formation point to a long-term target of $6,000. Historical trends confirm gold’s role as a hedge against inflation.

Latest Post

Free Articles

Gold Clears Decades-Long Resistance as Dollar-to-Gold Ratio Breaks Support

Gold breaks decades-long resistance as dollar-to-gold ratio slips below support, signaling structural shift favoring higher prices …
Read More
February 26, 2026 / admin
Free Articles

Silver Breaks Long-Term Compression as Dollar-to-Silver Ratio Turns Lower

Silver exits long-term compression as breakouts hold and dollar-to-silver ratio turns lower, supporting price expansion …
Read More
February 25, 2026 / admin
Free Articles

Gold Price Outlook: Long-Term Strength and Leadership Rotation Support Higher Prices

Gold holds rising channel as breakouts persist and relative strength improves, signaling leadership rotation and …
Read More
February 24, 2026 / admin
Free Articles

Gold Breaks Out of Multi-Decade Triangle as Industrials Lose Ground

Gold clears multi-decade resistance as price holds above $3,000 and industrials lose relative strength, confirming …
Read More
February 20, 2026 / admin
Free Articles

Silver Breaks Out From Multi-Decade Compression as Silver-to-Miners Ratio Turns Higher

Silver clears decades of compression as price holds above $50 and the silver-to-miners ratio turns …
Read More
February 19, 2026 / admin
Free Articles

Silver vs Copper: Will the Ratio Sustain Its Breakout?

Silver clears decades-long resistance, with price action and the silver-to-copper ratio pointing to higher long-term …
Read More
February 18, 2026 / admin
Become a Premium Member

Related posts

gold pattern
February 26, 2026

Gold Clears Decades-Long Resistance as Dollar-to-Gold Ratio Breaks Support


Read more
silver pattern
February 25, 2026

Silver Breaks Long-Term Compression as Dollar-to-Silver Ratio Turns Lower


Read more
gold pattern
February 24, 2026

Gold Price Outlook: Long-Term Strength and Leadership Rotation Support Higher Prices


Read more

Comments are closed.

ABOUT US

  • About Us
  • Social Networks
  • Industry Links
  • Testimonials
  • Terms & Conditions

TECHNICAL ANALYSIS

  • Technical Analysis
  • Trend Identification
  • Phase Identification
  • Important Levels
  • Volatility Measurement

CYCLE ANALYSIS

  • Gold Cycle
  • Short Term Cycles
  • Medium Term Cycles
  • Long Term Cycles

PRICE ACTION ANALYSIS

  • Price Action Analysis
  • Phase Identification
  • Historical Pattern Identification
  • Candlestick Pattern Identification
© 2017 Gold Predictors. All Rights Reserved.
  • Remember Me
    Lost your password?
    Dont have an account?Sign Up