


Gold Price Surges Past $3,050 – Is the Breakout Signaling More Upside Ahead?
Gold prices hit new highs above $3,050, breaking through long-term resistance levels. Investors and traders closely monitor gold trends as the metal approaches significant milestones. The gold technical analysis suggests a strong bullish trend driven by historical patterns and market momentum. However, the price is trading at the overbought region which indicates a price correction. This article discusses the gold charts to understand gold’s future movement.
Gold’s Breakout above Cup and Handle Pattern
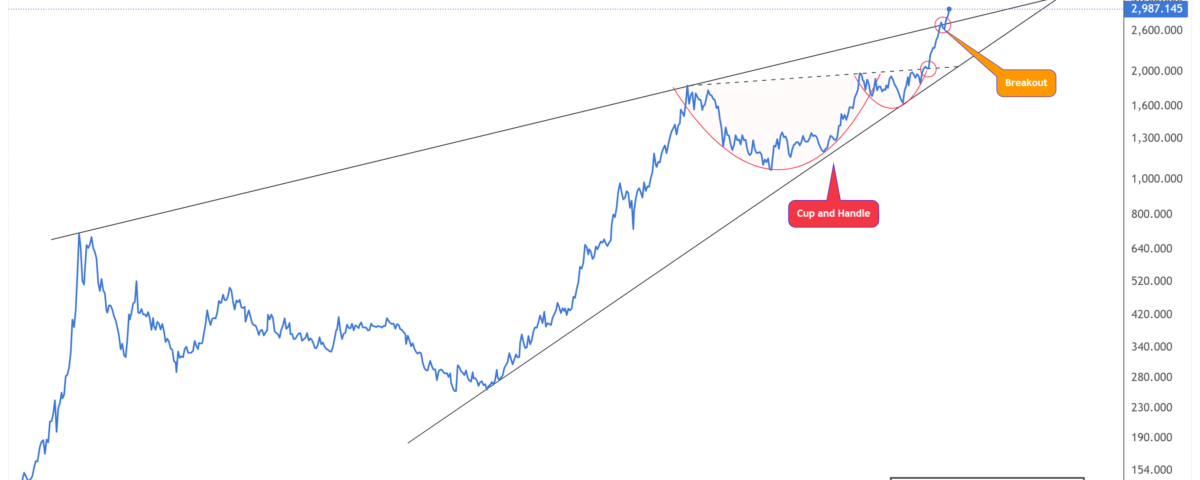
The chart below highlights a long-term breakout in gold prices. The price has moved beyond a rising wedge pattern’s upper resistance, indicating strong bullish momentum. The chart also displays a classic cup and handle pattern, a well-known bullish continuation pattern.
A cup and handle pattern appears when an asset forms a curved low (the cup) and briefly pauses (the handle) before breaking out. Gold has followed this pattern, leading to the current breakout. Historically, such patterns indicate strong upward movements.
With gold surpassing key resistance levels, the breakout suggests a continuation of the uptrend. Prices may move toward higher resistance zones if this trend holds, potentially reaching $3,200 or beyond. However, traders must remain cautious about potential pullbacks, as overextended rallies can lead to corrections.
Gold Surges Within Ascending Channel
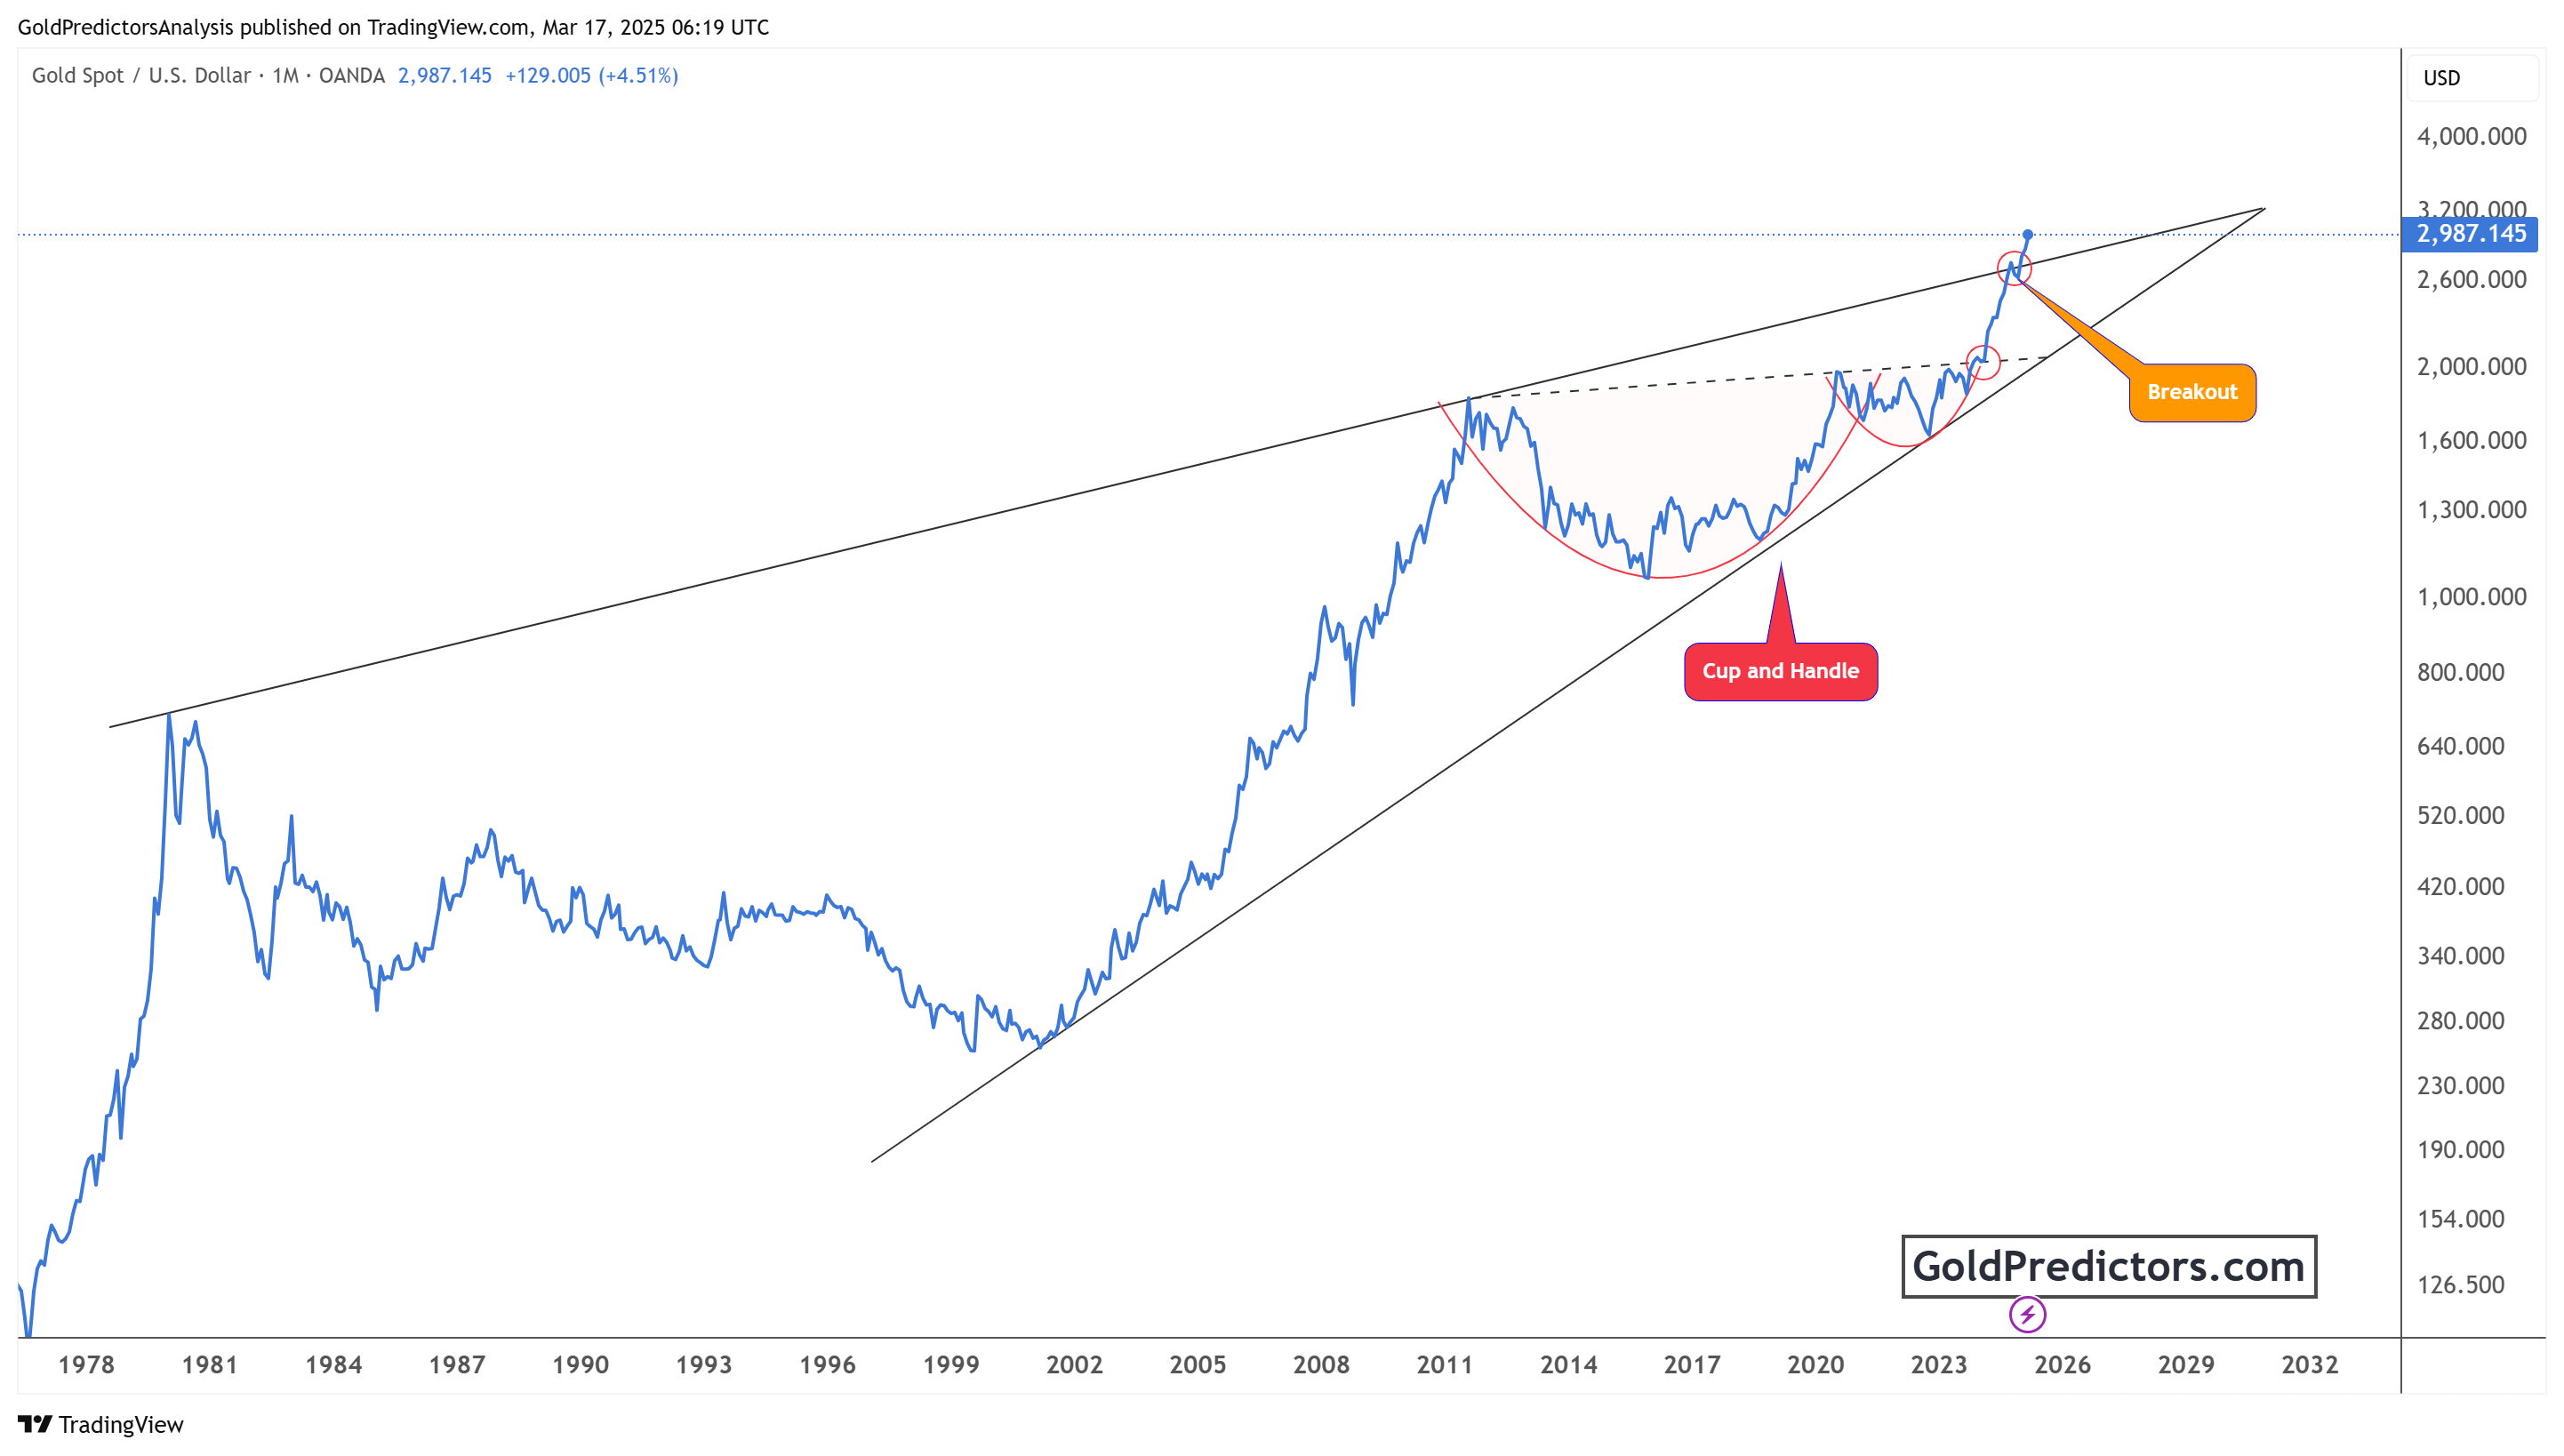
The weekly gold chart below provides a short-to-medium-term perspective on gold’s movement. Gold has been trading within an ascending channel, steadily gaining value. The recent surge has pushed the price towards the upper boundary of this channel, indicating an overextended phase.
The chart also marks an ideal buy point, where gold previously formed an inverse head and shoulders pattern. This pattern signals a strong uptrend, which has played out as expected. However, with prices now touching the upper boundary, gold appears overextended. This means traders should expect potential short-term pullbacks before further gains.
A pullback to the middle or lower boundary of the ascending channel could provide another buying opportunity. If gold remains within this channel, it could continue trending higher. However, a more substantial rally could occur if it breaks out of the channel, leading to a new all-time high.
How to Trade Gold During Crisis?
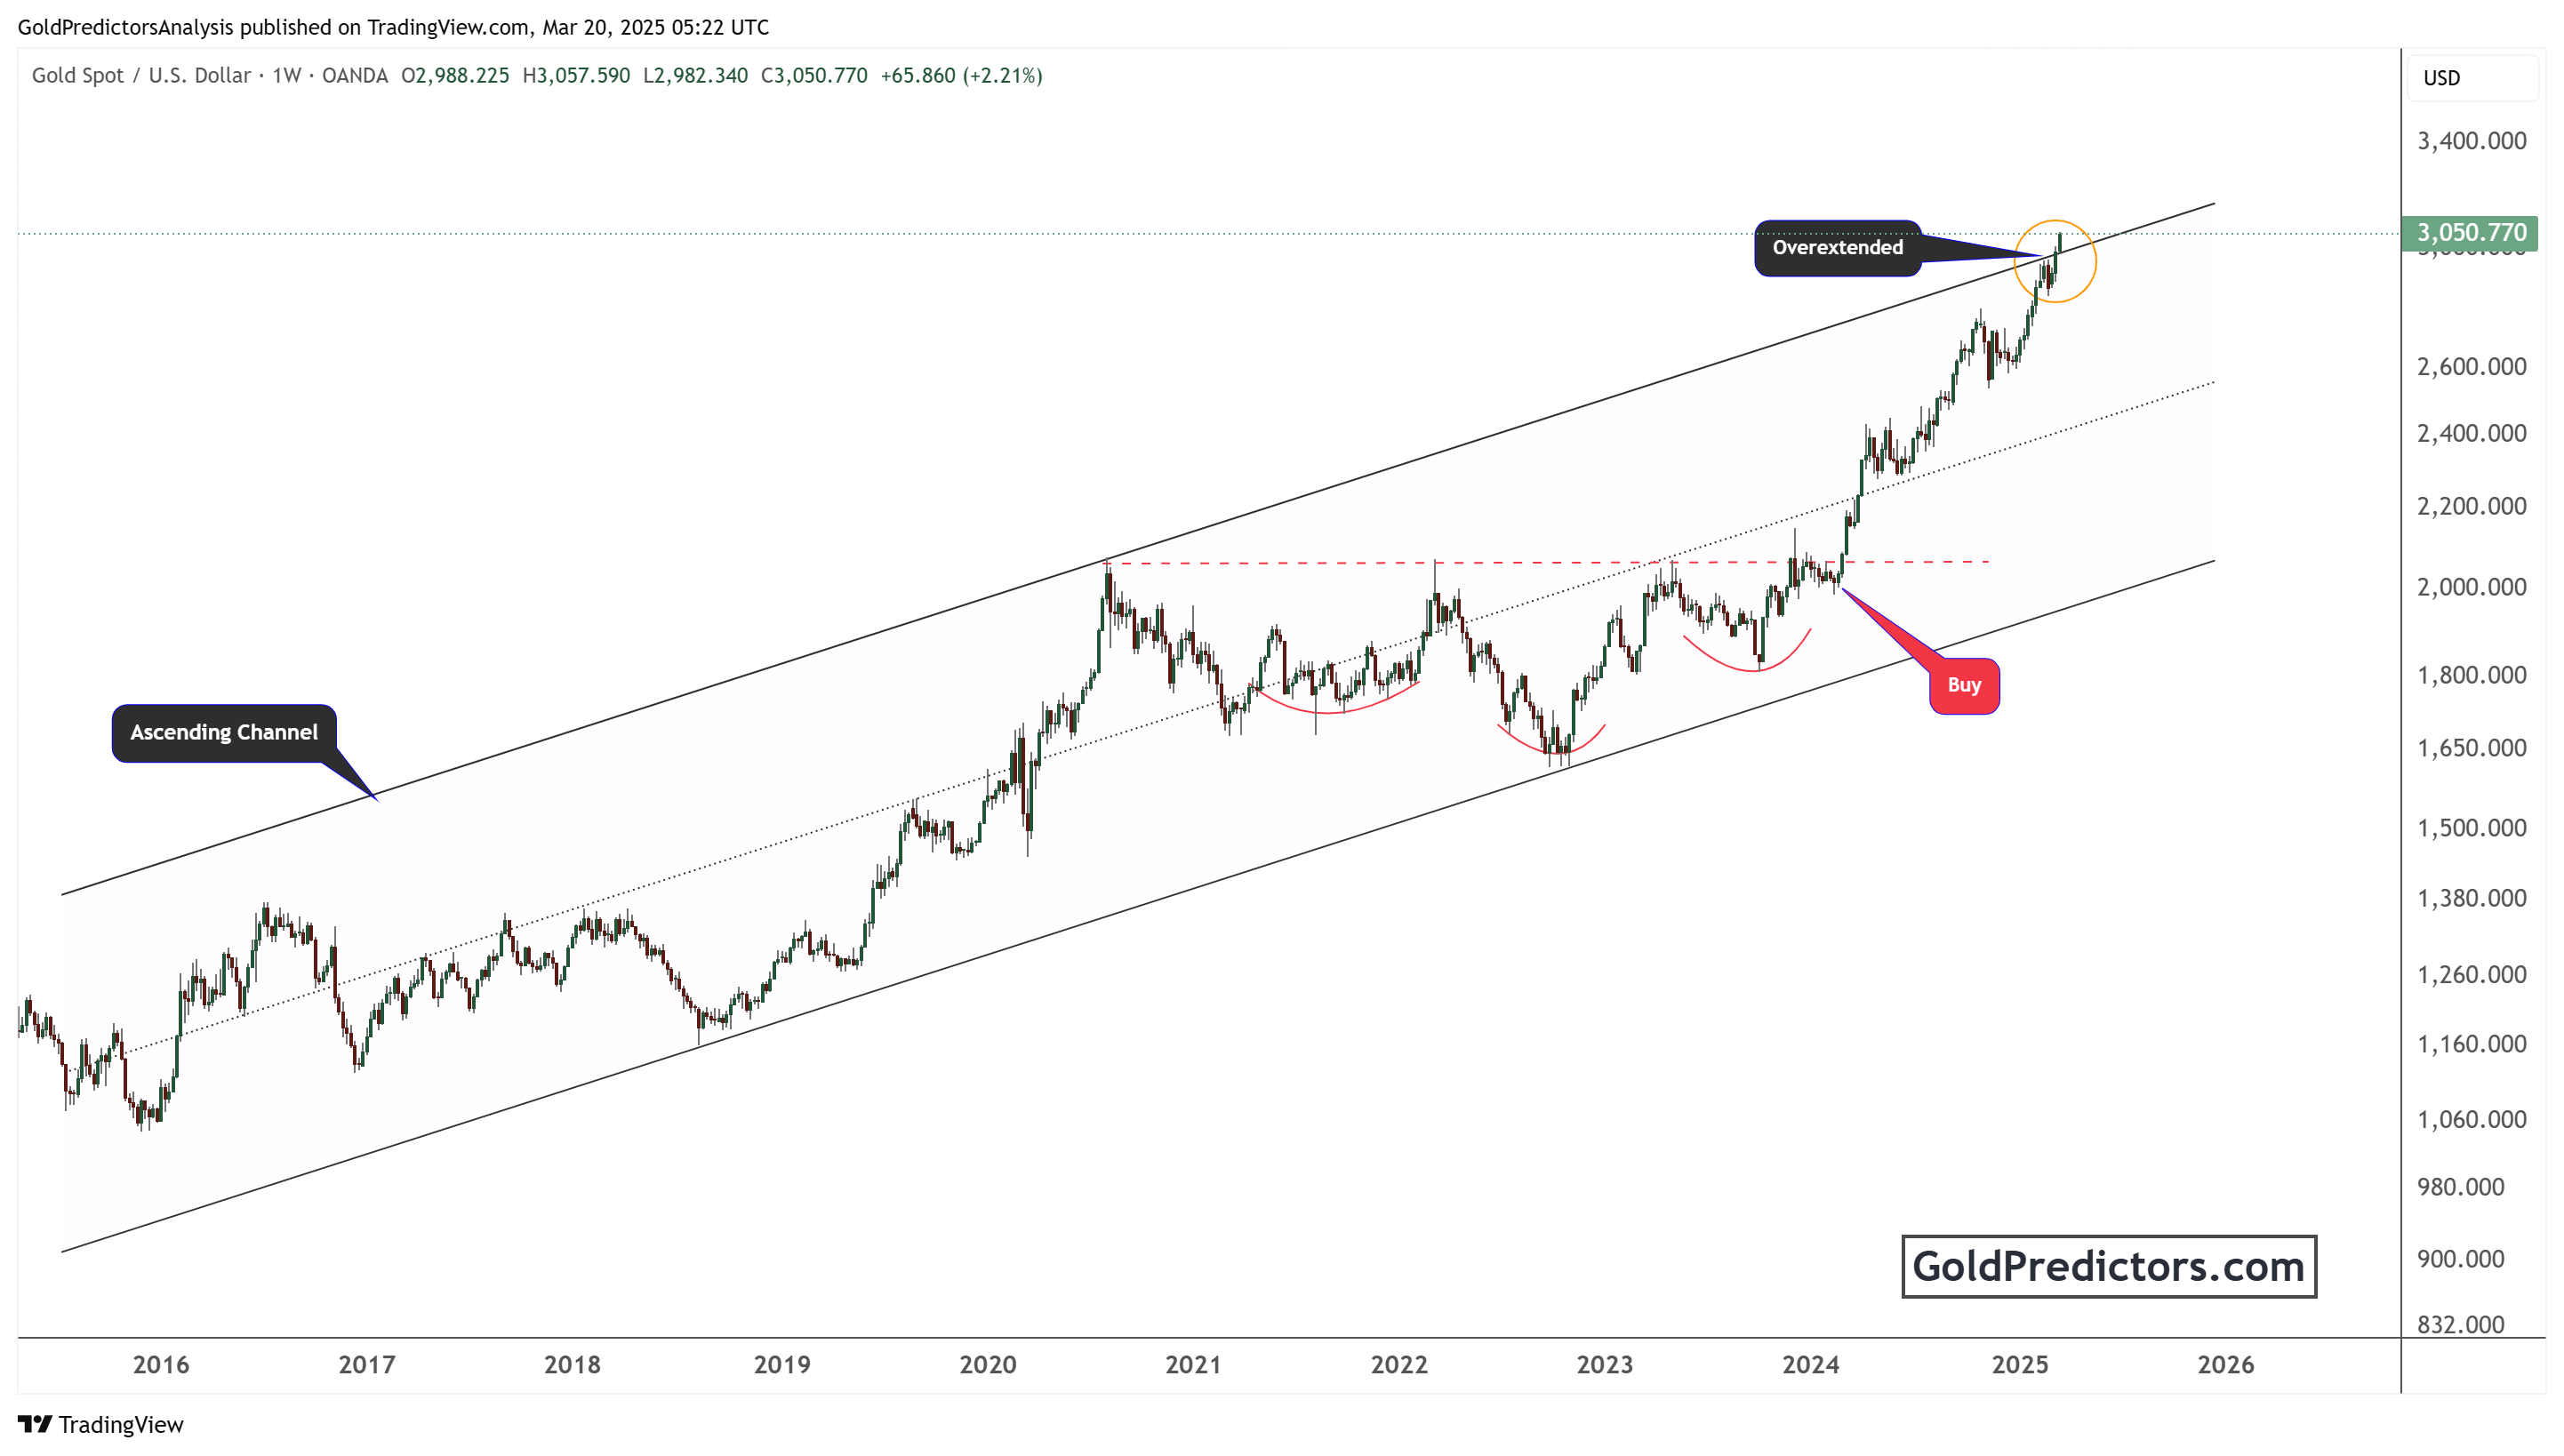
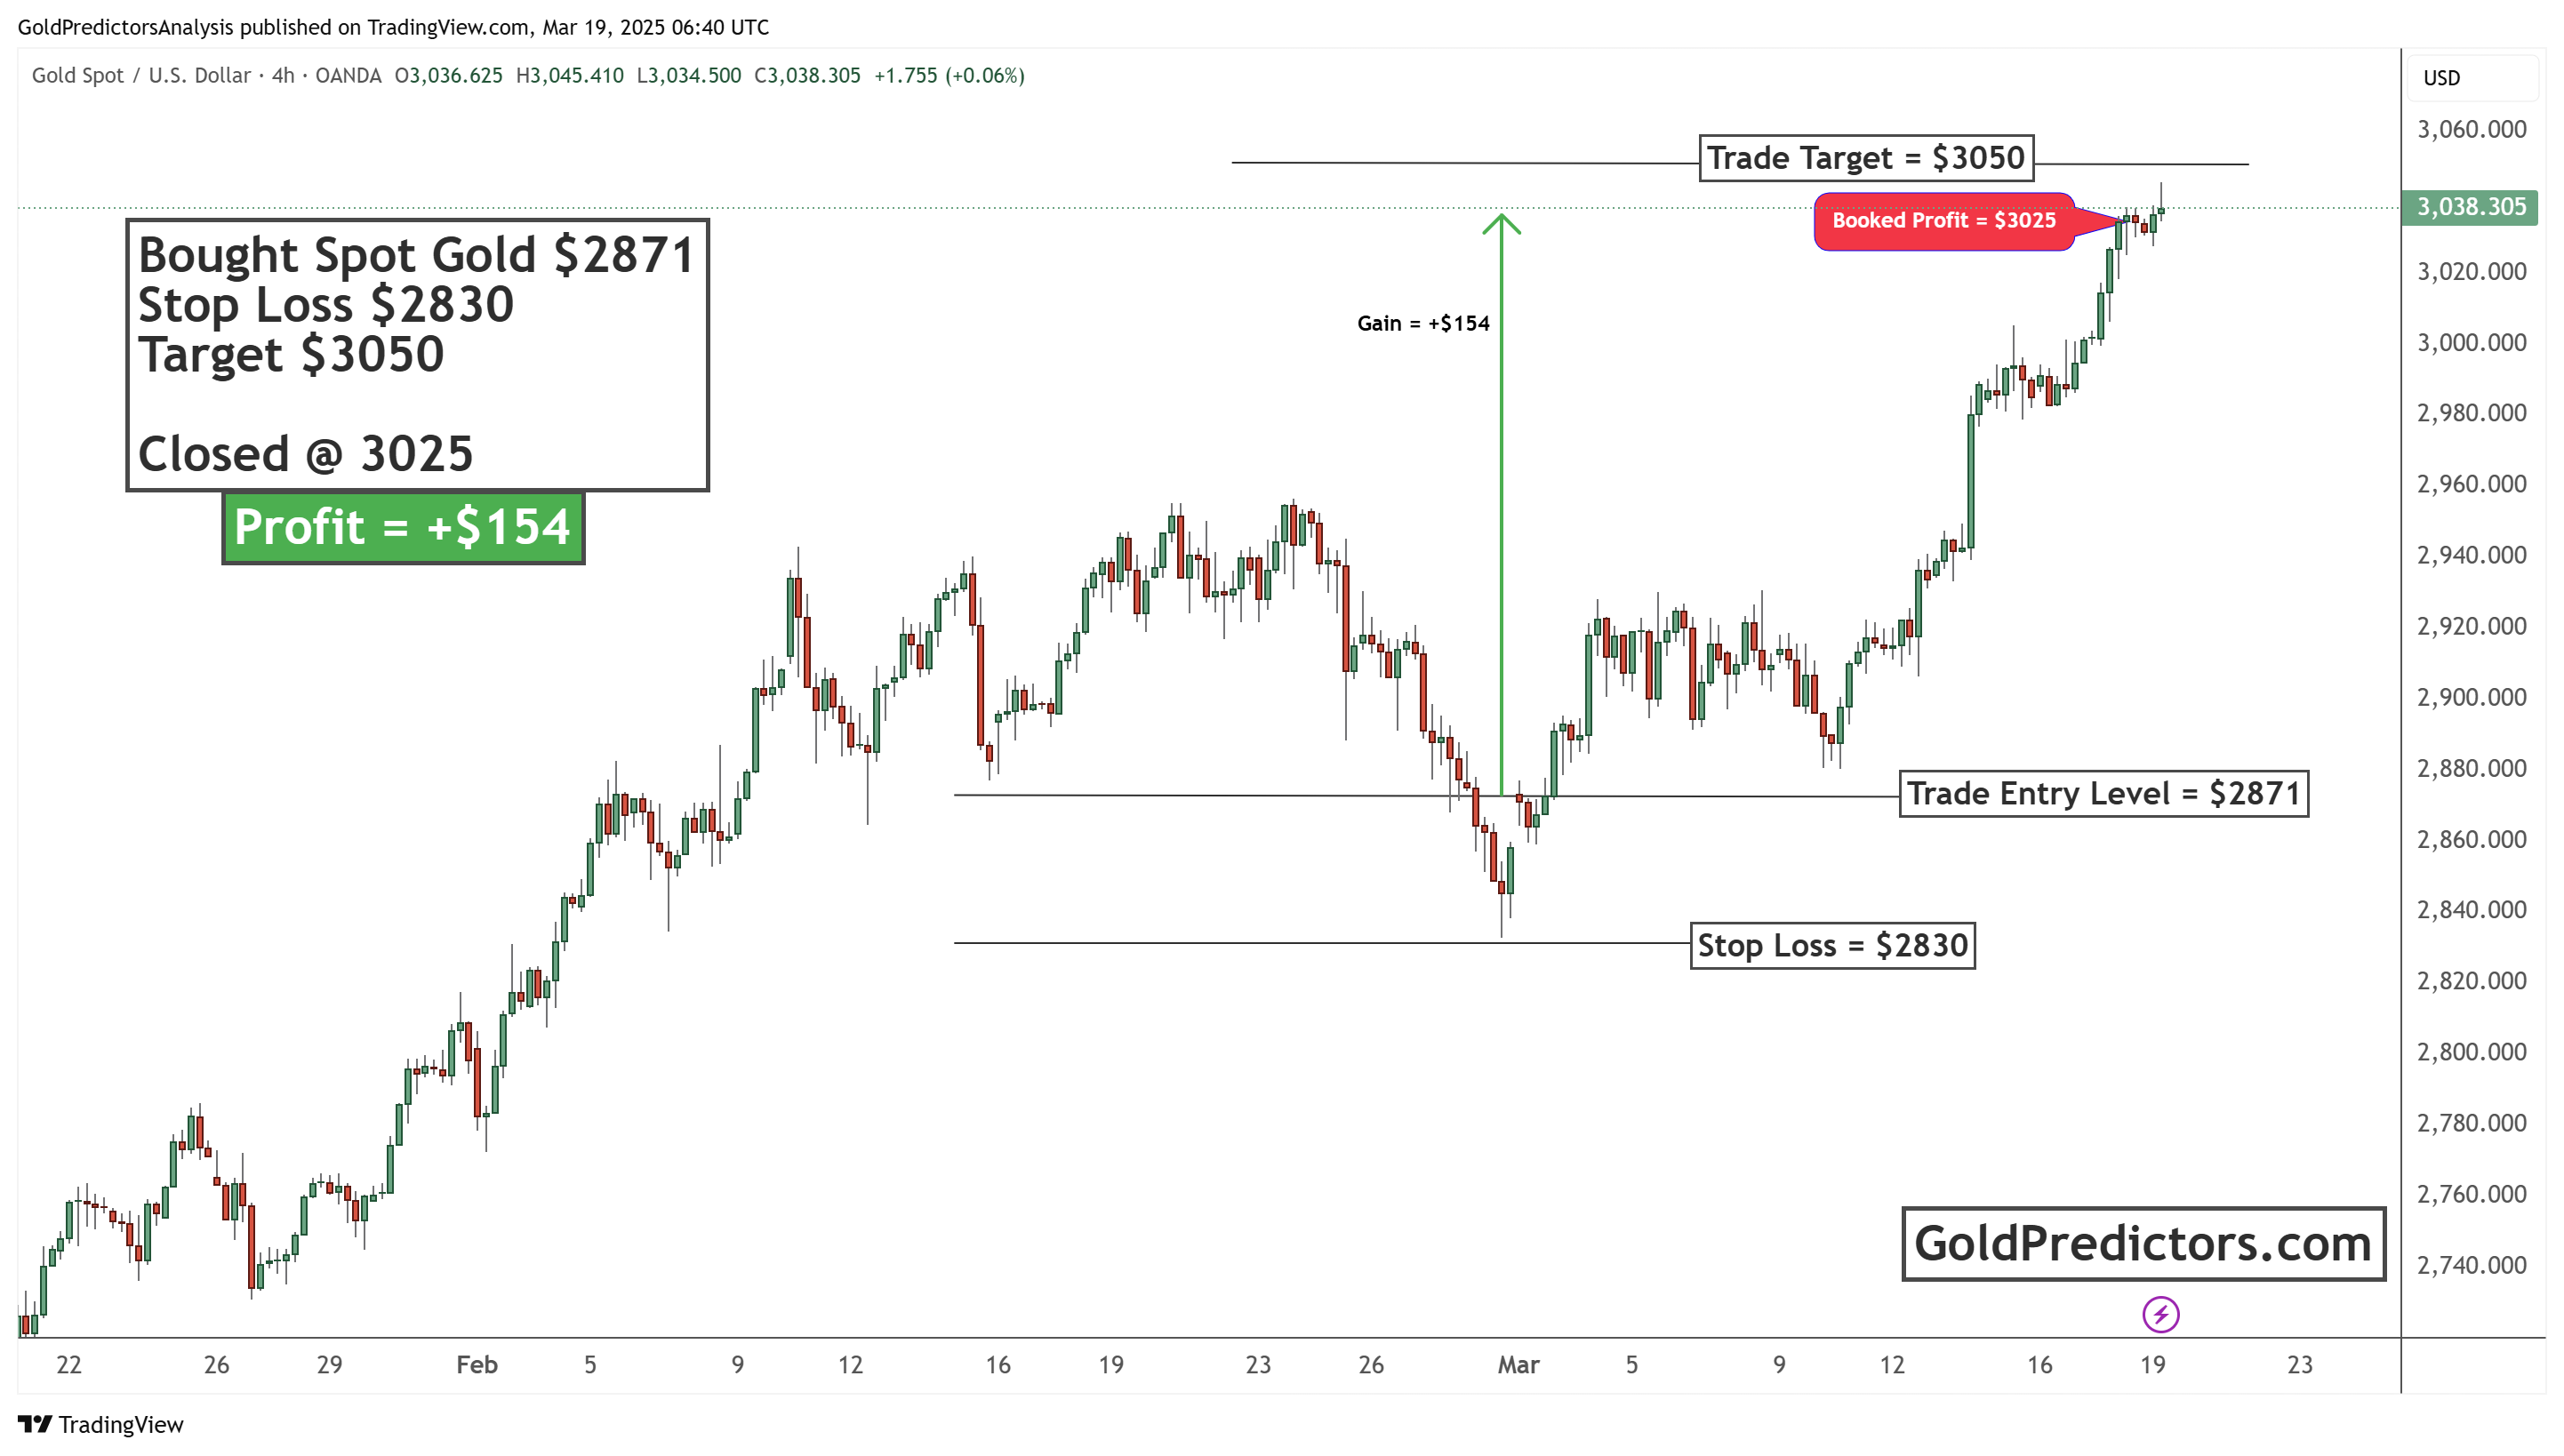
The chart below shows a successful gold trade by Gold Predictors. The trade was entered at $2,871, with a stop loss of $2,830 and a target of $3,050. The position was eventually closed at $3,025, securing a profit of $154 per ounce. This setup demonstrates the importance of strategic entry and exit points. Setting a stop loss controls the risk, and taking profit near the target maximizes gains. This trade was sent via WhatsApp to premium members and resulted in a profitable outcome.
Conclusion: What’s next for Gold Prices?
Gold’s price action suggests a strong bullish outlook, supported by historical patterns and technical breakouts. The long-term breakout from the cup and handle pattern indicates further upside potential. However, the short-term overextension within the ascending channel suggests that traders should be cautious of pullbacks.
If gold maintains its current momentum, it could reach new highs, possibly above $3,200. On the other hand, short-term corrections could provide new buying opportunities for long-term investors.
As global economic uncertainty continues, gold remains a valuable asset for investors looking for stability. To navigate the gold market in 2025, traders must monitor technical levels, trend lines, and market sentiment.
To receive gold and silver trading signals and premium updates, please subscribe here.


