


Gold Shows Strength Amid Fed Policy and Trade Uncertainty

Gold price exhibits strong volatility near record levels. This volatility is driven by economic data, trade uncertainty, and Federal Reserve policies following the Trump presidency. On Wednesday, gold prices dipped slightly as improved risk appetite shifted investors’ focus to equities. However, economic uncertainties in the US, stemming from Trump-era trade policies, have supported gold prices. Due on Wednesday, the Federal Open Market Committee (FOMC) policy decision has kept the market waiting for clarity on the direction of interest rates.
Fundamental Drivers of Gold Prices
Several macroeconomic factors are influencing gold prices. Improved stock market performance has diverted capital away from safe-haven assets like gold. However, President Trump’s policies are impacting the US dollar and creating significant uncertainty in the US economy. The Federal Reserve’s decision on interest rates remains a key driver. Despite this, the overall market structure remains strongly bullish. Gold could find strong support if the central bank signals prolonged rate cuts in 2025. Lower interest rates enhance gold’s appeal as a non-yielding asset, making it more attractive to investors.
The proposed US tariffs under former President Donald Trump’s policies have raised concerns about trade disruptions. Tariffs on essential goods, including computer chips, pharmaceuticals, steel, aluminum, and copper, could spark a resurgence of global trade wars. These economic disruptions may increase gold demand as a hedge against market volatility.
Recent US economic data has also highlighted the risks of a slowdown. Durable Goods Orders fell by 2.2% in December, and Consumer Confidence declined significantly in January. These indicators suggest a weaker economic outlook, increasing the likelihood of a dovish Fed policy, which could favor gold prices.
Technical Analysis: Gold Targets Key Resistance Levels
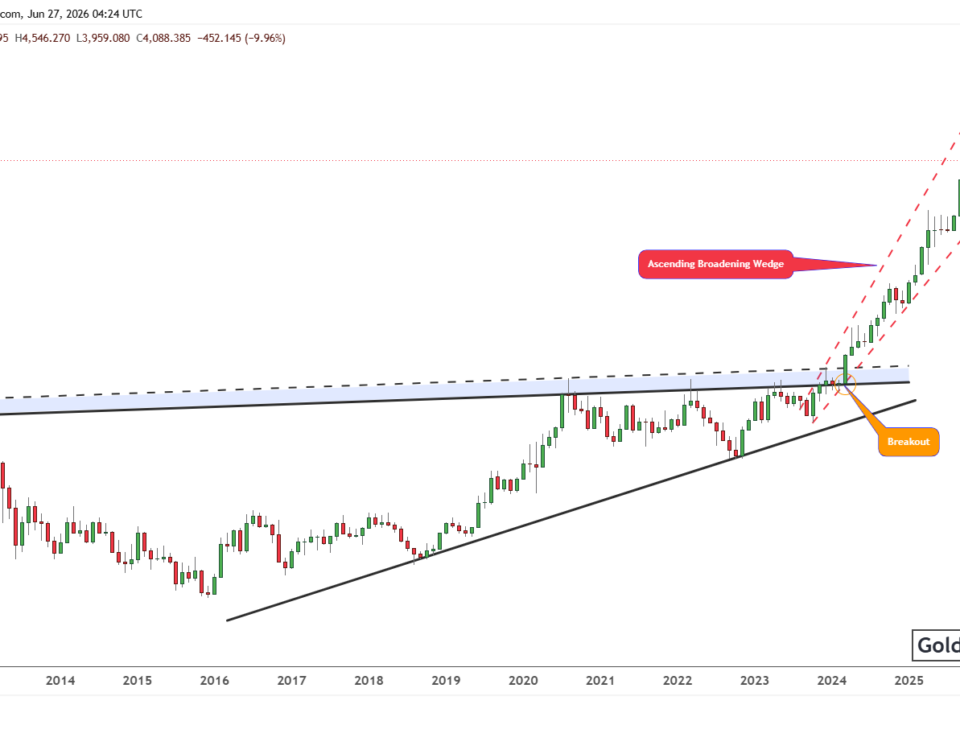
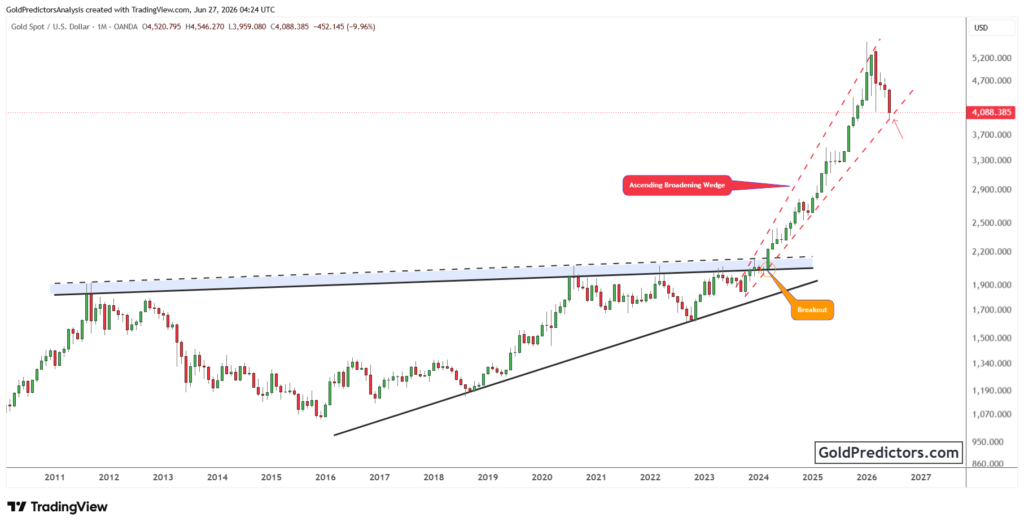
The daily chart shows gold’s price movement within an ascending broadening wedge, emphasizing a strong bullish trend. The price broke above the black trend line in September and retested the record levels in November and December, confirming solid support. The formation of double bottoms and ascending trends underscores the bullish momentum. Gold has rebounded from a key support zone near $2,730 and is now targeting higher levels, with a potential move toward $3,000. The current structure reflects positive momentum, with higher highs and higher lows suggesting sustained market strength.

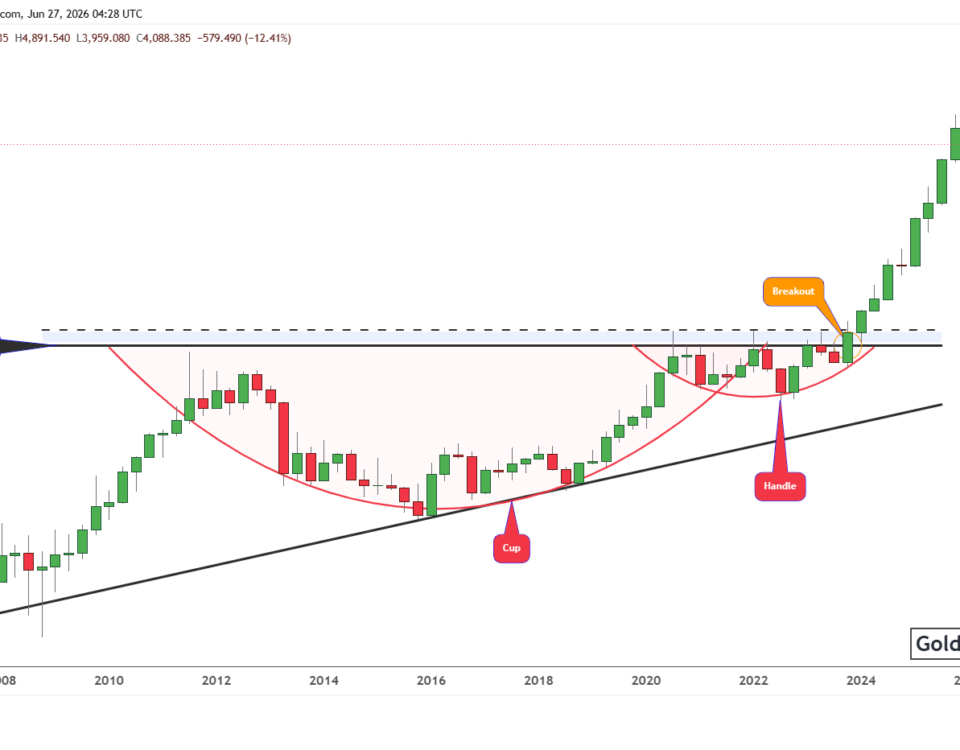
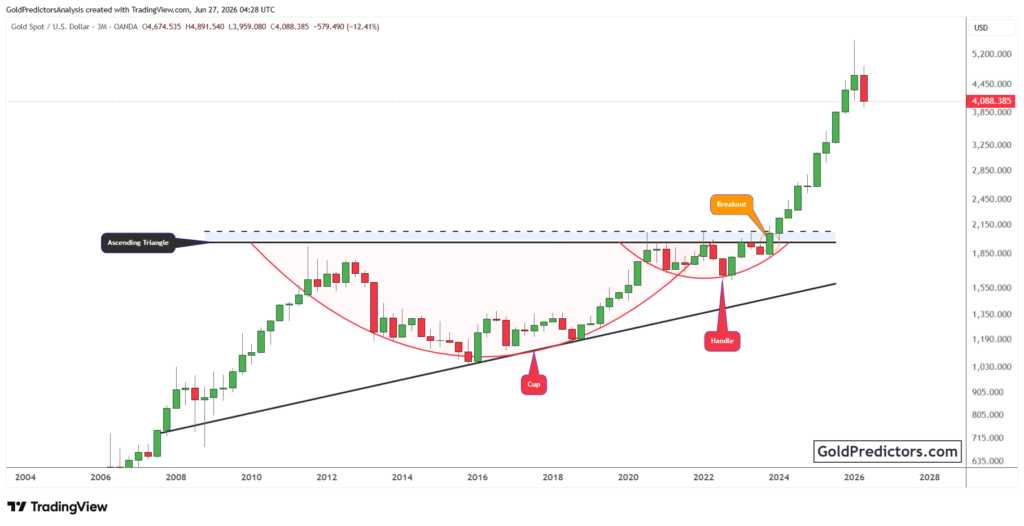
The chart below further reinforces the bullish outlook, highlighting gold’s long-term bullish trend with key patterns and breakouts. A base pattern formed in early 2023, leading to a breakout that initiated a strong upward move. Gold entered bullish consolidation phases after each rally, maintaining its upward strength. Another breakout in late 2024 confirmed the continuation of this bullish trend. The price currently trades near $2,758, testing resistance and showing potential for further gains. Each consolidation and breakout has contributed to sustained bullish momentum, supporting a positive outlook.

The Role of Cycles and Gold Predictors’ Insights
Gold Predictors identified January 15th, 2025 (plus or minus 72 hours), as a significant cycle low, accurately forecasting a turning point. The updates were delivered to premium members. The 4-hour chart confirms the cycle low on January 13th, after which gold rallied sharply. This cyclical approach highlights the importance of understanding market rhythms in predicting price movements.

Cycles play a critical role in gold price analysis, offering insights into potential highs and lows. This predictive framework helps traders and investors align their strategies with broader market trends.
Gold Predictors has provided actionable trade ideas to its premium members. For example, a recent trade recommended buying gold at $2,672 with a target of $2,719, resulting in a $47 profit per ounce. This trade highlights the effectiveness of combining technical and cyclical analysis for profitable outcomes. Another recent trade entry at $2,745 was also successful, although the price narrowly missed the $2,789 target by just a few dollars. Consequently, the trade was closed, and the focus has shifted to identifying better low-risk trade entries.

Conclusion
Gold prices remain influenced by a mix of fundamental and technical factors. While improved risk sentiment poses challenges, lower Treasury yields, a weaker dollar, and trade uncertainty support gold. Technical analysis suggests further upside potential, with key resistance levels in sight.
Gold Predictors’ insights into cyclical patterns and precise trade recommendations highlight the importance of a data-driven approach in navigating market volatility. As traders await the Fed’s policy decision, gold remains a focal point for those seeking stability and growth.
To recieve gold and silver trading signals and premium updates, please subscribe for premium membership.