


Gold Breaks Yearly Resistance: Is $3,000 the Next Target?

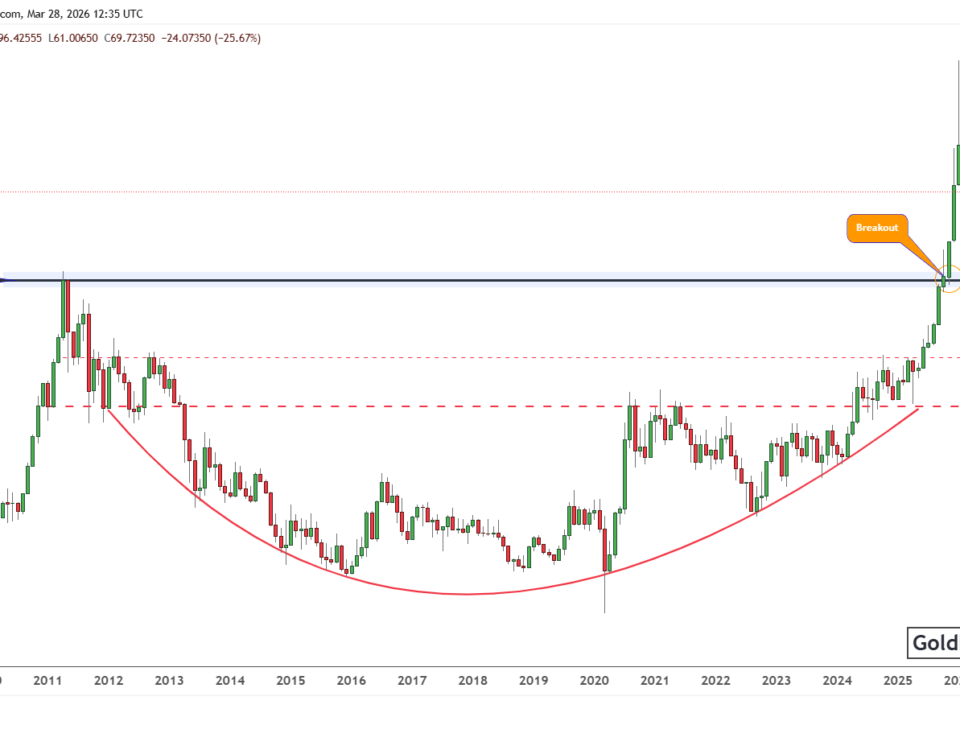
Gold (XAU/USD) prices have risen steadily, demonstrating resilience during global economic uncertainties. The yearly chart shows a significant breakout above a key trendline, with gold trading near $2,676 as of 2024. Investors are now evaluating whether this rally could continue, potentially pushing prices to $3,000 and beyond.
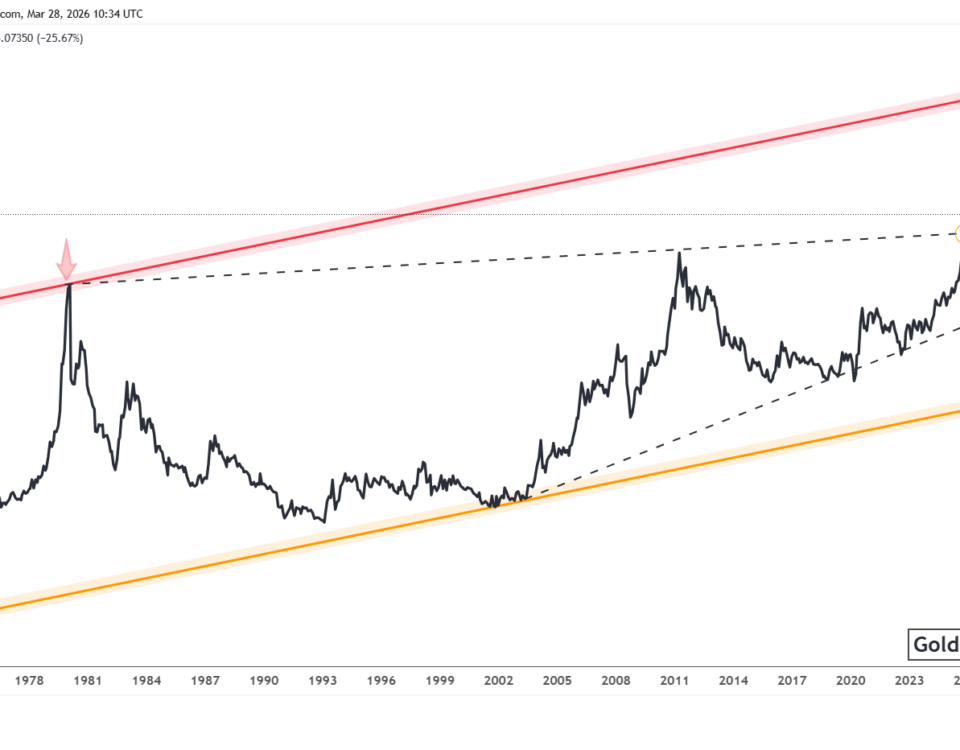
The breakout aligns with historical patterns in 1980 and 2011, where price shadows on the chart marked key reversals. However, unlike those instances, gold’s recent breakout reflects strong momentum supported by a mix of technical and fundamental factors. Let’s examine the key technical levels and market fundamentals shaping gold’s trajectory.
Gold Historical Patterns and Key Levels
The yearly chart reveals gold trading above its long-term ascending trendline, signalling a major breakout. Historically, gold reversed after forming extended upper shadows, as seen in 1980 and 2011. In 2024, gold has broken above this resistance without a significant shadow, indicating stronger bullish momentum.
- Resistance Levels: Gold’s immediate resistance lies near $2,900-$3,000. A sustained breakout above this range could accelerate the rally toward $3,500 or higher.
- Support Levels: The long-term trendline now acts as strong support for nearly $2,500-$2400.

Gold has overlooked overbought conditions during its bullish phases and continues to advance in cycles. However, short-term pullbacks are often used as opportunities to re-enter the market. Short-term cycles determine these pullbacks’ timing, providing ideal gold entry points. For example, the trade entries in 2024, aligned with short-term cycles, generated substantial profits. Each trade entry marked a key reversal, initiating a strong upward surge in gold prices.

Moreover, gold’s breakout coincides with increasing volume, highlighting robust demand. Historical analysis suggests that gold often enters a prolonged uptrend once it clears significant resistance levels. This supports the possibility of gold reaching new all-time highs.
Conclusion: Gold at a Crossroads
Gold’s yearly breakout above the long-term trendline marks a pivotal moment. The metal benefits from rising safe-haven demand due to global economic uncertainties. The Federal Reserve’s potential shift in monetary policy and geopolitical tensions add to gold’s bullish case.
The Federal Reserve decisions will be key in shaping gold moves. Strong resistance near $3,000 could be a psychological barrier, but a breakout above this level would confirm a long-term uptrend.
Traders should monitor key levels and macroeconomic developments closely. While gold’s technical and fundamental outlook remains bullish, caution is essential as overbought conditions may trigger short-term corrections. If history repeats, gold’s breakout could lead to a significant rally, making $3,000 a realistic target for 2025.
Subscribe here to receive gold and silver trading signals along with premium updates.
