


Gold Consolidation Continues Amid Critical Inflation and Fed Signals

The Bureau of Economic Analysis is about to release the PCE Price Index data, which carries significant implications for the gold market. Analysts forecast the core PCE to rise 0.3% month over month and 2.8% year over year. These signs of persistent inflation could strengthen the US Dollar (USD). A stronger USD often weighs on gold prices, increasing the opportunity cost of holding the non-yielding metal. Rising inflation may influence Federal Reserve decisions. This could lead to speculation on monetary policy adjustments, further pressuring gold prices.
The Federal Reserve’s cautious stance on interest rate changes adds another layer of uncertainty to the gold market. Markets remain undecided about a potential rate cut at the next policy meeting, with inflation trends as a critical determinant. If inflation data exceeds expectations, it could reduce the likelihood of a rate cut. This would keep the USD strong and suppress gold demand. On the other hand, if inflation shows signs of cooling, it could weaken expectations for tighter monetary policy. This may potentially benefit gold as a safe-haven asset.
The simultaneous release of other economic data, such as durable goods orders and GDP estimates, further complicates market conditions. Reduced liquidity due to the Thanksgiving holiday may amplify price swings in both the USD and gold. Gold may find support if the PCE data indicates higher inflation and weaker consumer spending. Investors could turn to gold as a hedge against economic uncertainty. This mix of factors underscores the need for traders to monitor inflation data and its broader economic implications closely.
Gold Consolidation within Ascending Channels
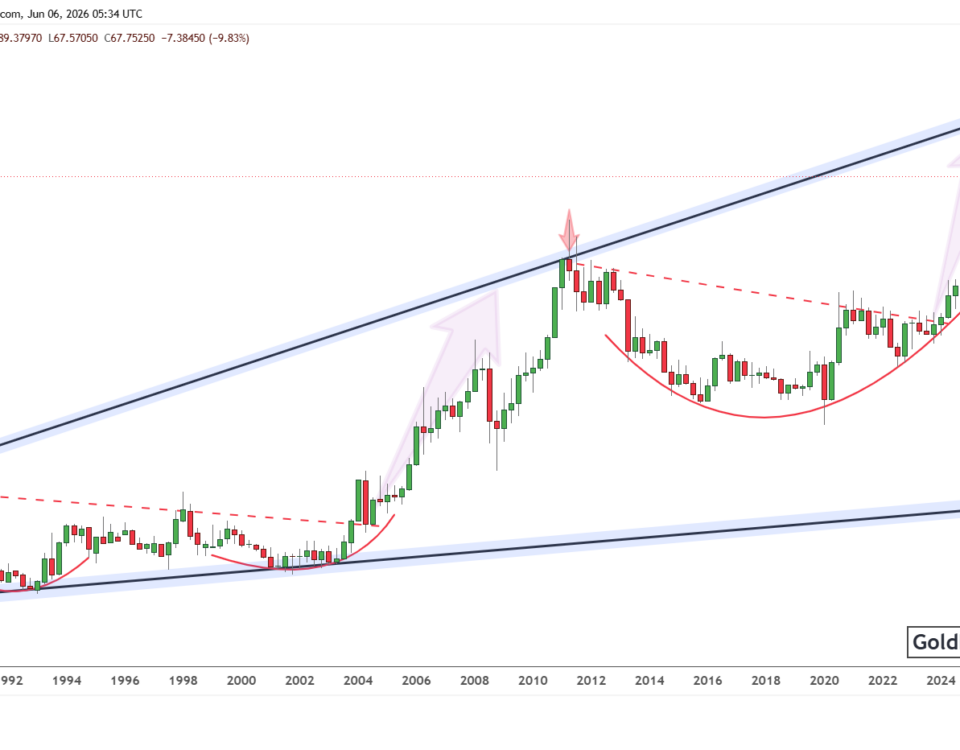
This weekly chart for gold shows price consolidation within the black ascending channel. The price is near the strong resistance level of around $2,720. The recent peak touched the upper boundary of the broader red ascending channel. This is the significant long-term resistance in the gold market. A correction happened after this peak, bringing the price down to the lower boundary of the black channel. This support zone, intersecting with a key trend line, indicates potential for a rebound. If consolidation continues, the price may oscillate between the marked resistance and support zones. Further upside is possible if a breakout exceeds the $2,720 level toward the $2,800 target.

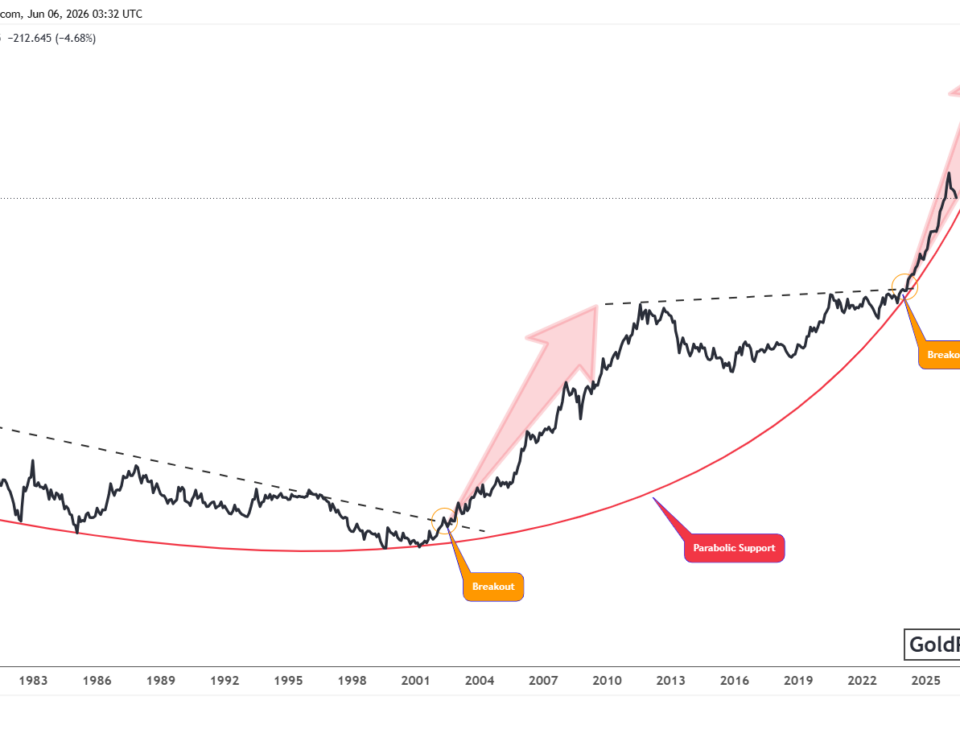
The daily chart below illustrates the black ascending channel to understand the broader outlook better. The price trades within this ascending channel, with strong resistance identified near $2,790. A sharp decline followed upon reaching this resistance level. The price found support at the channel’s lower boundary, around $2,560. The intersection of key trendlines marks this level, as highlighted in the circled area. After rebounding from this support, the price has entered a consolidation phase, currently hovering near $2,640. This consolidation reflects market indecision, with the potential for further price swings within the channel. A breakout in either direction is likely to dictate the next significant move.

Conclusion
In conclusion, the release of the PCE Price Index data, alongside other critical economic indicators, presents significant implications for the gold market. Persistent inflation could strengthen the US Dollar, adding pressure to gold prices. On the other hand, signs of cooling inflation may revive gold’s appeal as a safe-haven asset. The Federal Reserve’s cautious stance and the market’s uncertainty regarding potential rate adjustments further complicate the outlook. Technically, gold is consolidating within an ascending channel, with key resistance near $2,720 and $2,790. The support lies around $2,560. Reduced market liquidity due to the Thanksgiving holiday may amplify price volatility. Traders must closely monitor technical levels and broader economic developments to anticipate the next major move.
To receive premium updates and trading signals for gold and silver, subscribe using the link below.
