


Gold Technical Trends Point to Further Gains

Gold prices have surged to a record high above $2,600 per troy ounce. This surge is fueled by the Federal Reserve’s 50-basis-point interest rate cut. While the initial reaction to the Fed’s move drove prices upward, concerns are emerging about the sustainability of this rally. It is to be noted that higher prices have begun to dampen physical demand, particularly in China. In July, China’s gold imports dropped to their lowest level in two years, which signals weakening demand for the metal. The slowdown in jewellery demand and a lack of central bank purchases suggests that the physical market may struggle to support further price gains. However, the gold technical trends indicate further upside potential.
Gold’s future depends on what the Federal Reserve decides to do with interest rates. Markets expect the Fed to cut rates by 0.50% by the end of the year, either in November or December. If this happens, gold prices might keep rising. As long as people believe more rate cuts are coming, gold could stay strong. Many investors are still buying gold because of economic uncertainty and loose monetary policies. The lower demand for physical gold and doubts about more rate cuts make the outlook unclear. If the Fed only cuts rates a little, gold’s price rise could slow down. However, gold remains a popular choice for those looking for a safe investment, primarily to protect against inflation and currency value drops. In the short term, gold’s path will likely depend on the Fed’s decisions. However, weak physical demand might eventually limit its growth.
Gold Technical Trends
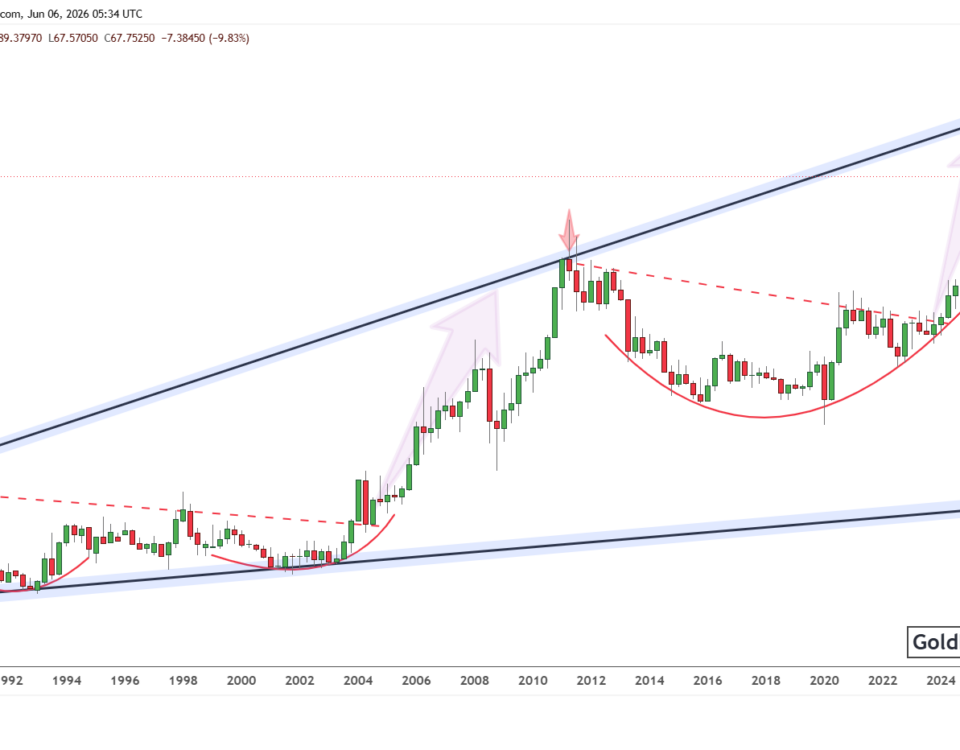
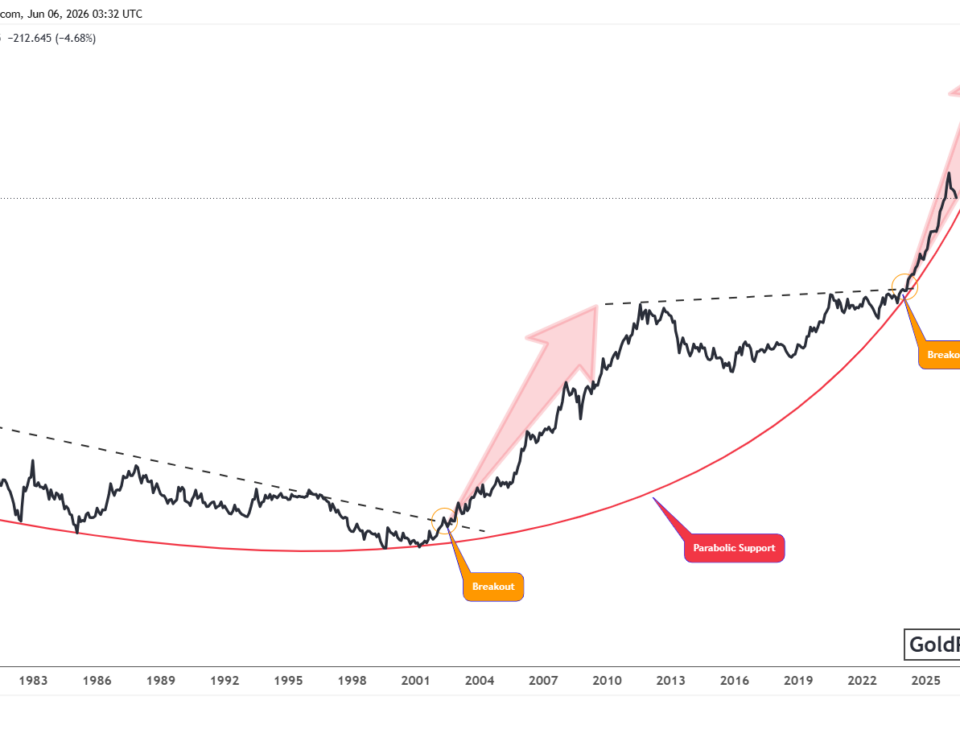
From a technical perspective, the gold market is on its way towards its primary target of $3,000 after breaking the long-term pivot of $2,075. The chart below was first examined and shared with members in 2022 when prices were lower. The bottom was expected at the inflection point of $1,680, with the possibility of breaking higher above $2,075. The gold market broke above $2,075 and initiated this strong rally. The chart has been updated with fresh data, and the price is following the exact path as expected. This indicates that the gold market is likely to continue higher. The emergence of an inverted head and shoulders pattern before the breakout above $2,075 further strengthens the bullish outlook and suggests that gold trends toward the primary target of $3,000.

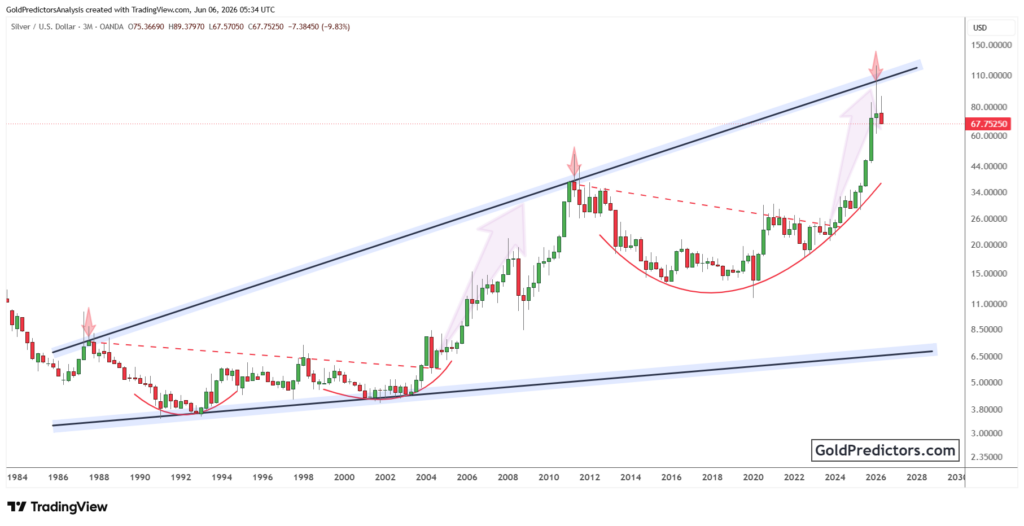
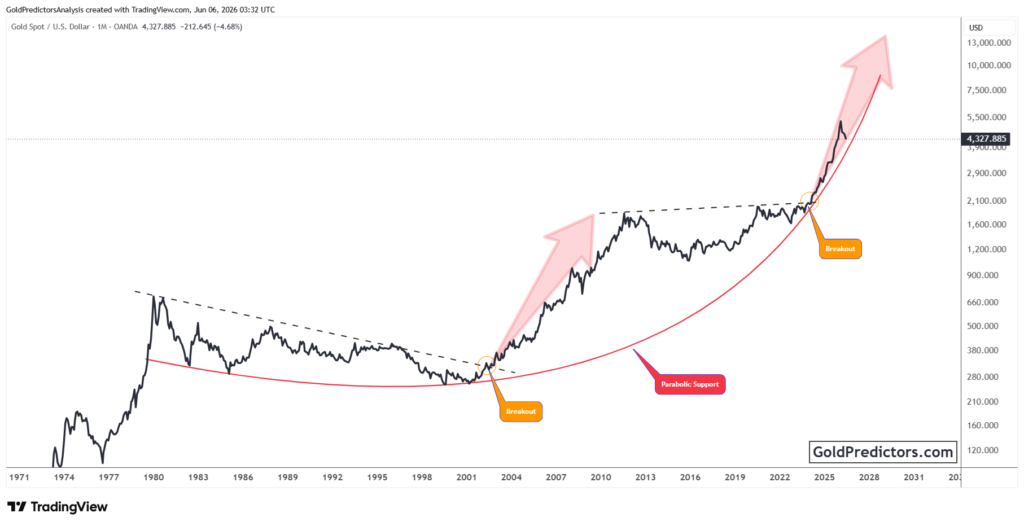
On the other hand, before the Federal Reserve interest rate decision, it was clearly highlighted that the gold market might initiate strong moves in both directions due to increased volatility, but the actual move, after a few hours of fluctuations, would likely be higher. The chart below shows the price fluctuation during the Fed meetings. These fluctuations formed a symmetrical broadening wedge pattern. After a strong consolidation, the price broke higher and is now on its way towards technical target of $3,000.

Bottom Line
In conclusion, gold prices have surged to record highs fueled by the Federal Reserve’s rate cuts and economic uncertainty, with technical indicators suggesting a continued upward trajectory toward the $3,000 target. However, weakening physical demand, particularly in China, and the potential for fewer future rate cuts introduce uncertainties about the sustainability of this rally. While gold remains a favored safe-haven asset, the future path will largely depend on further Fed actions and market reactions to global economic conditions. The balance between technical momentum and fundamental demand will shape the outlook for gold in the coming months.
Subscribe to the link below to receive gold and silver trading signals and premium updates.
