Gold Builds Momentum for Potential Rally | Gold Predictors - Forecasting Gold Prices

New York

London

Sydney

Tokyo

Log In

  • Register
  • Lost your password?
gold predictorsgold predictorsgold predictorsgold predictors
  • HOME
  • ABOUT US
    • About Us
    • Social Networks
    • Industry Links
    • Testimonials
  • RESEARCH
    • Scientific Trade Strategies
    • Gold Hub
    • Gold Importance
    • Silver Importance
  • GOLD HUB
  • GOLD ANALYSIS
    • Gold Analysis
    • Technical Analysis
      • Trend Identification
      • Phase Identification
      • Important Levels
      • Volatility Measurement
    • Gold Cycle
      • Short Term Cycles
      • Medium Term Cycles
      • Long Term Cycles
    • Price Action Analysis
      • Phase Identification
      • Historical Pattern Identification
      • Candlestick Pattern Identification
    • Fundamental Analysis of Gold
    • Gold Related Markets Analysis
    • Gold Seasonal
  • TRADING METHODOLOGY
    • Gold Analysis
      • Technical Analysis
      • Gold Cycle
      • Price Action Strategy
      • Fundamental Analysis
      • Gold Related Markets Analysis
      • Gold Seasonal
    • Measure Signal Strength
      • Weak Signal
      • Strong Signal
      • Confirmed Signal
    • Trading Decision
    • Trading Rules
      • Basic Trading Rules
      • Gold Predictors Trading Rules
    • Trade Examples
    • Performance
  • LIVE CHARTS
  • MEMBERSHIPS
    • Free Membership
    • Premium Membership
    • SignUp
  • MEMBERS AREA
    • Free Article
    • Premium Article
    • Trading Signals
    • Long Term Signals
    • Forex Reports
    • Crypto Reports
  • FOREX REPORTS
  • HELP
    • FAQ
    • Contact Us
Login / Register

Gold Builds Momentum for Potential Rally

0
Published by admin at September 4, 2024
Categories
  • Free Articles
Tags
gold daily

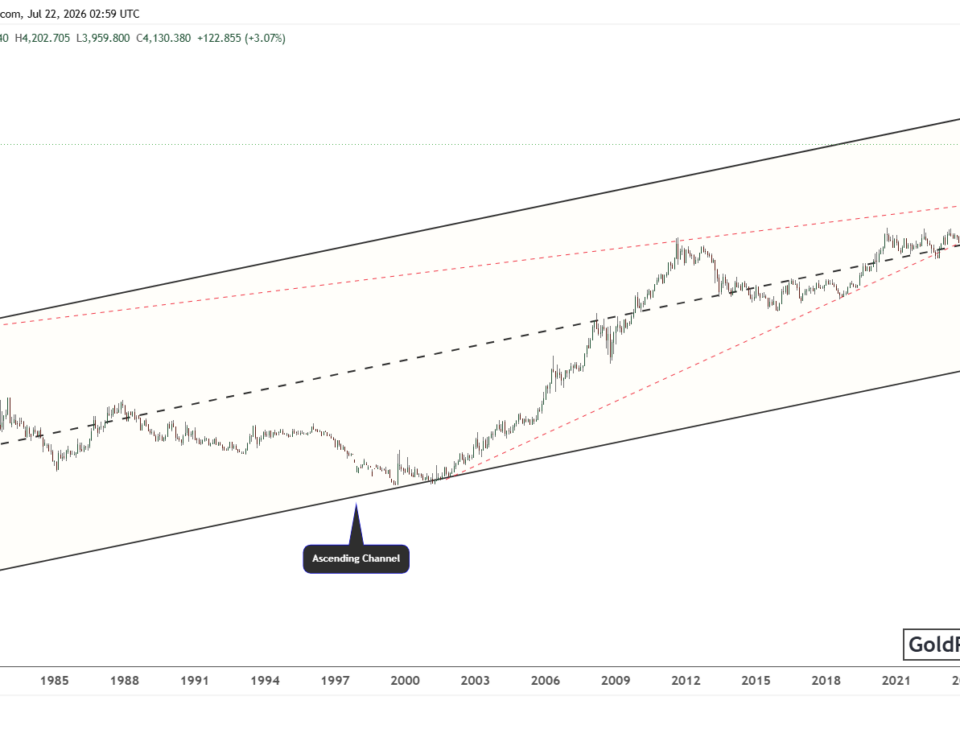
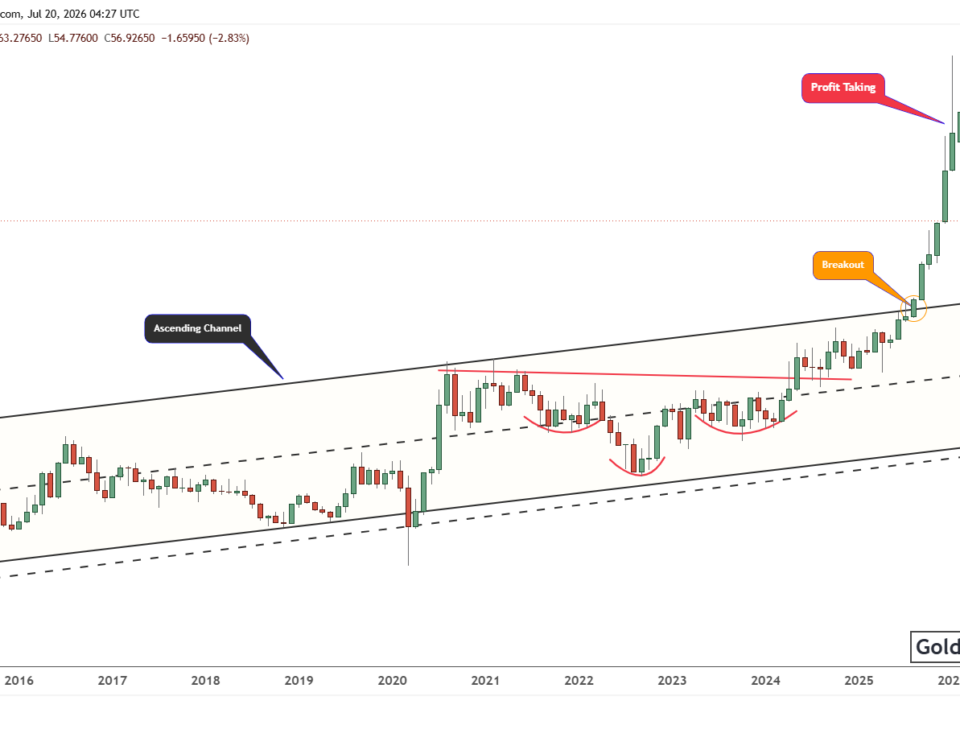
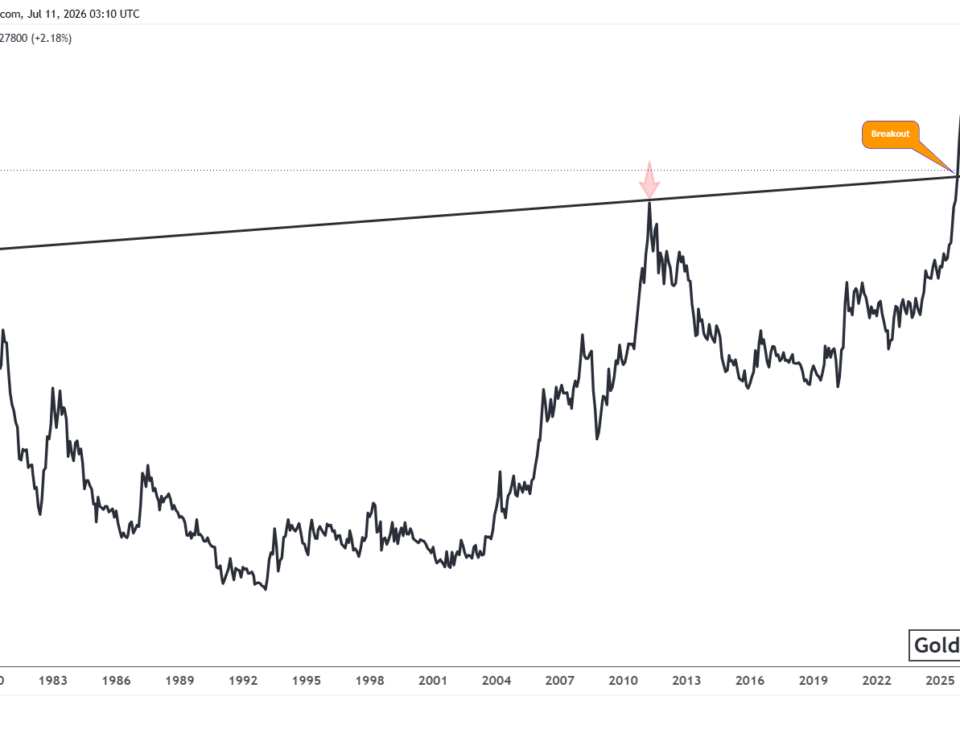
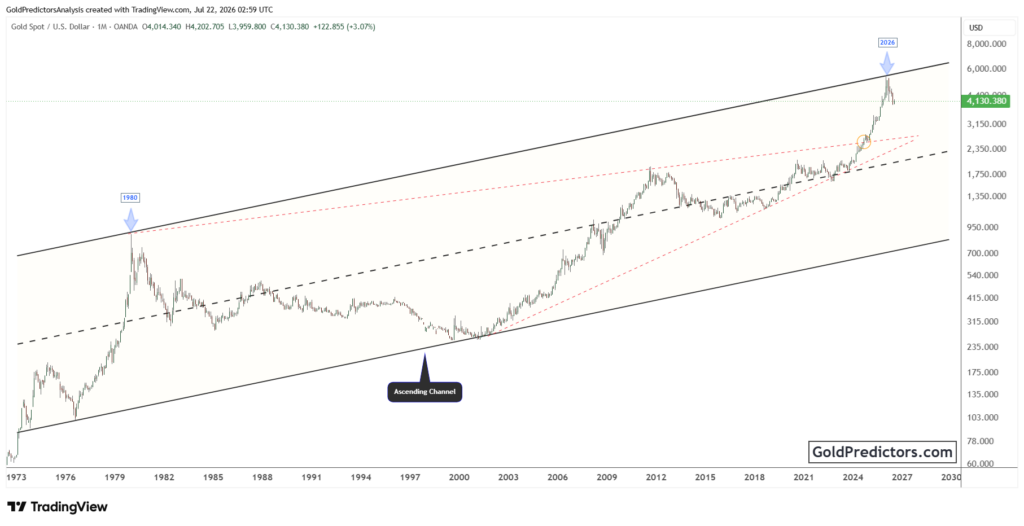
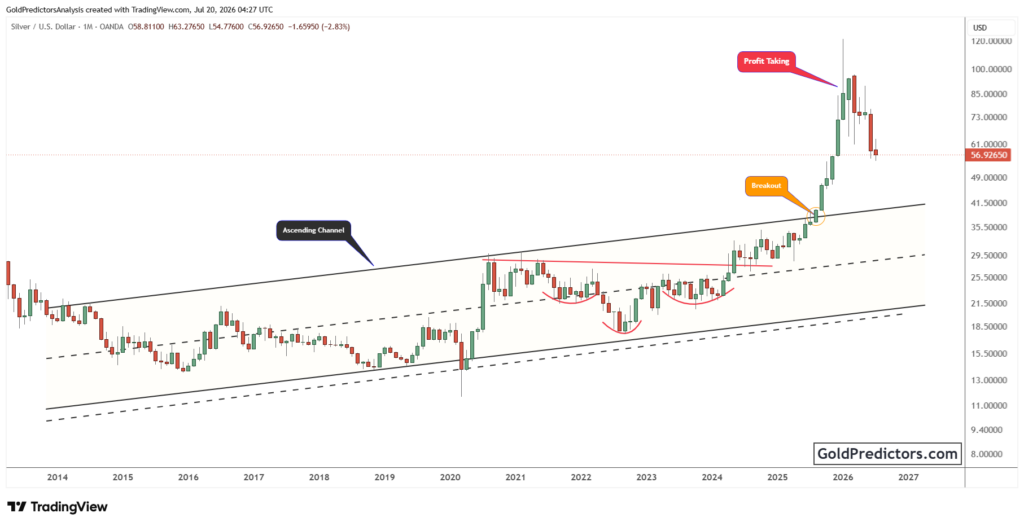
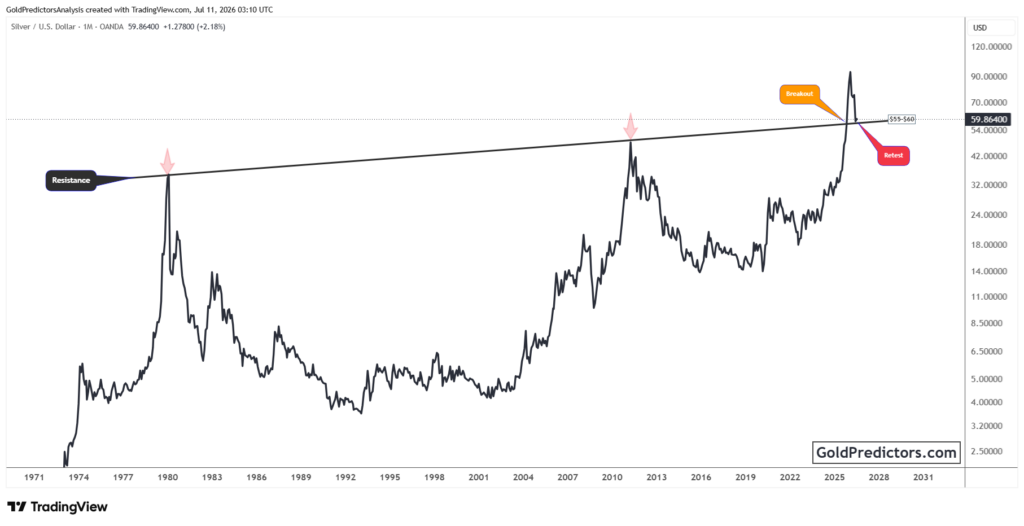
Gold has rebounded strongly from the key support level of $2,470, which we previously identified as a significant weekly support. This level has effectively held during recent price fluctuations between $2,470 and $2,530, and the current bounce reinforces its strength. The daily line chart below shows that the gold market has broken out of a rising channel, indicating a potential shift towards higher prices. The main question now is whether gold will make a minor correction down to $2,440 or if it has already initiated a stronger rally targeting $2,700 as the initial resistance.

gold daily

The primary target for this breakout, which started from $2,075, remains at $3,000, suggesting that gold is on track to reach this level soon. The ascending broadening wedge pattern highlights strong volatility, and recent consolidations suggest that gold is building pressure for a potential breakout higher.

Investors might consider buying during this correction, with $2,700 as the initial resistance and $3,000 as the primary target. The $2,470 level continues to act as a crucial support, underpinning the bullish outlook for gold.

To receive gold and silver trading signals and premium updates, please subscribe using the link below.

Premium Membership

Related posts

silver pattern
May 9, 2025

Silver Bullish Patterns Signal Move Toward $50


Read more
gold pattern
May 8, 2025

Gold Breaks Multi-Decade Resistance as Gold/Silver Ratio Nears Historic Turning Point


Read more
gold pattern
May 7, 2025

Gold Price Breakout 2025: Long-Term Patterns Point to $4,000 and Beyond


Read more

Comments are closed.

ABOUT US

  • About Us
  • Social Networks
  • Industry Links
  • Testimonials
  • Terms & Conditions

TECHNICAL ANALYSIS

  • Technical Analysis
  • Trend Identification
  • Phase Identification
  • Important Levels
  • Volatility Measurement

CYCLE ANALYSIS

  • Gold Cycle
  • Short Term Cycles
  • Medium Term Cycles
  • Long Term Cycles

PRICE ACTION ANALYSIS

  • Price Action Analysis
  • Phase Identification
  • Historical Pattern Identification
  • Candlestick Pattern Identification
© 2017 Gold Predictors. All Rights Reserved.
  • Remember Me
    Lost your password?
    Dont have an account?Sign Up