


Gold Market Momentum: Rallying from Strong Support, Eyeing New Highs
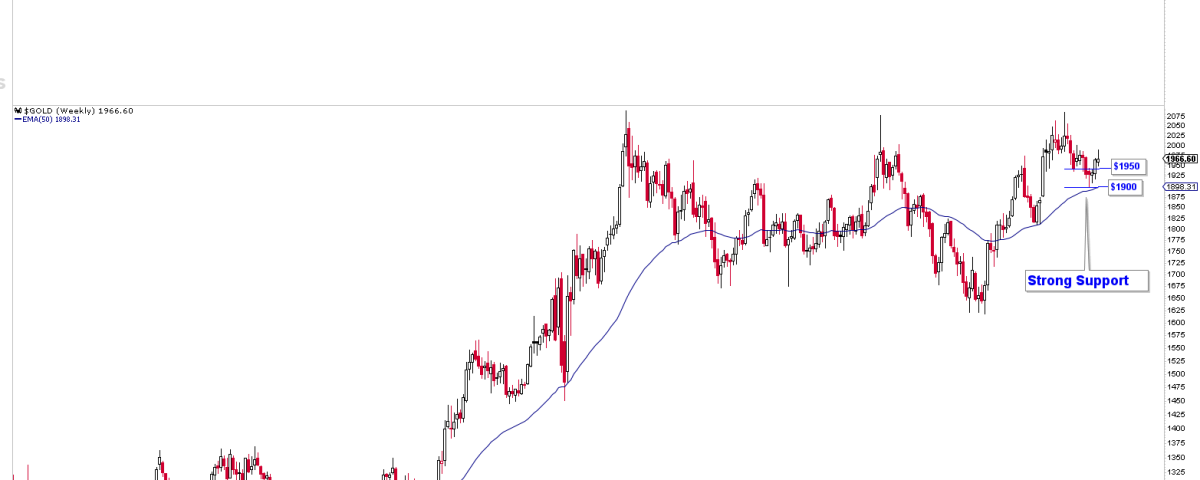
In line with our prior discussions, the gold market has recently demonstrated some intriguing developments. Earlier, we had anticipated a dip in the gold market towards the $1900-$1950 range, followed by a notable rebound. This prediction was proven accurate, with the gold market beginning its rally from the bottom of $1890.
In last week’s analysis, we underscored a swift reversal from the 50-week moving average as illustrated in the attached chart. This development suggested that the market was primed for a continued rally in the subsequent weeks, and indeed, the gold market did not disappoint. It surged forward this week, meeting our expectations and illustrating the accuracy of our predictive analysis.

What is Next In Gold?
However, this rally has not been without its challenges. The gold market is presently encountering significant resistance at $1980. To surpass this obstacle and continue towards higher levels, a crucial weekly close above the $1970 mark is necessary. Interestingly, this figure isn’t arbitrary; the $1970 level corresponds to the 23.6% Fibonacci retracement level from the recent gold bull run, signifying its importance within the trading framework.
The Fibonacci retracement, a popular technical tool among traders, helps identify potential reversal points in the market. When used in conjunction with other indicators, it can provide valuable insights into market trends. In this context, the $1970 mark, representing the 23.6% retracement level, is a key threshold for the gold market to breach to maintain its upward trajectory.
As we look ahead, the trajectory of the gold market appears promising. With the rally pushing against the strong resistance of $1980, the market shows no signs of a significant downturn. Indeed, should the gold market close above the pivotal $1970 level, it could be a clear indicator of further upward momentum.
Such a trend, should it materialize, could have profound implications for both short-term traders and long-term investors. For short-term traders, it might provide opportunities for profits if the rally continues as expected. Meanwhile, for long-term investors, a continued rally could further reinforce the status of gold as a safe-haven asset, offering protection against market volatility.
Conclusion
In conclusion, the gold market’s journey from the $1900-$1950 support level up toward the resistance in $1980 offers an intriguing case study in technical market analysis. The market’s performance not only validated our previous forecasts but also underlined the role of technical indicators such as the 50-week moving average and Fibonacci retracement levels. Moving forward, the $1970 close will be a key factor in determining whether the market will continue to scale new heights. The coming weeks promise to be an exciting period for market watchers and participants alike.
