


Gold Constructing Bullish Momentum
Due to economic uncertainty, inflation, and ongoing geopolitical tensions, gold prices continue to rise and construct bullish momentum. During periods of economic uncertainty, investors favor gold as a safe-haven asset. However, during periods of high inflation, gold is utilized as a hedge against price increases. Additionally, geopolitical tensions influence the price of gold, which is currently viewed as a stable investment. The price struggled at the strong resistance of $1,923 and settled at $1,925.75 by the end of the week. This level is regarded as resistance, but the primary target for spot gold still remains between $1,975 and $2,000 as the nearest-term resistance. A break above $2,075 would be considered the most significant breakout of the century. This breakout will be the clue for much higher prices in the future.
Investigating the Gold Bullish Momentum
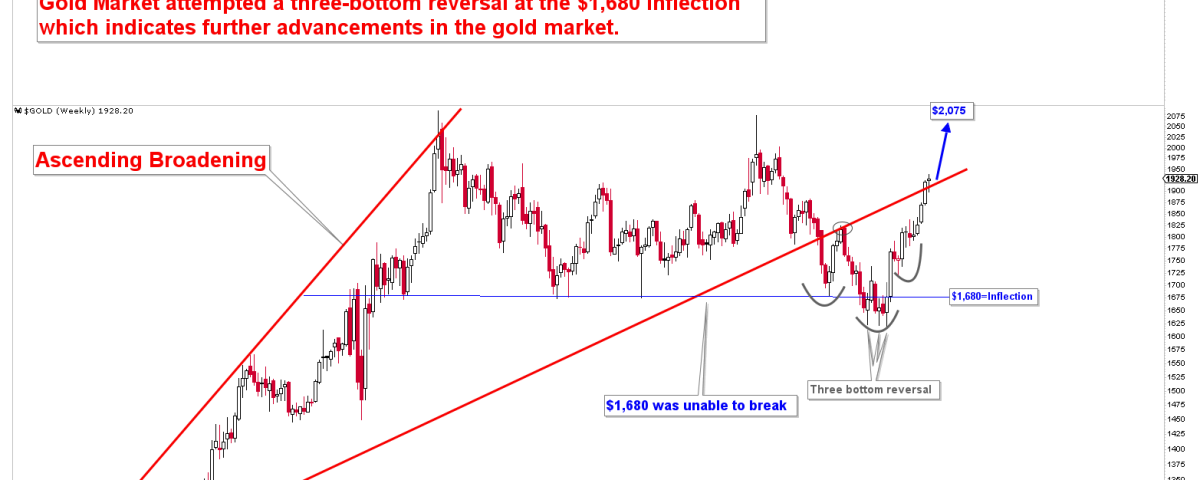
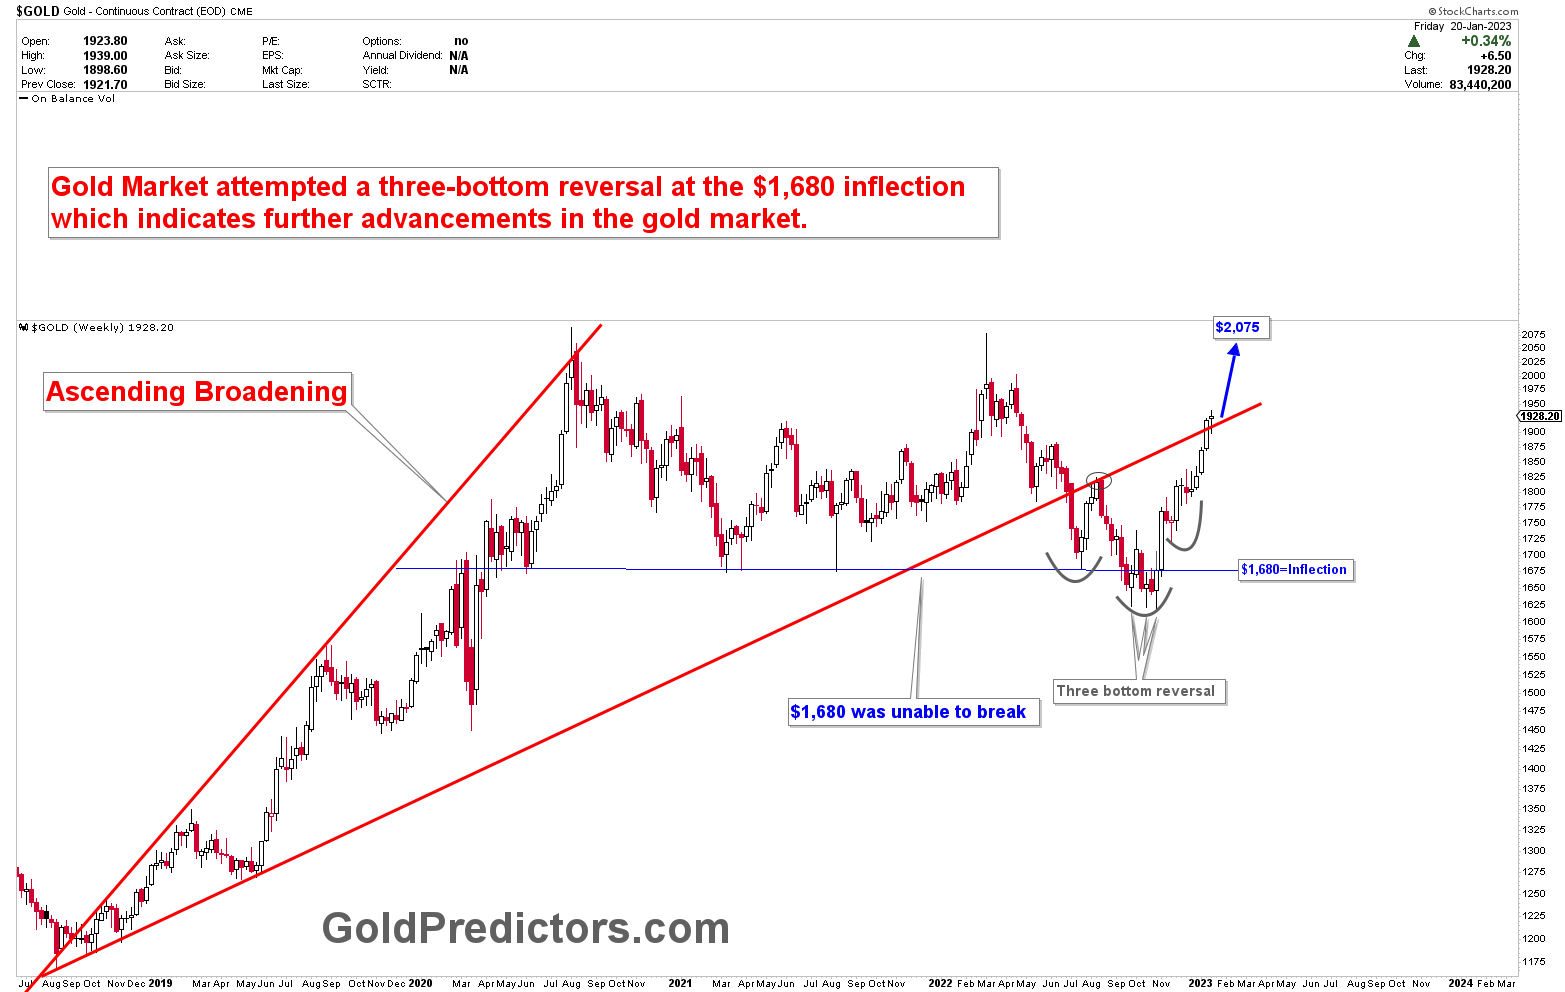
An ascending broadening pattern is a chart formation that is typically seen as a bearish indicator in technical analysis. This pattern is characterized by a series of higher lows and higher highs, with the lows and highs becoming increasingly wide apart over time. This formation can be seen as a sign that the market is becoming more volatile and uncertain. This also indicates that the upward trend may be losing momentum. Traders will often look for other indicators, like bearish divergence or a breakdown of support levels, to confirm the formation.
The ascending broadening chart with a bearish formation and a target of $1,680 was identified in 2021. The gold broke the pattern and moved to the downside, with prices reaching the targeted $1,680 region. Gold price breached $1,680, but the breakout was viewed as a false breakout, and prices were able to reverse higher. As there were no multiple monthly closes below $1,680, the breakout was not yet confirmed. Instead of closing below $1,680, the price spent time laying the bullish groundwork below that level. The bullish foundation was categorized by the triple bottom and quick reversal.
What is Next?
The long-term objective of $1,923 has been reached, and the price is now breaking this region to move higher. According to recent discussions, $2,075 is regarded as the pivot point for the gold rally, with any break above $2,075 being viewed as the beginning of the next massive rally to multi-level highs. In the coming years, it is likely that the gold rally will initiate its massive move toward the $8,000 region.
Gold prices closed successfully above the ascending broadening line above $1,923 last week. In addition, the close above the pattern line indicated a powerful breakout. When prices enter an ascending broadening pattern, they typically move very quickly. The closest objective remains between $1,975 and $2,000, but $2,075 remains the pivot. Since the breakout from the pattern was recaptured, the ascending broadening bearish patterns are now functioning as bullish patterns.
Conclusion
Gold prices have formed a bottom at a strong support region, as evidenced by a strong triple bottom support and an inverted head and shoulder pattern. Gold has re-captured the ascending broadening patterns and is expected to rise in price. Since the ascending broadening pattern was re-captured, the patterns have transformed into bullish formations. Any break above $2,075 would be considered a strong breakout with the potential to target higher levels. Investors must buy gold prices on any pullback.
Subscribe to the link below to receive free and premium article alerts and trading signals.
