


The Gold Fluctuations Below 1835
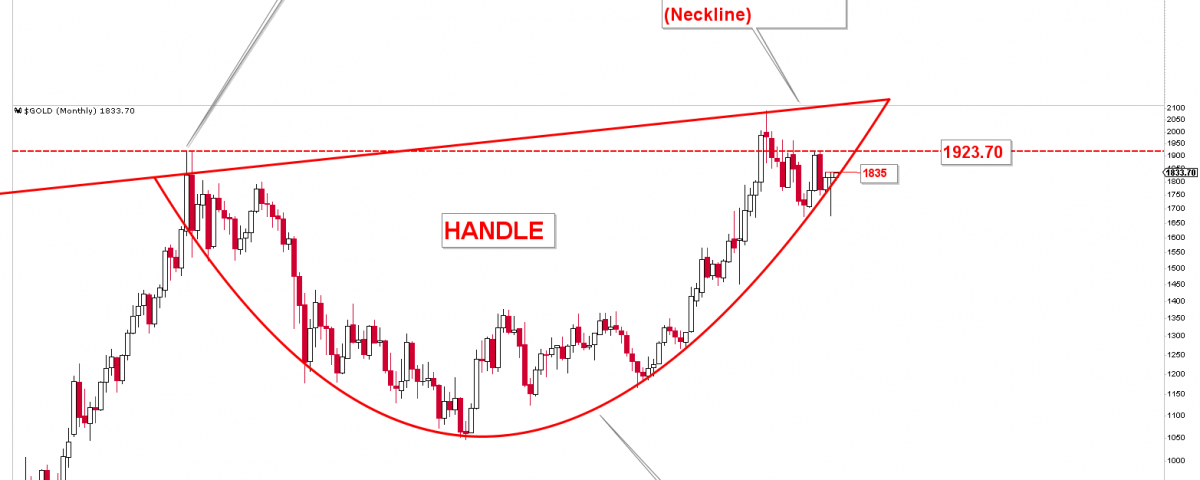
The previous week’s report examined the monthly and weekly charts to discuss the significance of $1,835. We mentioned the significance of $1,835 because of the appearance of new monthly resistance. As a result, we used the term “cautious” throughout the report. The drop from $1,835 developed, which breached and even closed below the $1,795 and $1,802 support levels. On Thursday/Wednesday, we updated a “Trading Signals”, indicating that the probability of $1,783 as the weekly lows (Using WhatsApp).
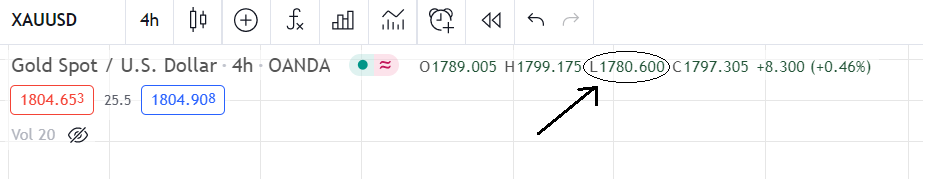
Last week, we marked two boundaries, with $1,780 and $1,802 for possible next moves. $1,780 was also used as a stop loss for our Day trades, which were delivered to premium members via WhatsApp. The low was formed precisely at $1,780.60, as shown in the graph below, before prices began to rise again and closed above $1,802 on Tuesday. The daily bullish candle above the 1780 mark appeared to be very healthy, but actually it is still not healthy.
Gold Cycles
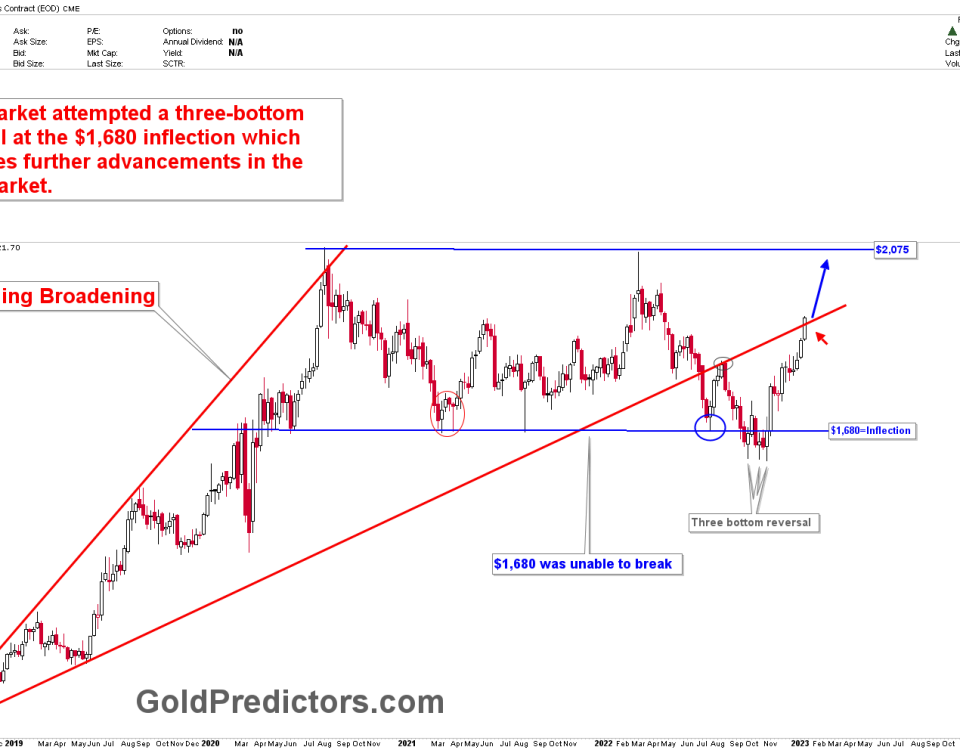
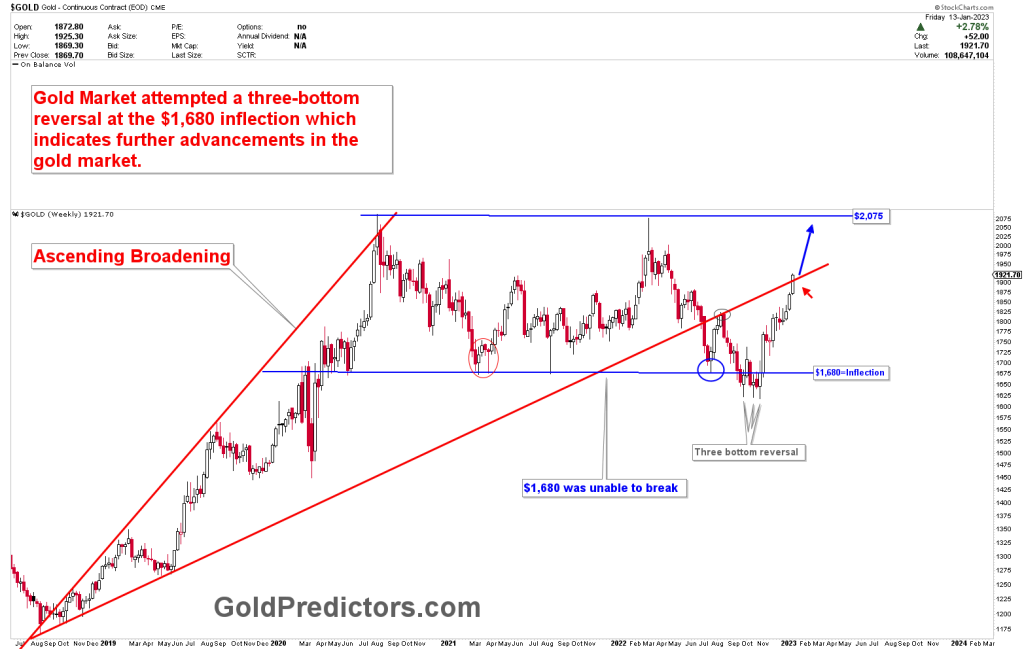
The chart below depicts the movement of gold prices in medium and short term cycles. The medium term cycles appear every 4-6 months, depending on the data collection (measured using machine learning techniques), and there are a few medium term cycles that become diverged cycles due to the collision of data of long-term, short-term, and medium-term cycles. When gold prices diverge, it produces a strong bottom followed by a long-term move. According to the most recent data, we informed premium members that the 10th of March 2021, is a diverged cycle. This information was delivered on March 9th 2021. The inflection points at the time were $1,675-$1,680, and the lows on the diverged cycle occurred on March 10th. Following the production of the diverged cycle’s low, prices rise towards $1,900.
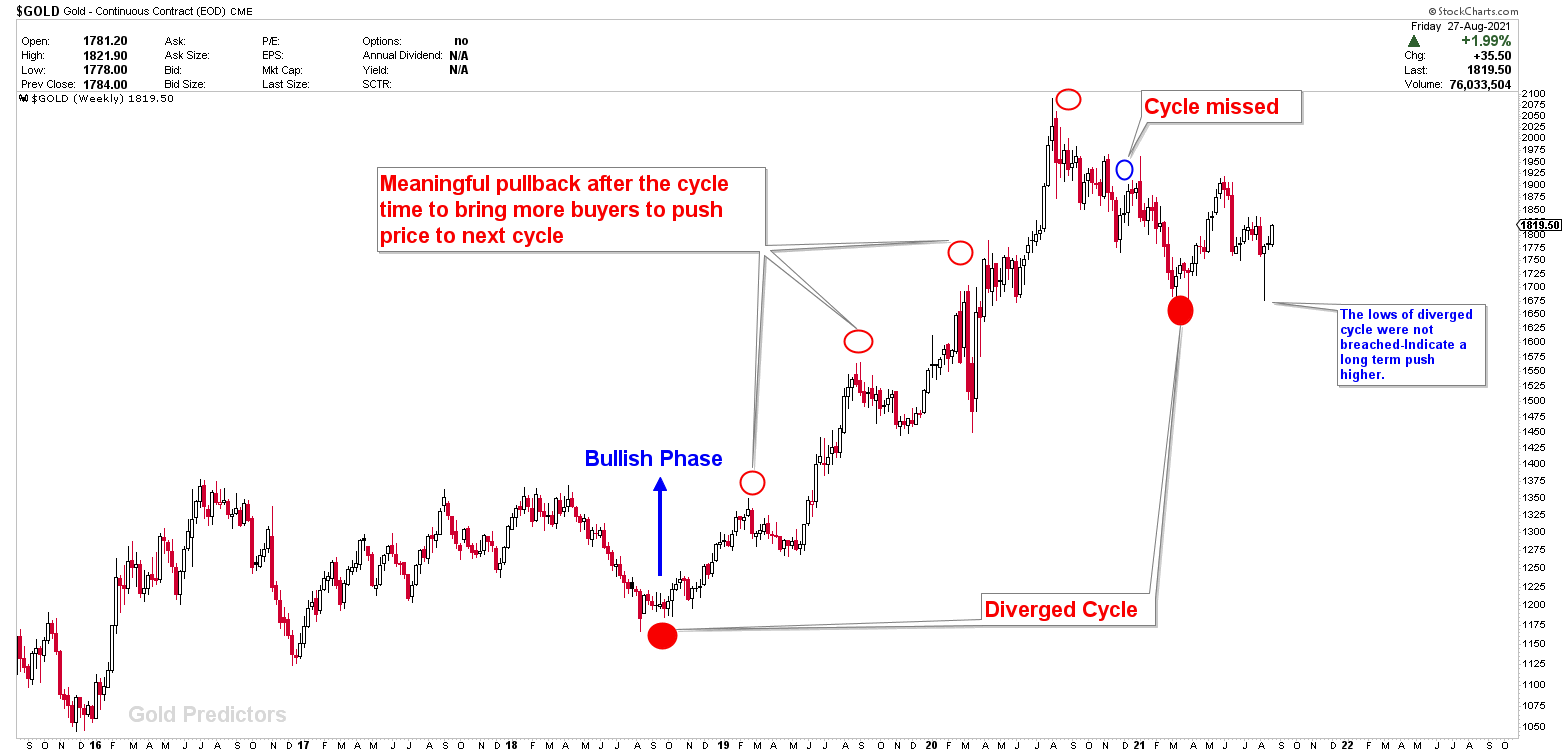
We informed premium members about the $1,931 inflection point for higher prices. Unfortunately, that level was not clearly broken, so another attempt was made to reach the $1,680 inflection point. The lows of March 2021 were not broken during recent drop because they were marked by a diverged cycle, and prices began to rise again towards $1,835. This behavior indicates that the diverged cycle of 10th March 2021 is still active. The short term cycles appear every 15-30 days as a result of data collision. The last short term cycle was due on August 7th, and it produced a low of $1,680.
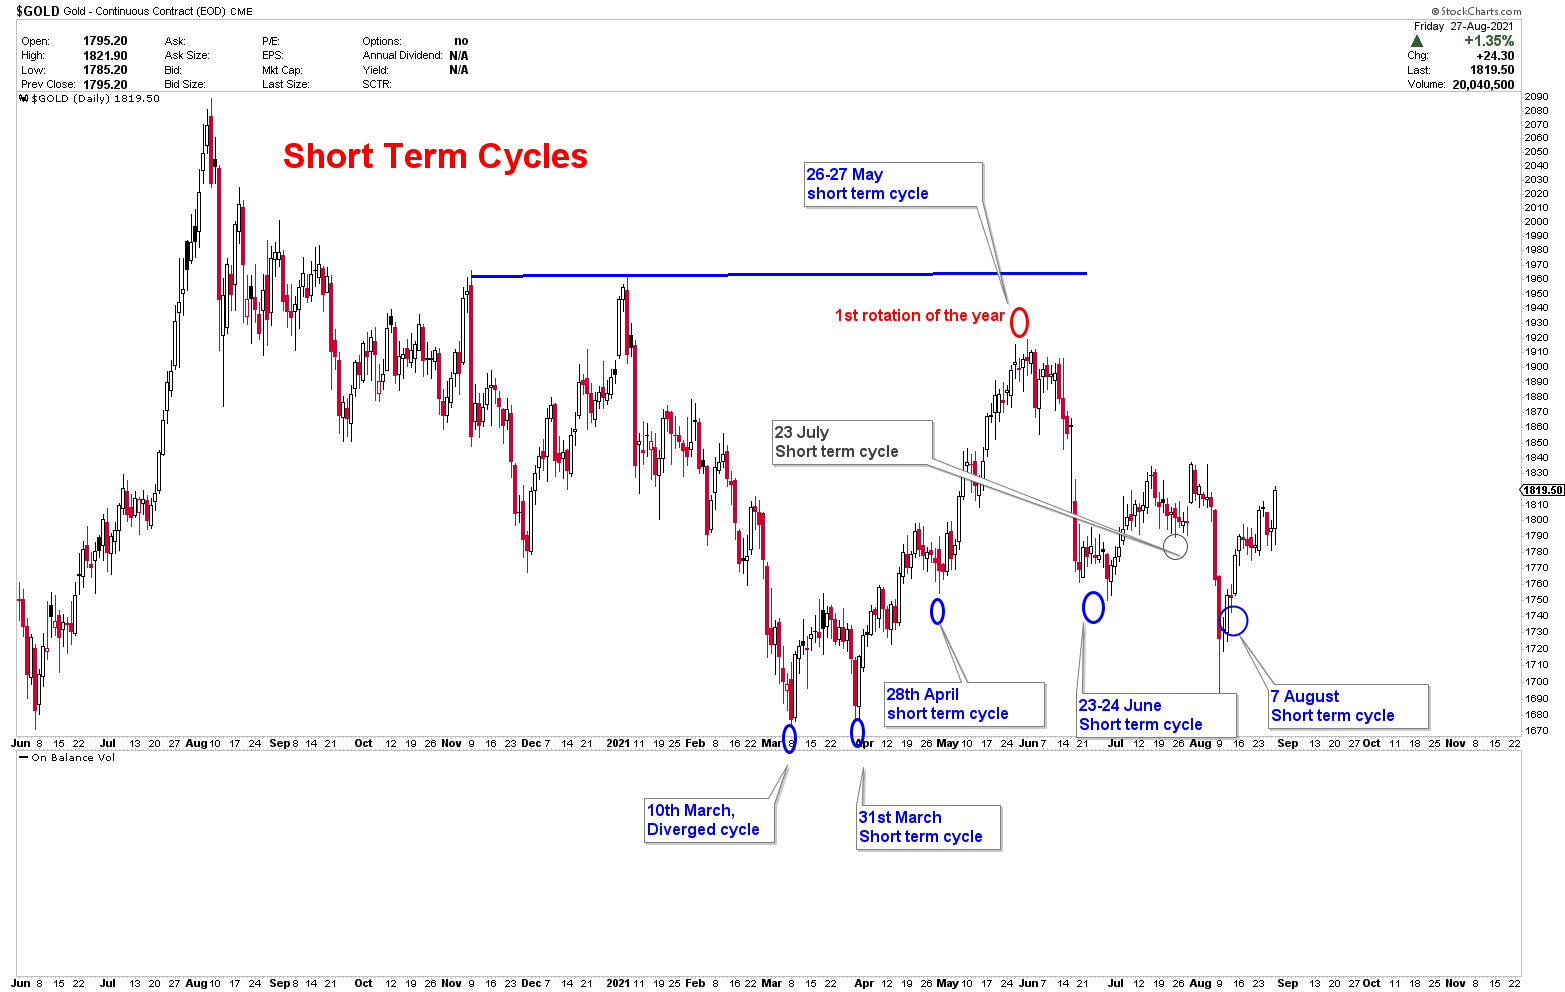
This article will discuss the likelihood of the next short term cycle, which is set to unfold in the coming days. The article will include personal opinions, trading comments, a market overview of gold and silver, and technical charts to help you determine the likelihood of the next gold move.
To receive Free Updated Please Register as Free Member