EURJPY At Long Term Symmetrical Triangle | Gold Predictors - Forecasting Gold Prices

New York

London

Sydney

Tokyo

Log In

  • Register
  • Lost your password?
gold predictorsgold predictorsgold predictorsgold predictors
  • HOME
  • ABOUT US
    • About Us
    • Social Networks
    • Industry Links
    • Testimonials
  • RESEARCH
    • Scientific Trade Strategies
    • Gold Hub
    • Gold Importance
    • Silver Importance
  • GOLD HUB
  • GOLD ANALYSIS
    • Gold Analysis
    • Technical Analysis
      • Trend Identification
      • Phase Identification
      • Important Levels
      • Volatility Measurement
    • Gold Cycle
      • Short Term Cycles
      • Medium Term Cycles
      • Long Term Cycles
    • Price Action Analysis
      • Phase Identification
      • Historical Pattern Identification
      • Candlestick Pattern Identification
    • Fundamental Analysis of Gold
    • Gold Related Markets Analysis
    • Gold Seasonal
  • TRADING METHODOLOGY
    • Gold Analysis
      • Technical Analysis
      • Gold Cycle
      • Price Action Strategy
      • Fundamental Analysis
      • Gold Related Markets Analysis
      • Gold Seasonal
    • Measure Signal Strength
      • Weak Signal
      • Strong Signal
      • Confirmed Signal
    • Trading Decision
    • Trading Rules
      • Basic Trading Rules
      • Gold Predictors Trading Rules
    • Trade Examples
    • Performance
  • LIVE CHARTS
  • MEMBERSHIPS
    • Free Membership
    • Premium Membership
    • SignUp
  • MEMBERS AREA
    • Free Article
    • Premium Article
    • Trading Signals
    • Long Term Signals
    • Forex Reports
    • Crypto Reports
  • FOREX REPORTS
  • HELP
    • FAQ
    • Contact Us
Login / Register

EURJPY At Long Term Symmetrical Triangle

0
Published by admin at August 18, 2021
Categories
  • Free Articles
Tags

The Japanese yen has been extremely strong in recent months and weeks. The bounce from long-term support in all Japanese yen correlated pairs was simply a normal occurrence. EURJPY and USDJPY are expected to fall further in the coming weeks and months. In this section, we will look at the monthly, weekly and daily charts of EURJPY. Let’s begin by taking a look at the EURJPY long-term monthly chart.

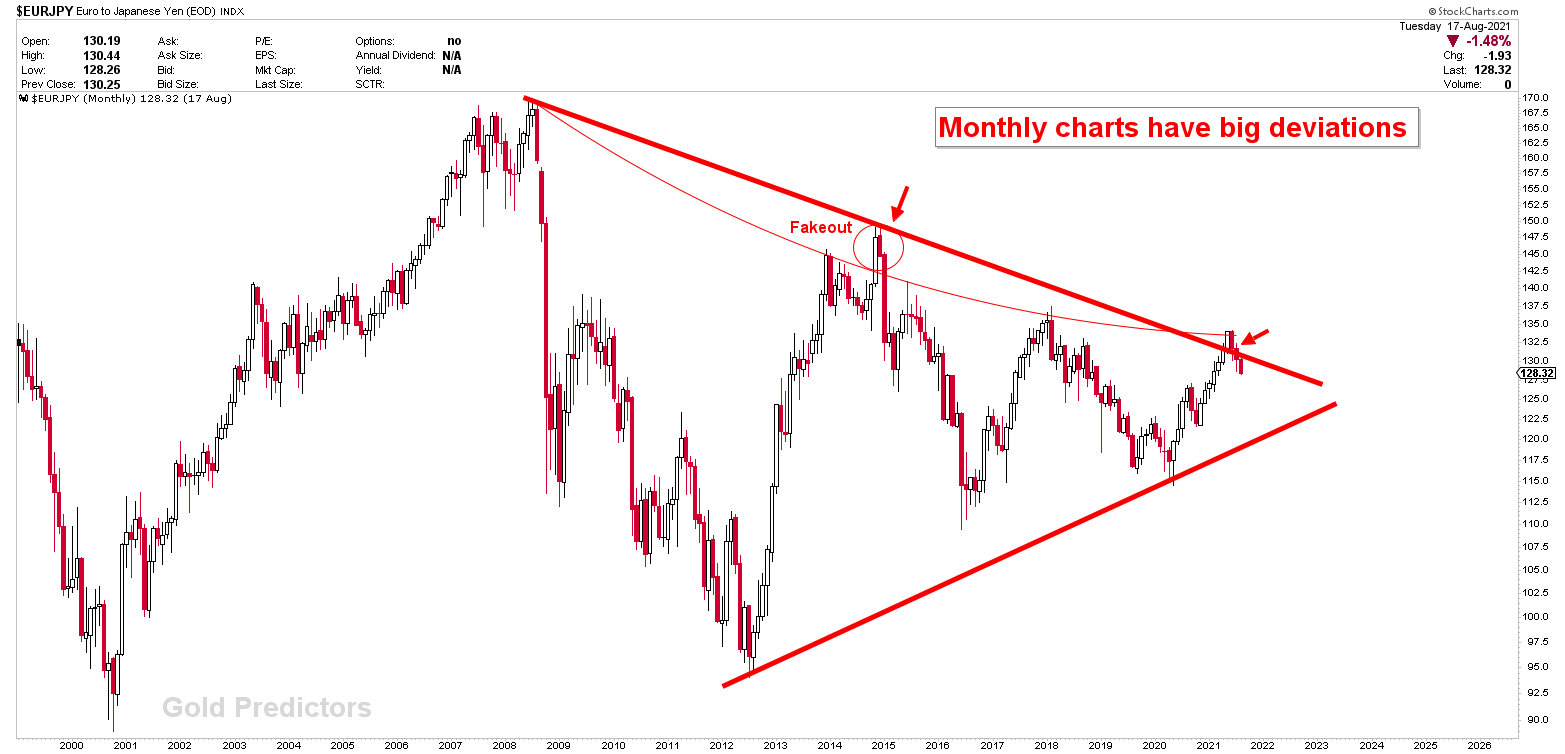
EURJPY Monthly Chart

The EURJPY monthly chart shows that the instrument is capped within the symmetrical triangle. The resistance here indicates that prices are about to fall sharply. When price surpassed the triangle line, we stated that this is normal behavior and that prices would return back to the triangle. Prices are currently trading within the triangle, and once the summer doldrums pass, they are expected to fall sharply.
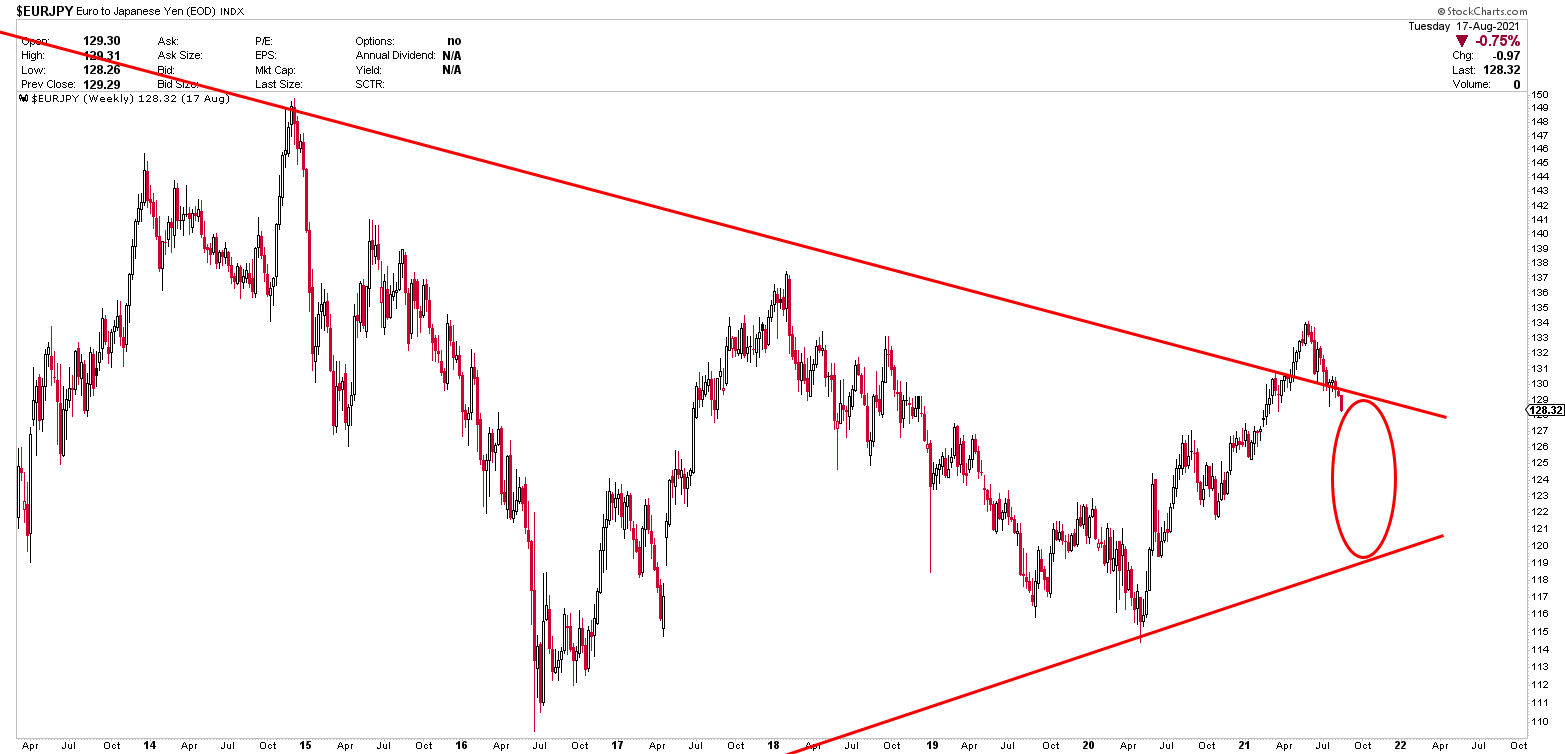
EURJPY

EURJPY Weekly Chart

The weekly chart is a zoomed-in version of the monthly EURJPY chart. The symmetrical triangle is clearly visible in this chart, and the weekly candle appears to be falling. Last week was a coiling week, which indicates the accumulation of energy. This stored energy appears to be releasing to the downside. However, there is strong support on the weekly and daily charts, which could push prices higher before the next breakdown.

EURJPY weekly

Daily Charts Trades At Neckline

The daily chart shows the head and shoulder formations. It shows that prices are trading near the neckline of the head and shoulder. A break in this neckline will almost definitely set off a powerful move. However, based on the monthly and weekly charts, any bounce from this level appears to generate strong resistance to the downside.

EURJPY

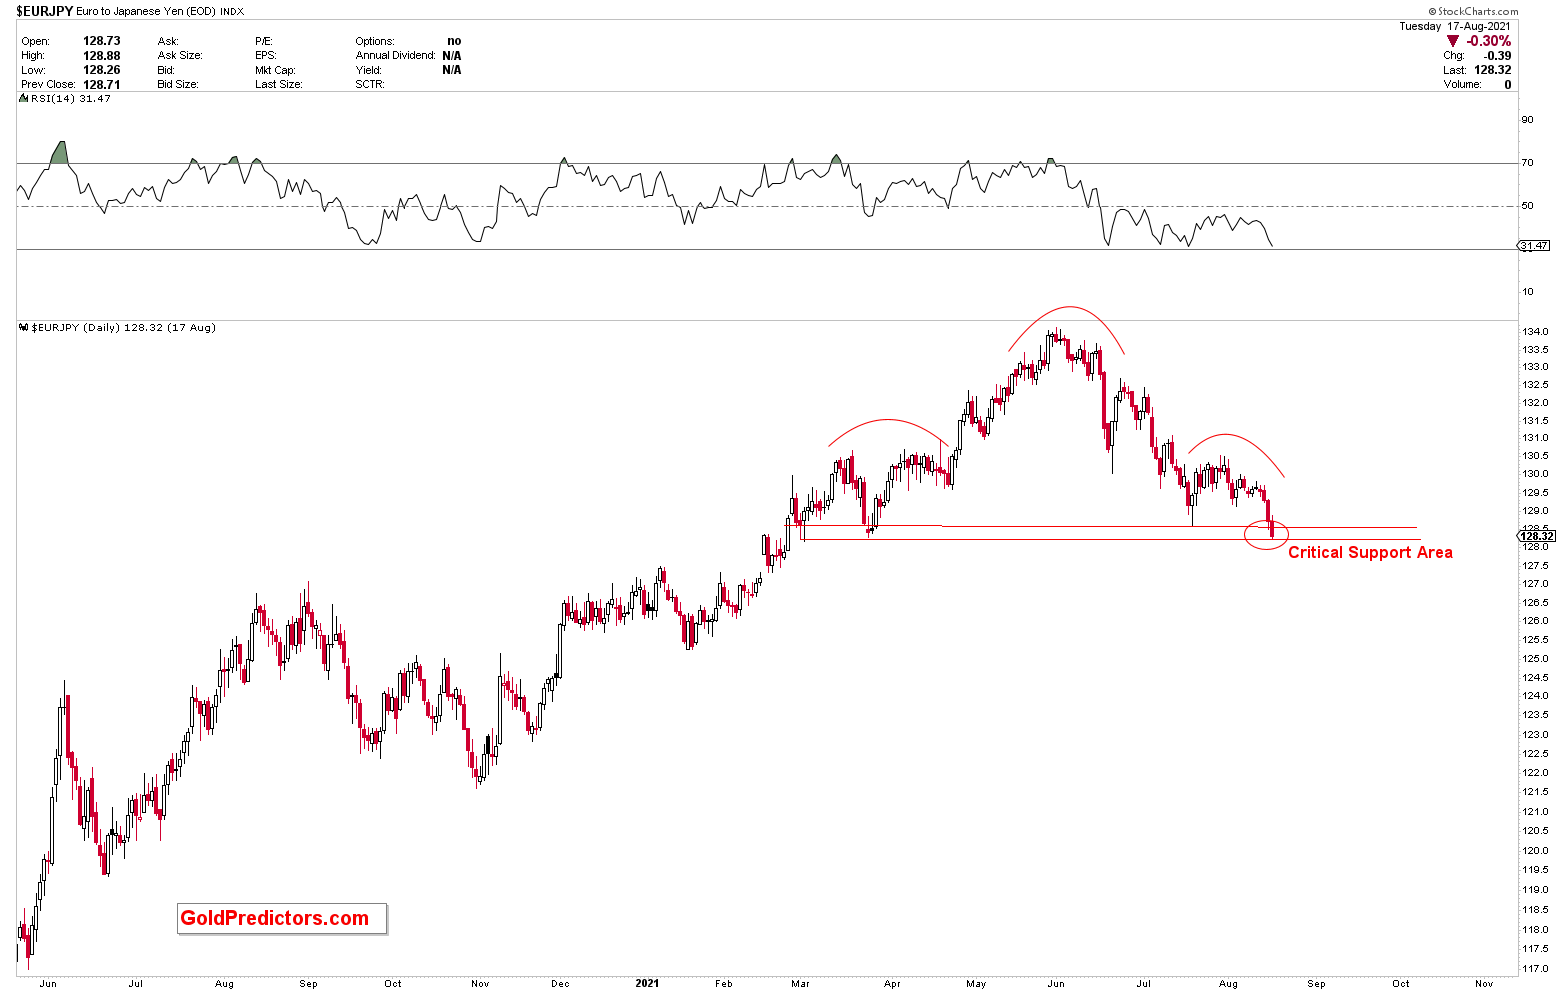
The above discussion presents the EURJPY outlook using monthly, weekly, and daily charts. It illustrates that monthly charts present long-term resistances and prices are likely to break down. Whereas daily charts present strong support at the neckline. A break of this neckline will initiate the next leg to the downside.

Related posts

silver pattern
May 9, 2025

Silver Bullish Patterns Signal Move Toward $50


Read more
gold pattern
May 8, 2025

Gold Breaks Multi-Decade Resistance as Gold/Silver Ratio Nears Historic Turning Point


Read more
gold pattern
May 7, 2025

Gold Price Breakout 2025: Long-Term Patterns Point to $4,000 and Beyond


Read more

Comments are closed.

ABOUT US

  • About Us
  • Social Networks
  • Industry Links
  • Testimonials
  • Terms & Conditions

TECHNICAL ANALYSIS

  • Technical Analysis
  • Trend Identification
  • Phase Identification
  • Important Levels
  • Volatility Measurement

CYCLE ANALYSIS

  • Gold Cycle
  • Short Term Cycles
  • Medium Term Cycles
  • Long Term Cycles

PRICE ACTION ANALYSIS

  • Price Action Analysis
  • Phase Identification
  • Historical Pattern Identification
  • Candlestick Pattern Identification
© 2017 Gold Predictors. All Rights Reserved.
  • Remember Me
    Lost your password?
    Dont have an account?Sign Up