Gold Trades within Complex Descending Triangle | Gold Predictors - Forecasting Gold Prices

New York

London

Sydney

Tokyo

Log In

  • Register
  • Lost your password?
gold predictorsgold predictorsgold predictorsgold predictors
  • HOME
  • ABOUT US
    • About Us
    • Social Networks
    • Industry Links
    • Testimonials
  • RESEARCH
    • Scientific Trade Strategies
    • Gold Hub
    • Gold Importance
    • Silver Importance
  • GOLD HUB
  • GOLD ANALYSIS
    • Gold Analysis
    • Technical Analysis
      • Trend Identification
      • Phase Identification
      • Important Levels
      • Volatility Measurement
    • Gold Cycle
      • Short Term Cycles
      • Medium Term Cycles
      • Long Term Cycles
    • Price Action Analysis
      • Phase Identification
      • Historical Pattern Identification
      • Candlestick Pattern Identification
    • Fundamental Analysis of Gold
    • Gold Related Markets Analysis
    • Gold Seasonal
  • TRADING METHODOLOGY
    • Gold Analysis
      • Technical Analysis
      • Gold Cycle
      • Price Action Strategy
      • Fundamental Analysis
      • Gold Related Markets Analysis
      • Gold Seasonal
    • Measure Signal Strength
      • Weak Signal
      • Strong Signal
      • Confirmed Signal
    • Trading Decision
    • Trading Rules
      • Basic Trading Rules
      • Gold Predictors Trading Rules
    • Trade Examples
    • Performance
  • LIVE CHARTS
  • MEMBERSHIPS
    • Free Membership
    • Premium Membership
    • SignUp
  • MEMBERS AREA
    • Free Article
    • Premium Article
    • Trading Signals
    • Long Term Signals
    • Forex Reports
    • Crypto Reports
  • FOREX REPORTS
  • HELP
    • FAQ
    • Contact Us
Login / Register

Gold Trades within Complex Descending Triangle

0
Published by admin at August 11, 2021
Categories
  • Free Articles
Tags
gold descending triangle

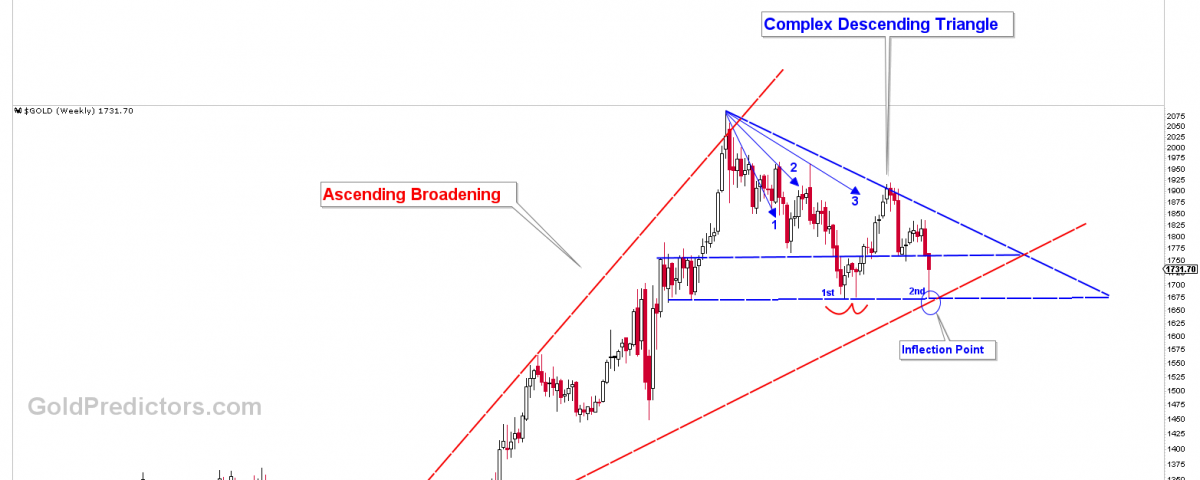
We mentioned in the previous update that gold prices are likely to bounce from the inflection point to $1,725 and $1,750. We also publicly stated that only a break above $1,760 in spot gold prices would be a bullish signal. Gold prices bottom at $1,680 before hitting a resistance level at $1,752. It’s been 48 hours, and prices are simply consolidating their decline. The measured inflection of $1,680 is also shown in the chart below. It is clear that gold prices reversed sharply from the inflection point. This strong level also serves as the support for a complex descending triangle. We created the complex descending triangle for premium members a few months ago, and it is still valid today.

gold descending triangle

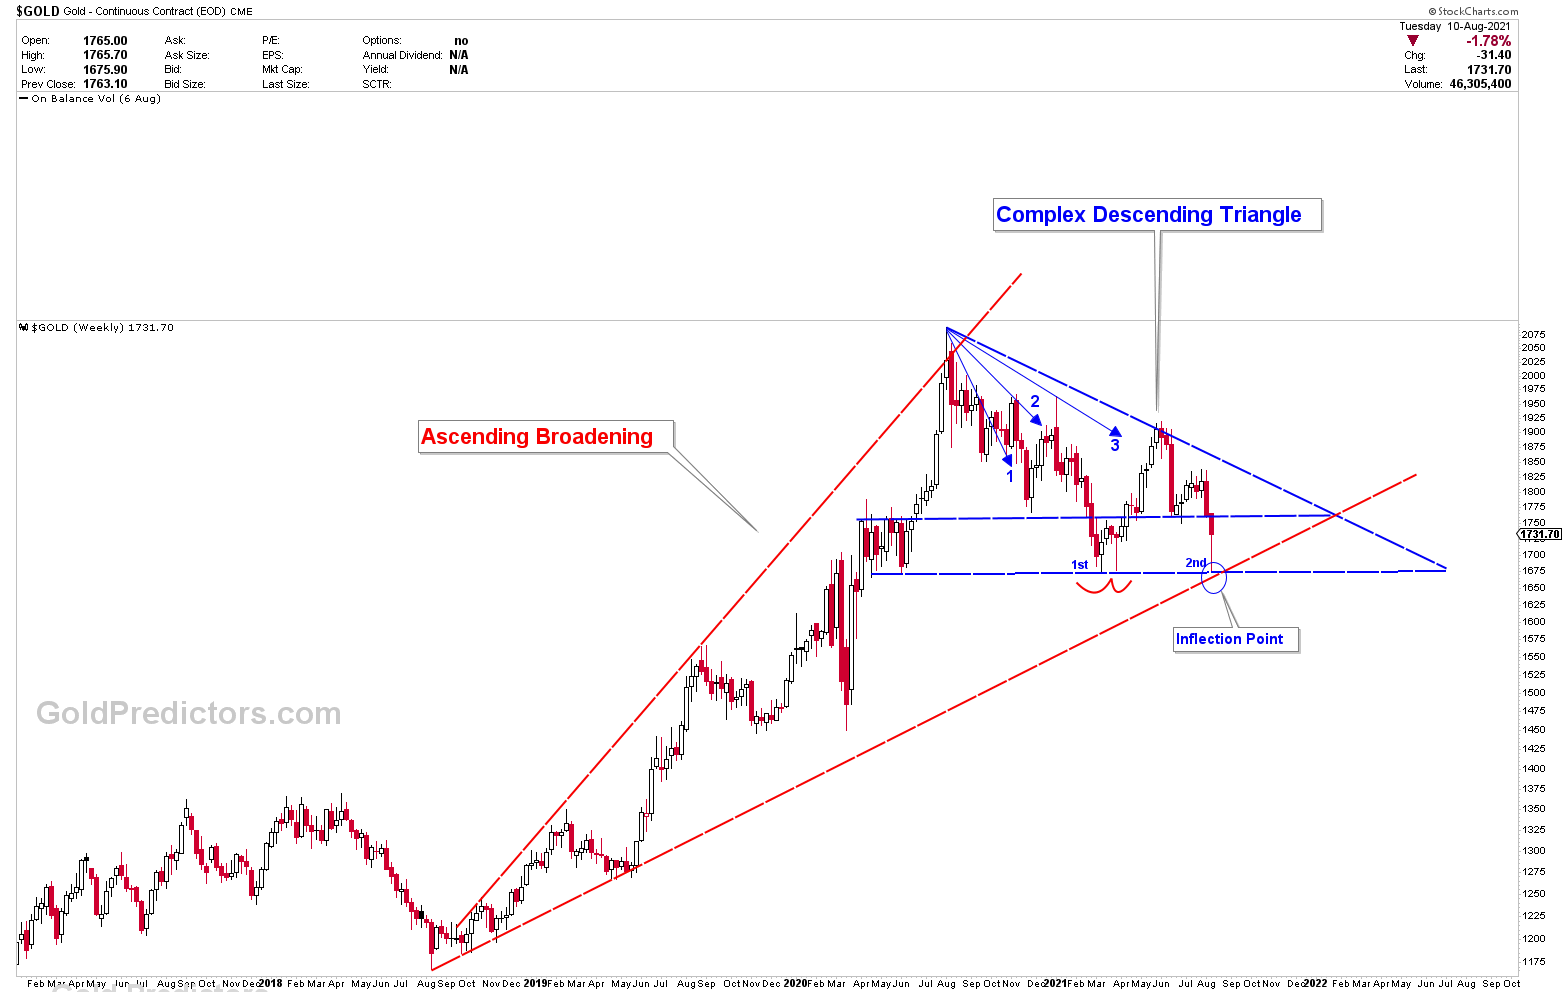
Emergence of Descending Triangle with Gold Inflection Point

According to the premium article, gold is unlikely to fall below $1,680 in a straight line due to a variety of other factors. $1,680 is a significant support juncture not because of the ascending broadening and descending triangle, but because of the abundance of other support levels. The inflection point also represents a 38.6% retracement calculated from the the Dec 2015 bottom to the All Time High.

We haven’t changed our perceptions from the last article. A weekly close above 1760 might be the first sign of bottom. This level of support calculated from the gold chart mining indicates a significant inflection point. If $1,900 levels breaks decisively, gold prices may go much higher. A break of $1,680, on the other hand, could signal a significant change in the medium term outlook.

Tuesday was another inside day candle below $1,760. The one-hour drop in gold prices from $1,753 to $1,680 was almost recovered. It is now up to gold to decide its next move following the release of the Consumer Price Index (CPI). Since the 2008-09 global financial crisis, the Fed has been pumping liquidity into the financial system. However, there has been little growth in GDP as a result. We are now at peak liquidity and inflation is the likely outcome.

A quote from the free article

“The strong support that came in at the open suggests a strong bounce towards $1725 and then $1750, with a decision made only by a weekly close above $1760. However, if prices begin to close above $1760, that would be the first sign that the bottom has been reached and prices are going higher”

To Receive Free Updates, Please Register as a Free Member

Free Membership

Related posts

silver pattern
May 9, 2025

Silver Bullish Patterns Signal Move Toward $50


Read more
gold pattern
May 8, 2025

Gold Breaks Multi-Decade Resistance as Gold/Silver Ratio Nears Historic Turning Point


Read more
gold pattern
May 7, 2025

Gold Price Breakout 2025: Long-Term Patterns Point to $4,000 and Beyond


Read more

Comments are closed.

ABOUT US

  • About Us
  • Social Networks
  • Industry Links
  • Testimonials
  • Terms & Conditions

TECHNICAL ANALYSIS

  • Technical Analysis
  • Trend Identification
  • Phase Identification
  • Important Levels
  • Volatility Measurement

CYCLE ANALYSIS

  • Gold Cycle
  • Short Term Cycles
  • Medium Term Cycles
  • Long Term Cycles

PRICE ACTION ANALYSIS

  • Price Action Analysis
  • Phase Identification
  • Historical Pattern Identification
  • Candlestick Pattern Identification
© 2017 Gold Predictors. All Rights Reserved.
  • Remember Me
    Lost your password?
    Dont have an account?Sign Up