


Gold Hits the Inflection Point
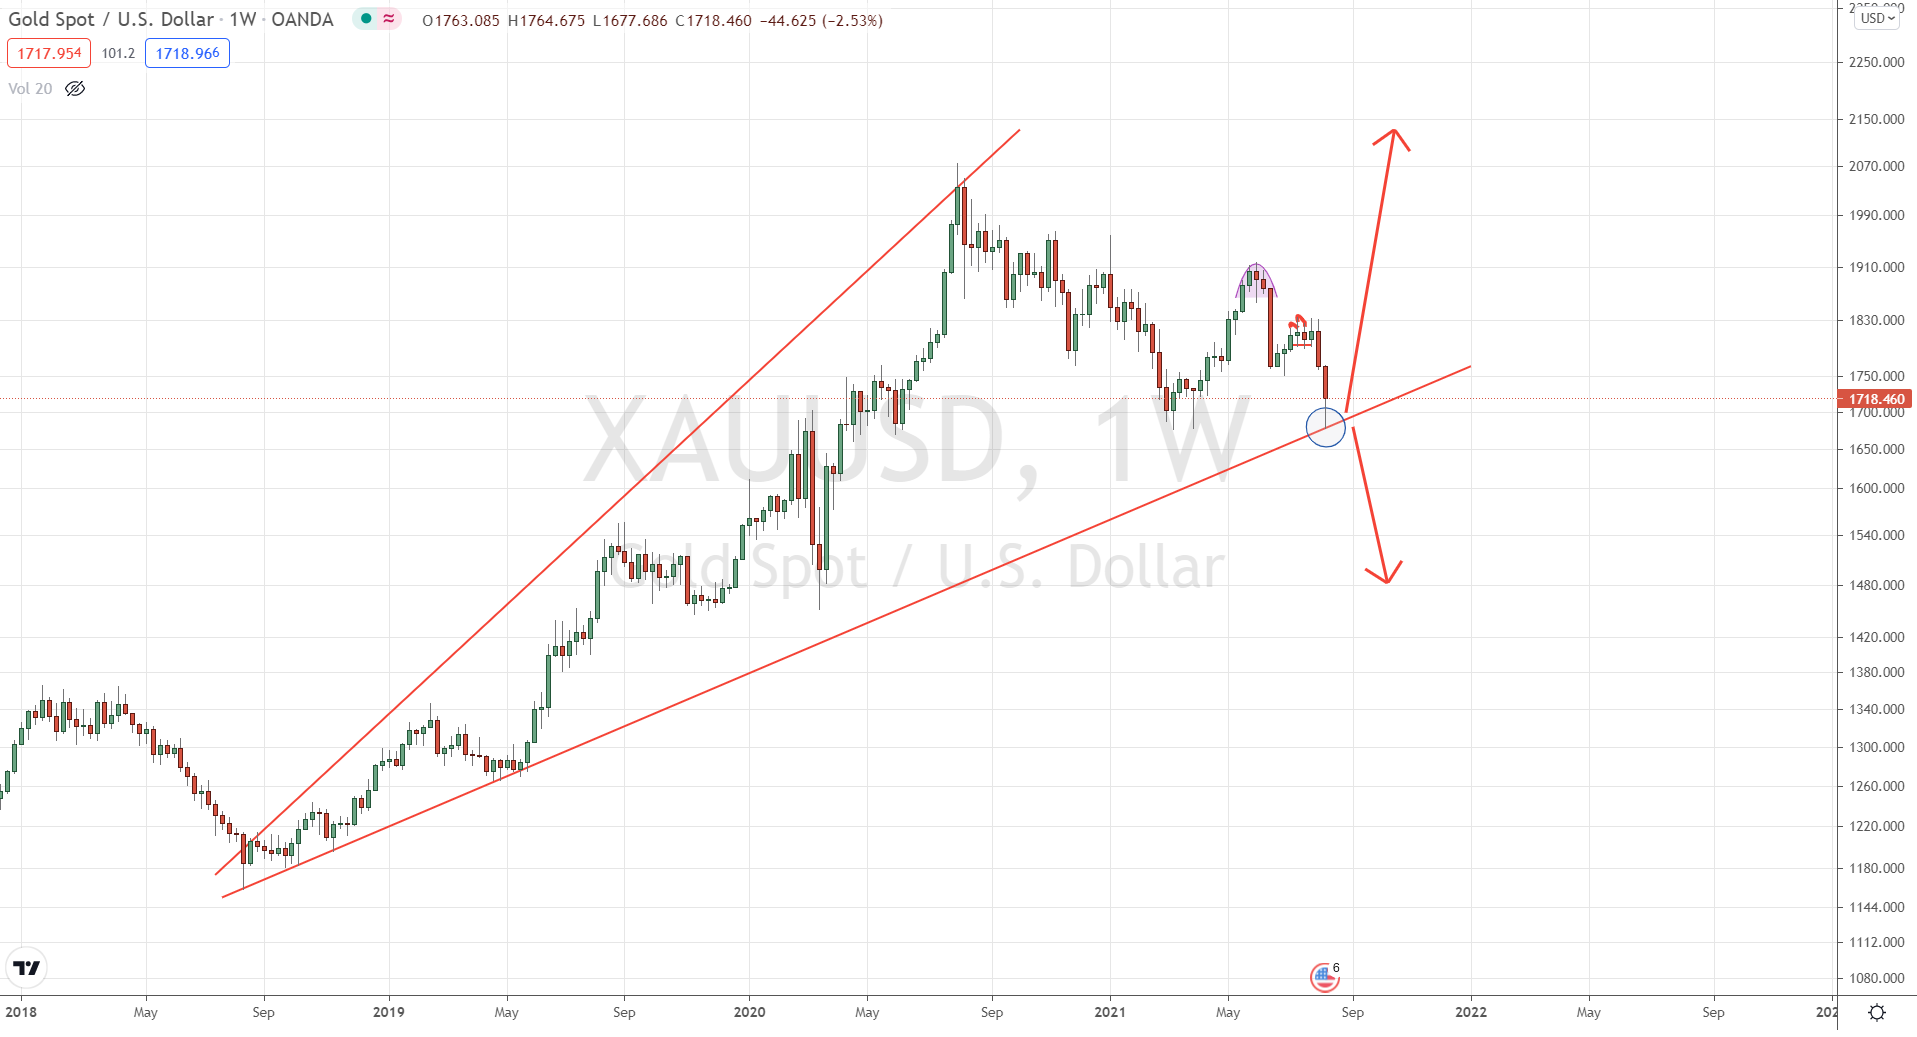
Since gold broke $1,787 last week following the NFP report. The prices have fallen sharply lower in anticipation of the release of stored energy to the downside. According to last week’s discussion, prices were unable to close below $1,760 on a weekly basis, but Monday’s opening brought prices down to the yearly inflection point of $1,680.
We’ve been talking about the yearly inflection point of $1,675-$1,680 as a mega support region since March 2021. The pullback in gold and silver that we have been expecting for the last three weeks has now occurred. The pullback has reached the significant inflection point of $1,680. A break of $1,680 would result in a free fall in gold. However, because of the strong support region, a strong bounce back towards $1,725 and then $1,750 is possible. A strong recovery above $1,760 would form a quick reversal above the inflection point of $1,680. This quick reversal above $1,760 would indicate strong prices in the coming weeks and months. A break of the inflection point, on the other hand, will result in a free fall in gold prices. This free fall could be much more difficult than anticipated.
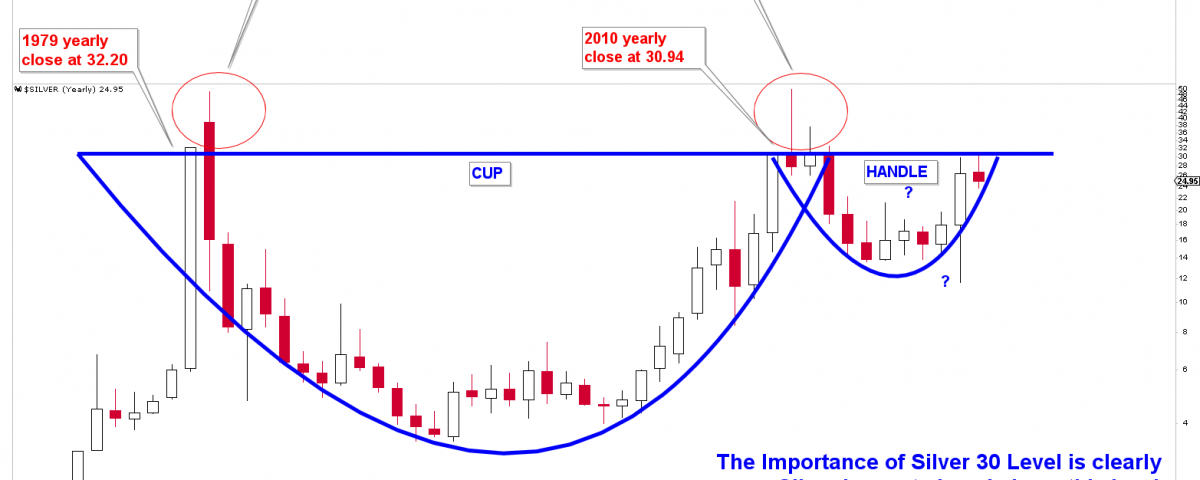
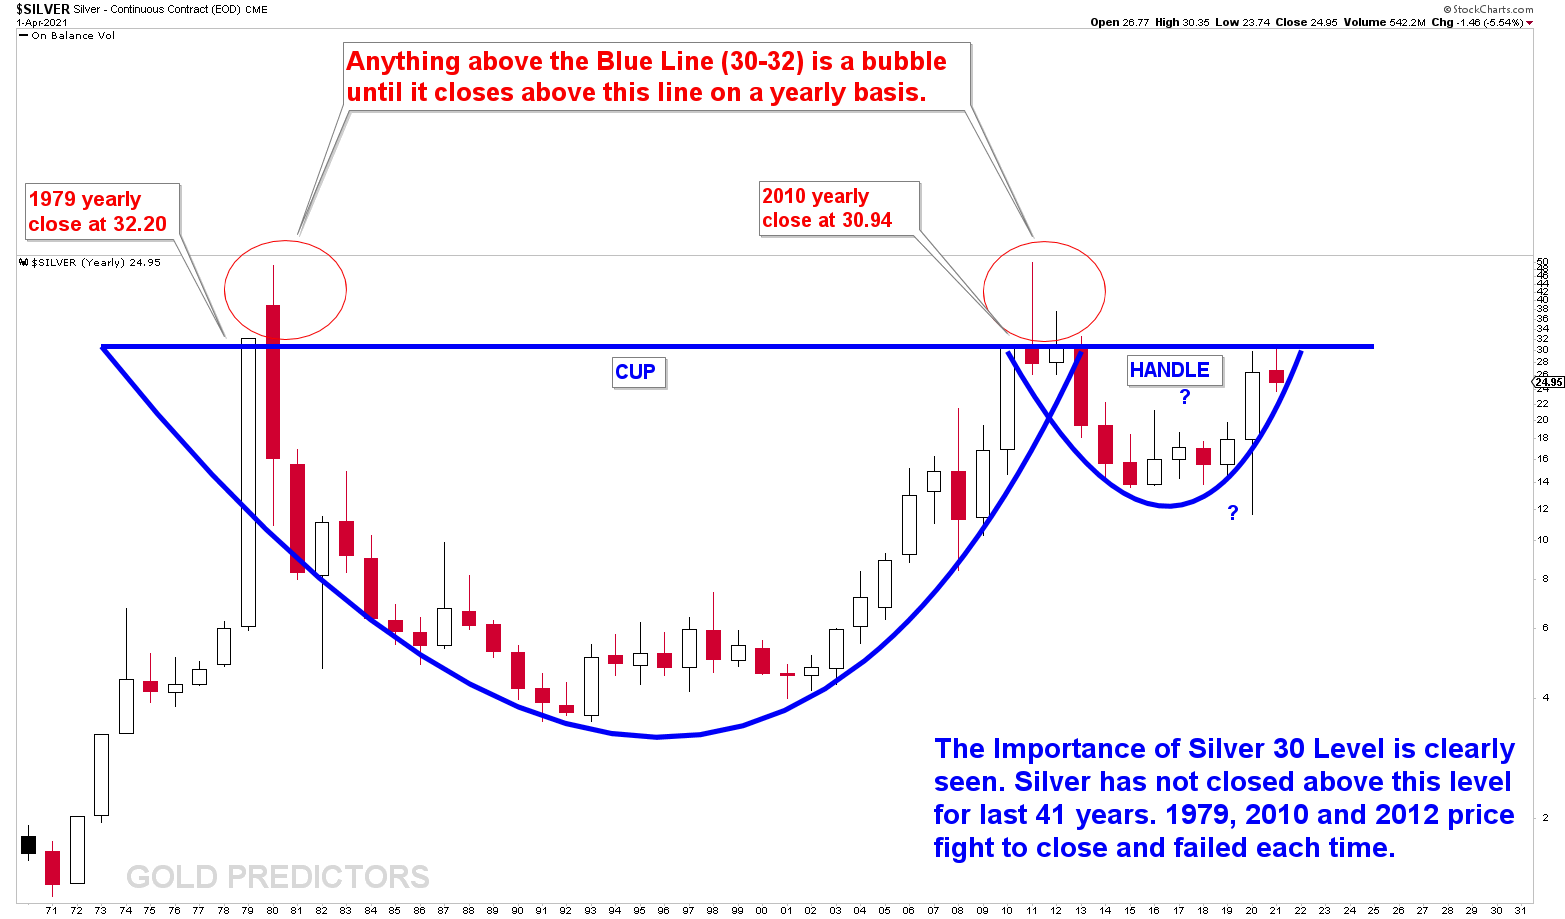
Why $30 is inflection point in Silver?
Silver prices are trending in the same direction as gold prices. We have been uncomfortable with silver prices because they have not increased in value since last year. In silver, the drop this morning also hit the strong support of $22.50-$23. Any recovery above $25.70 would be considered bullish. Any weekly close below $23, on the other hand, would take silver to $20.80.
An old chart from April 2020 depicts the long-term outlook for silver. The chart depicts the formation of bullish CUP and Handle patterns, but it is clear that silver has not closed above $30 for the past 40 years. This identifies the significance of $30 silver levels. The prices closed above $32.20 in 1979, but they were unable to sustain their gains and fell sharply in 1980. The same thing happened again in 2010, when silver closed at $30.94. However, prices fell again in 2011 as a result of another downturn. Every time silver attempts to close above $30 levels on a yearly basis, it produces a bubble above the $30 levels, indicating that $30 is a strong resistance level in silver.
The strong support that came in at the open suggests a strong bounce towards $1725 and then $1750, with a decision made only by a weekly close above $1760. However, if prices begin to close above $1760, that would be the first sign that the bottom has been reached and prices are going higher.
Gold is about to make its next big move. The $1,680 marks an inflection point. Since last year, the price of silver has remained constant. If gold and silver reverse from the inflection point this time, it could be the year’s final lows.


