The Next Move in Gold is About to Develop | Gold Predictors - Forecasting Gold Prices

New York

London

Sydney

Tokyo

Log In

  • Register
  • Lost your password?
gold predictorsgold predictorsgold predictorsgold predictors
  • HOME
  • ABOUT US
    • About Us
    • Social Networks
    • Industry Links
    • Testimonials
  • RESEARCH
    • Scientific Trade Strategies
    • Gold Hub
    • Gold Importance
    • Silver Importance
  • GOLD HUB
  • GOLD ANALYSIS
    • Gold Analysis
    • Technical Analysis
      • Trend Identification
      • Phase Identification
      • Important Levels
      • Volatility Measurement
    • Gold Cycle
      • Short Term Cycles
      • Medium Term Cycles
      • Long Term Cycles
    • Price Action Analysis
      • Phase Identification
      • Historical Pattern Identification
      • Candlestick Pattern Identification
    • Fundamental Analysis of Gold
    • Gold Related Markets Analysis
    • Gold Seasonal
  • TRADING METHODOLOGY
    • Gold Analysis
      • Technical Analysis
      • Gold Cycle
      • Price Action Strategy
      • Fundamental Analysis
      • Gold Related Markets Analysis
      • Gold Seasonal
    • Measure Signal Strength
      • Weak Signal
      • Strong Signal
      • Confirmed Signal
    • Trading Decision
    • Trading Rules
      • Basic Trading Rules
      • Gold Predictors Trading Rules
    • Trade Examples
    • Performance
  • LIVE CHARTS
  • MEMBERSHIPS
    • Free Membership
    • Premium Membership
    • SignUp
  • MEMBERS AREA
    • Free Article
    • Premium Article
    • Trading Signals
    • Long Term Signals
    • Forex Reports
    • Crypto Reports
  • FOREX REPORTS
  • HELP
    • FAQ
    • Contact Us
Login / Register

The Next Move in Gold is About to Develop

0
Published by admin at August 5, 2021
Categories
  • Premium Articles
Tags

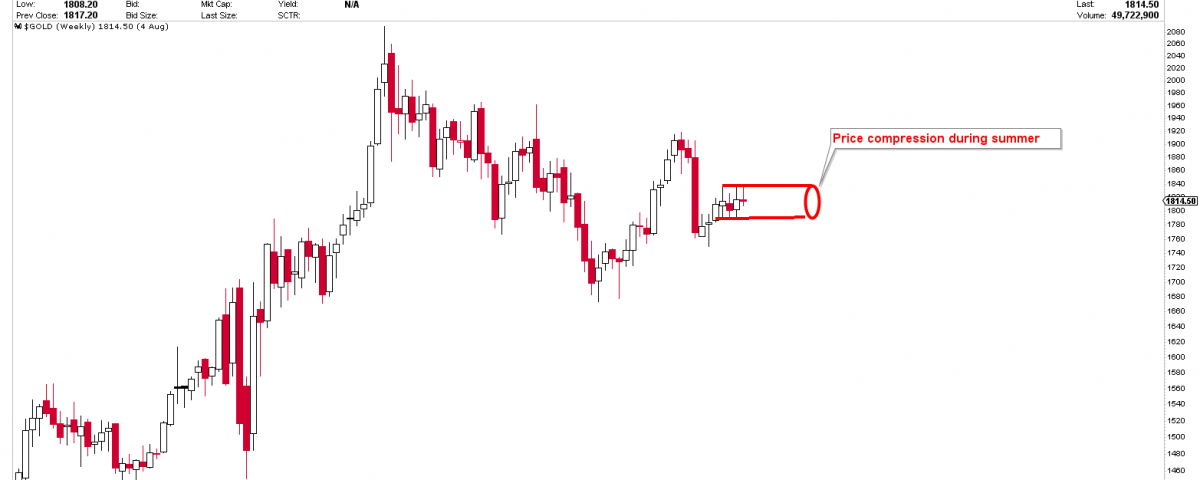
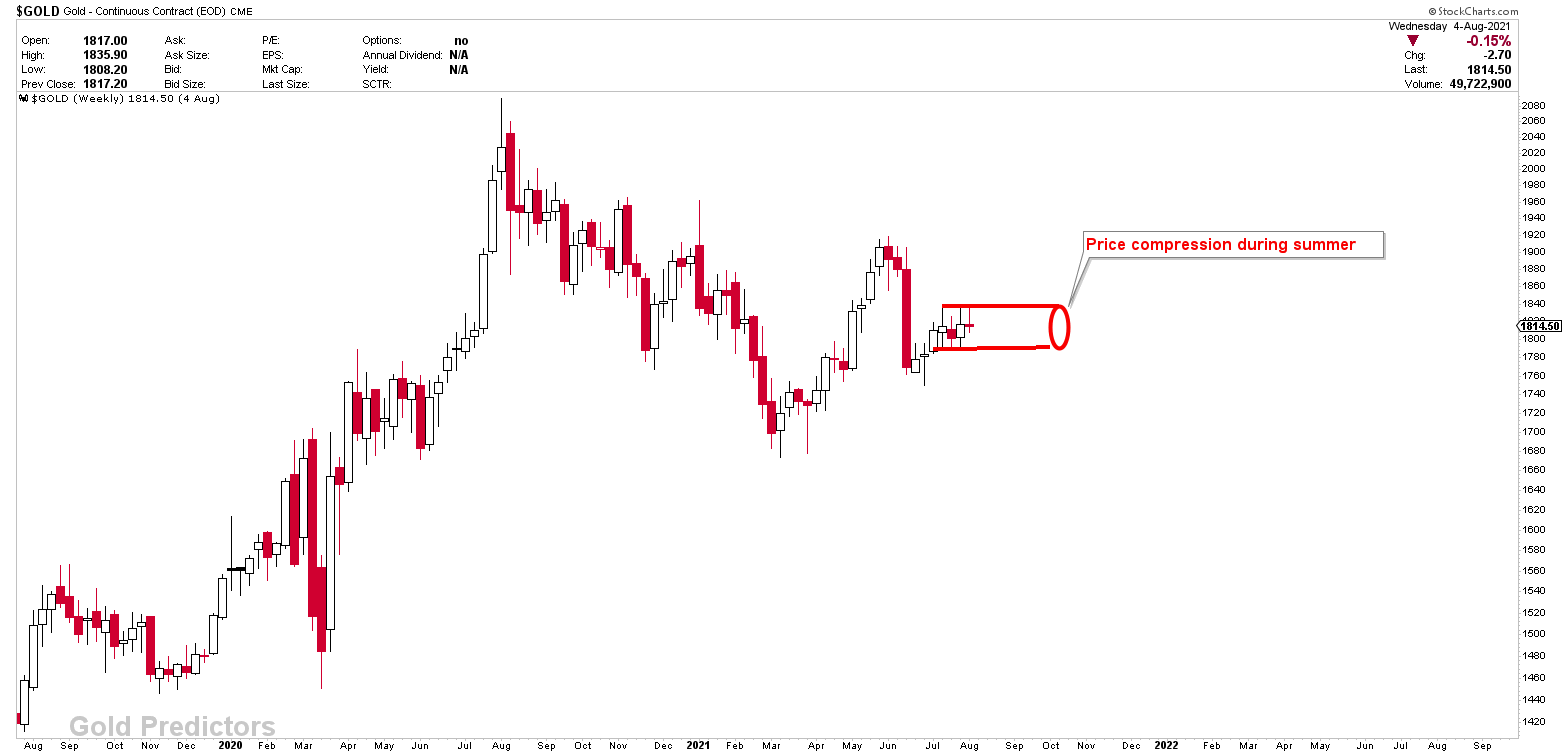
According to our expectations and detailed analysis, spot gold has formed a strong resistance at 1835. Prices have now been trading below this level for three weeks and the next move in gold is about to develop. Before the FOMC meeting last week, the strong support region of 1790-1800 was tested several times. Following the FOMC meeting, prices tested the 1835 level again before falling back to support. We identified 1787 as the pivot point for the last week, stating that any break below 1787 would trigger waterfalls to at least 1750. 1787, on the other hand, was not hit and weekly candle generated different scenarios. Silver falls below the 24.80 support level in order to clear the stops below 24.50, but then reverses and closes above the 24.80 level.

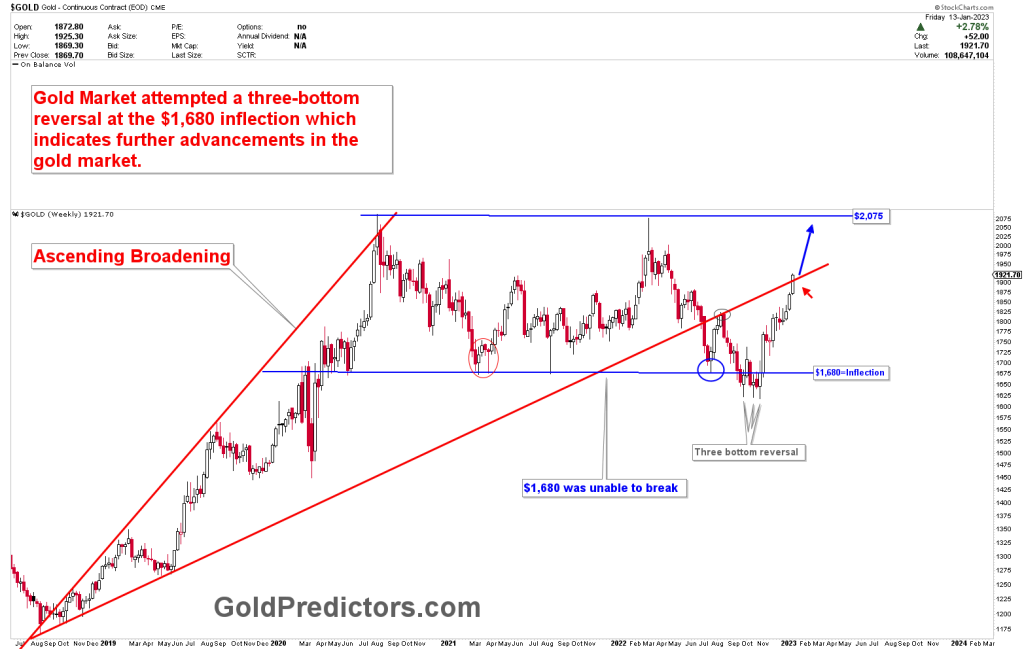
On the weekly chart, gold has produced a double coiling effect, while silver has produced a weekly reversal candle right at the ascending triangle. Before concluding the analysis, a few factors must be investigated. In today’s report, we will look at the next move in gold, which is expected to occur in August.

The Next Move in Gold

To receive free updates, please register as free member.

Free Article

This content is locked

Login To Unlock The Content!

Username:
Password:

Related posts

January 29, 2023

Premium Updates Are Mostly Delivered Using Emails


Read more
recession
January 28, 2023

Gold – A Recession Warning


Read more
gold ascending broadening
January 15, 2023

Gold: Bullish Short-Term Structure


Read more

Comments are closed.

ABOUT US

  • About Us
  • Social Networks
  • Industry Links
  • Testimonials
  • Terms & Conditions

TECHNICAL ANALYSIS

  • Technical Analysis
  • Trend Identification
  • Phase Identification
  • Important Levels
  • Volatility Measurement

CYCLE ANALYSIS

  • Gold Cycle
  • Short Term Cycles
  • Medium Term Cycles
  • Long Term Cycles

PRICE ACTION ANALYSIS

  • Price Action Analysis
  • Phase Identification
  • Historical Pattern Identification
  • Candlestick Pattern Identification
© 2017 Gold Predictors. All Rights Reserved.
  • Remember Me
    Lost your password?
    Dont have an account?Sign Up