


Gold Drop to Panic State
The gold drop was predicted from 1925, but the drop to these depths suggests that the markets are currently in a state of panic. We’ve been analyzing the big numbers of 1925, 1765, 1725, and 1680-75 since October 2020, and the price has been fluctuating in between them for more than six months. Our chart mining team discovered these levels through statistical analysis of long-term data, and the numbers have repeatedly been shown to be significant on charts. Last week, gold plunged over $140 in a single week, crashing through 1765 on Friday. Based on the panic in the gold market, a few scenarios have been developed that we will briefly explore.
Evaluation of Gold Drop
Development of Gold Pullback
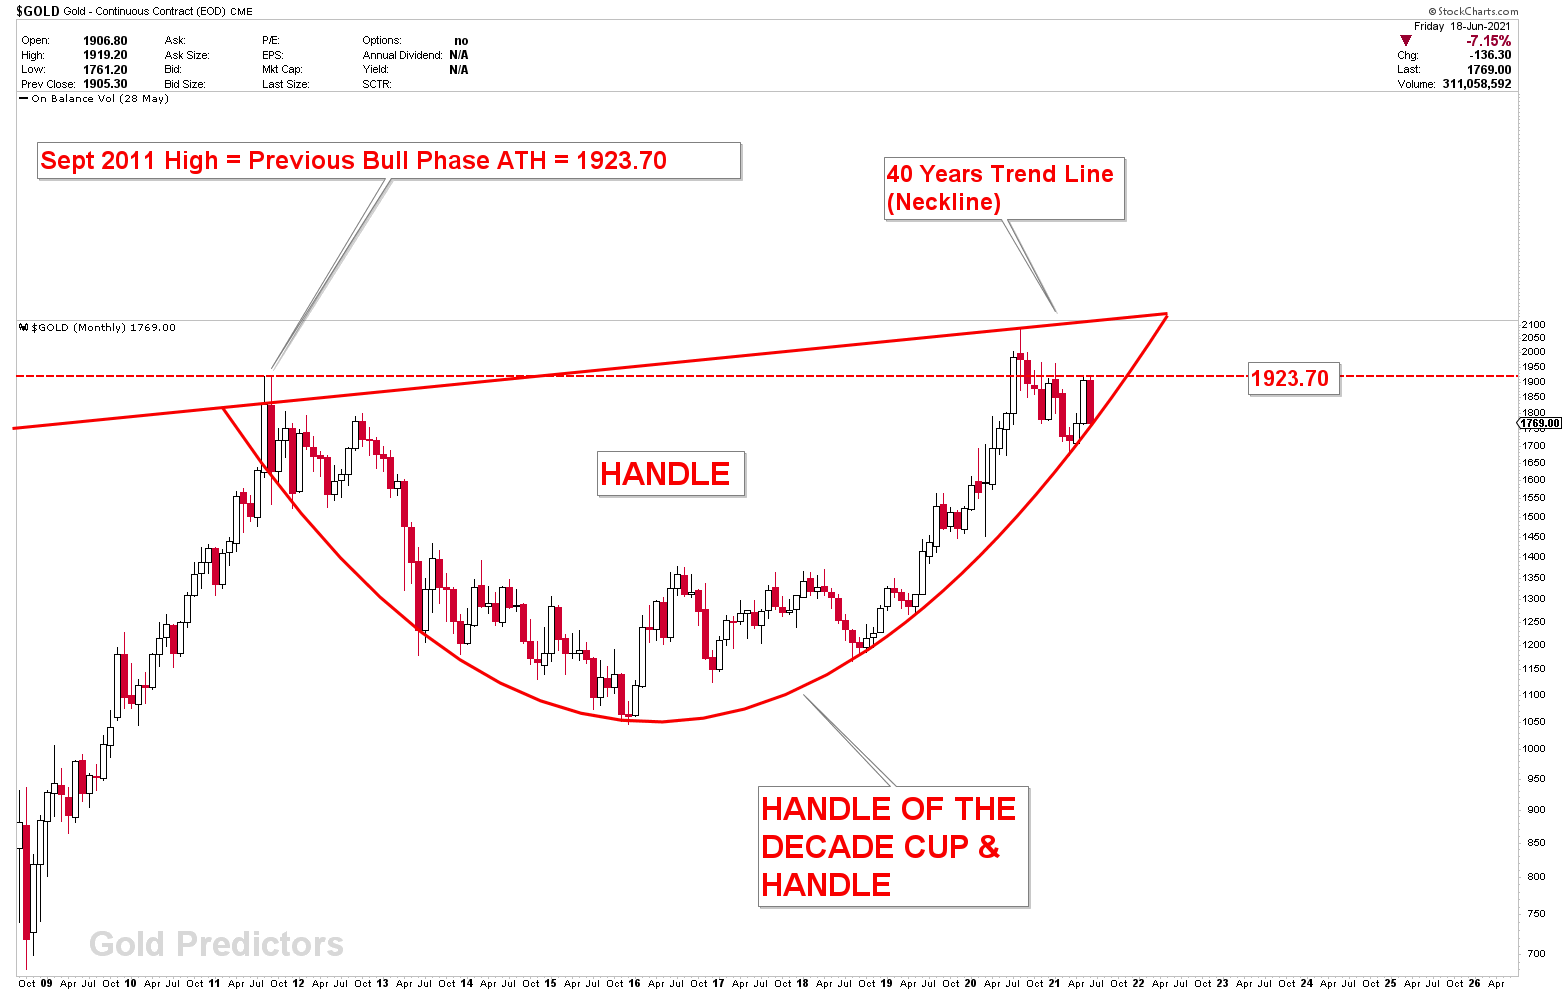
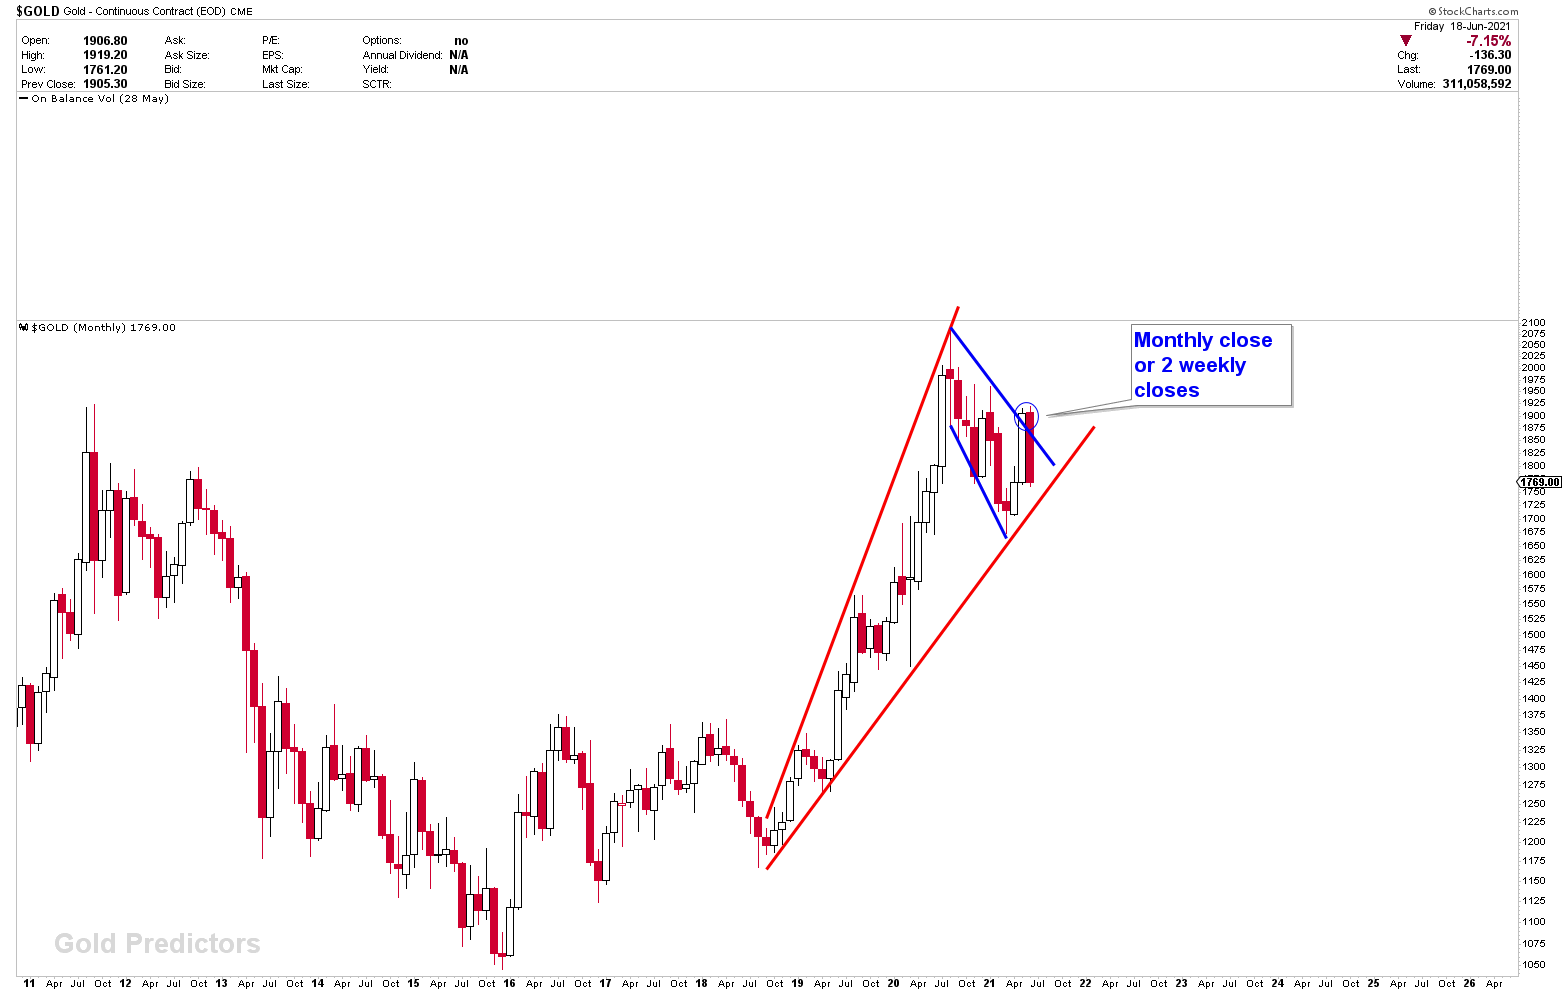
We’ve been addressing concerns about the monthly charts for the past four weeks. Research showed that the monthly charts were not broken and that a pullback was likely. Since November 2020, we’ve been saying the same thing: the ideal breakout for all-time highs in gold is only valid, if two weekly closes above 1931 or a monthly close above 1931 develops, which hasn’t been produced after the pullback from ATH of $2070. Since the highs of $2070 were established simply to kiss the 40-year long-term neckline of CUP and Handle, the horizontal resistance of $1923.70 has not been decisively breached in 2020.
Short-Term Cycles
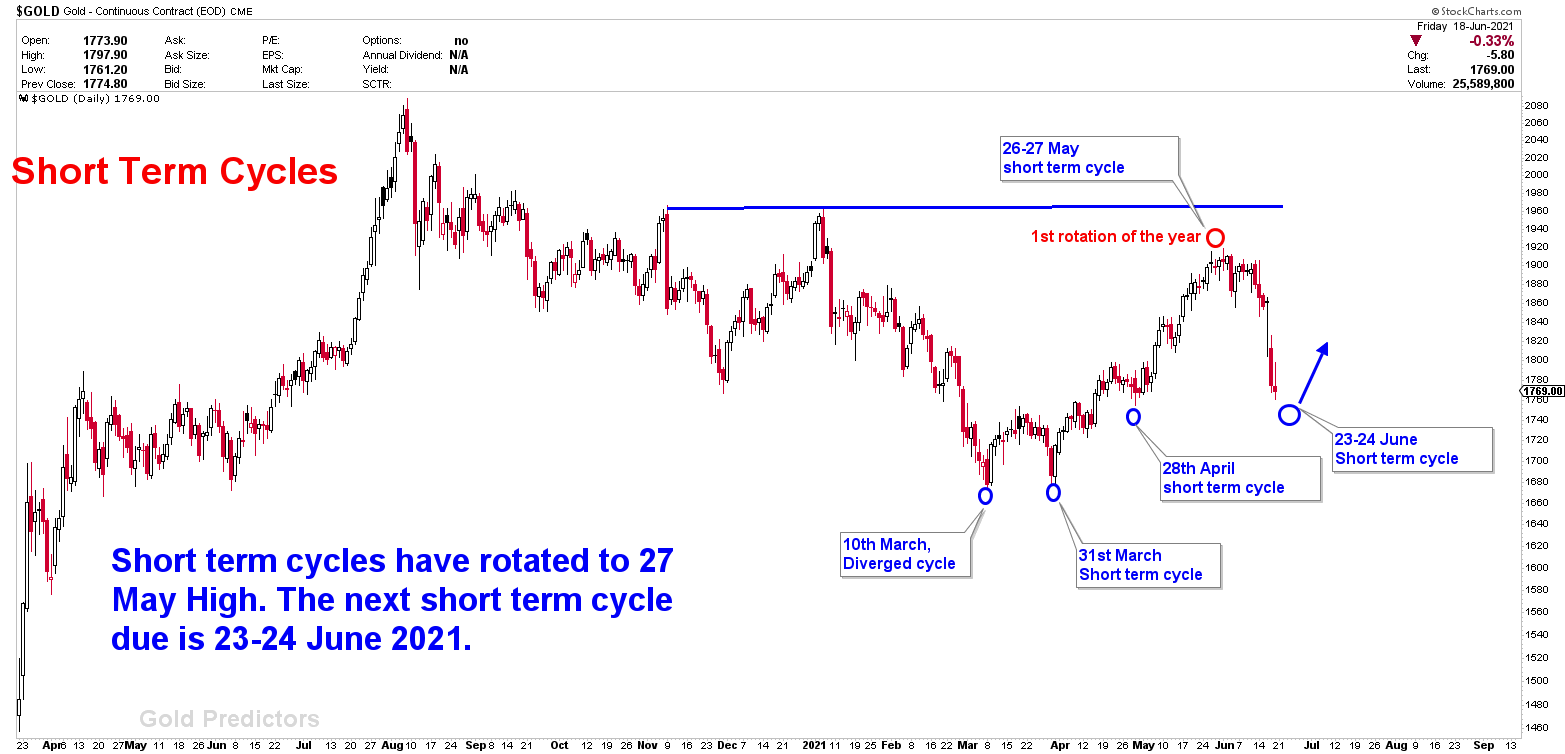
Short-term cycles have been 90% accurate since the current bottom in gold was formed on the diverged cycle of March 10th. The previous short-term cycle was rotated, resulting in a dramatic drop in gold prices. Prices are now challenging the April 28th lows (short-term cycle bottom). The next short-term cycle is expected to bottom on June 23-24, 2021, and because it might also be a seasonal bottom, the lows must be achieved through large swings (if bottom is formed). Note: Please allow 48 hours of deviation on both sides of the time due to huge uncertainty.
Just remember that, according to 20 years of gold data, a pullback in June/July is very healthy for a strong rally in Sept/Oct. This rally is followed by a massive pullback in October and then a happy ending to the year. If gold is not in a bull market, the inflection points stated in this report will be breached. This will result in a sharp drop in prices that is unfavorable based on fundamental analysis of the gold market. If the inflection points are breached, Sept/Oct will do the reverse, with September/October being the bottom (not expected).
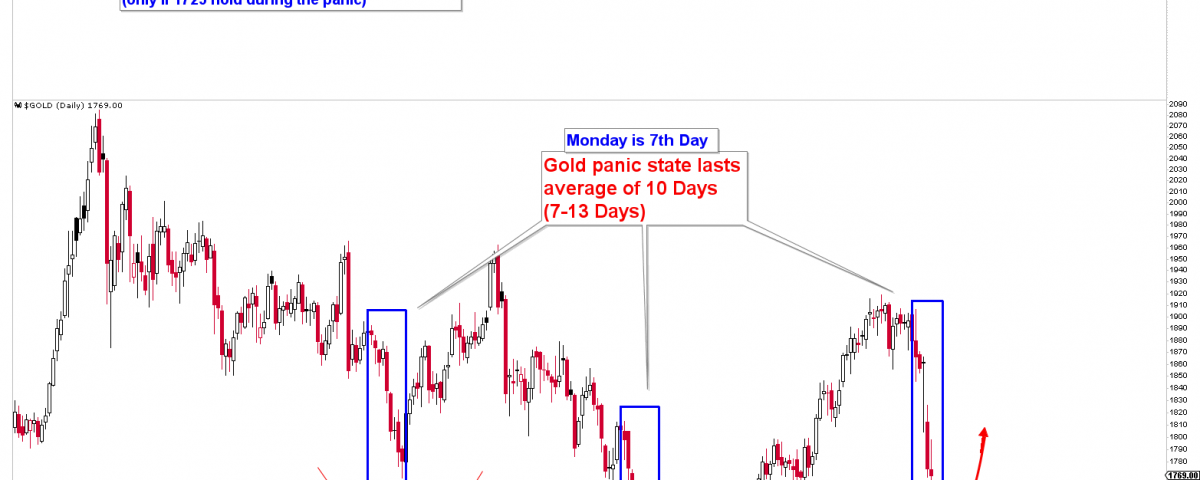
The Panic State of Gold Drop
The gold market dropped from 1900 to 1760 in just six days, which is quite unusual and indicates that gold has entered a panic state. The panic state usually lasts 10 days on average, with a normal range of 8 to 12 days. Since reaching an all-time high of $2070, gold has traded in a wide range between 1700 and 1900. The chart below shows a few of the huge price drops. However, if gold breaches the inflection this time, it will be a significant breakout on the long-term charts. This significant breakout will signal a quick drop in gold prices. Because the markets are in a panic mode, nothing can be guaranteed or confirmed; however, based on our chart mining calculations, there are few likely scenarios that could unfold in June and July.
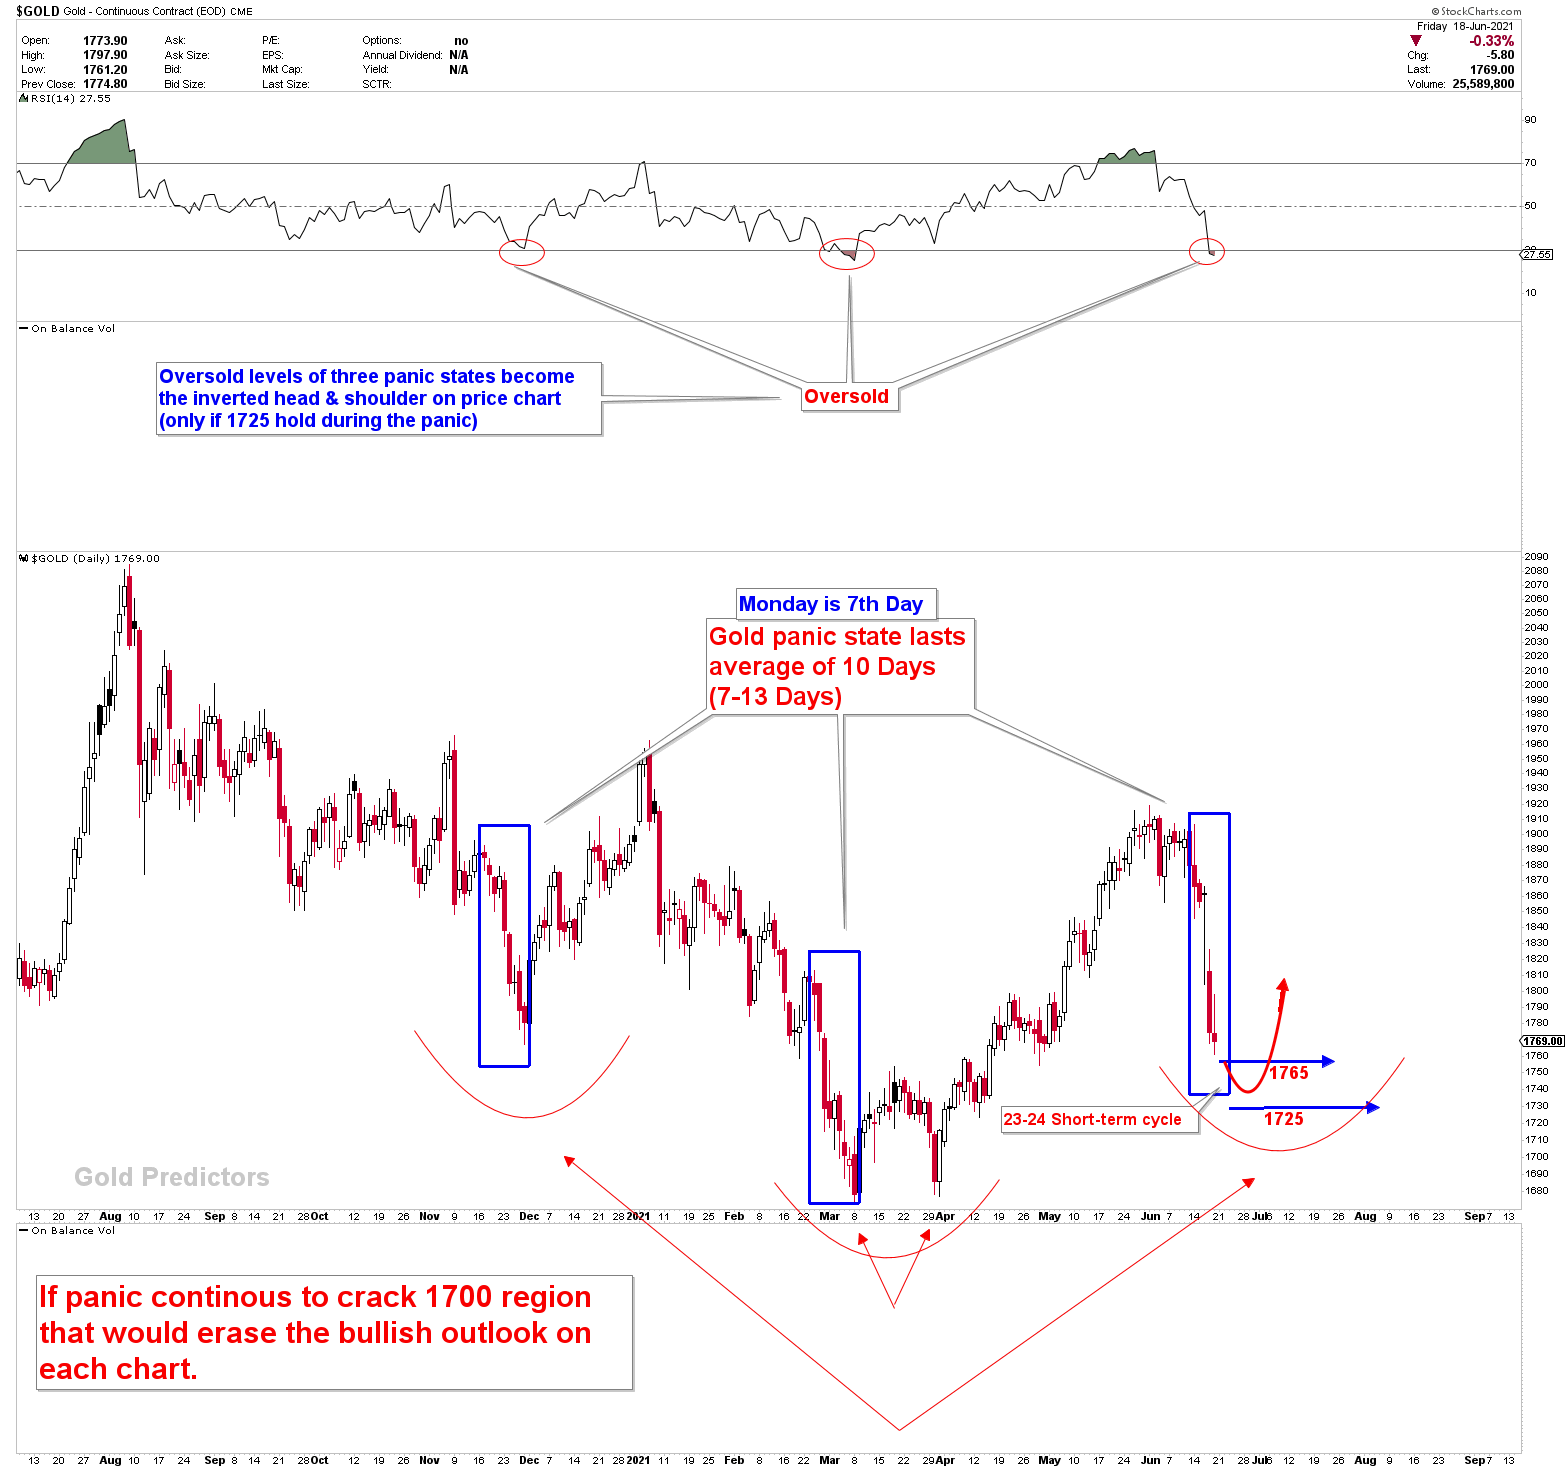
Even massive supports are exceeded when gold in a panic state.
The Possible Scenarios
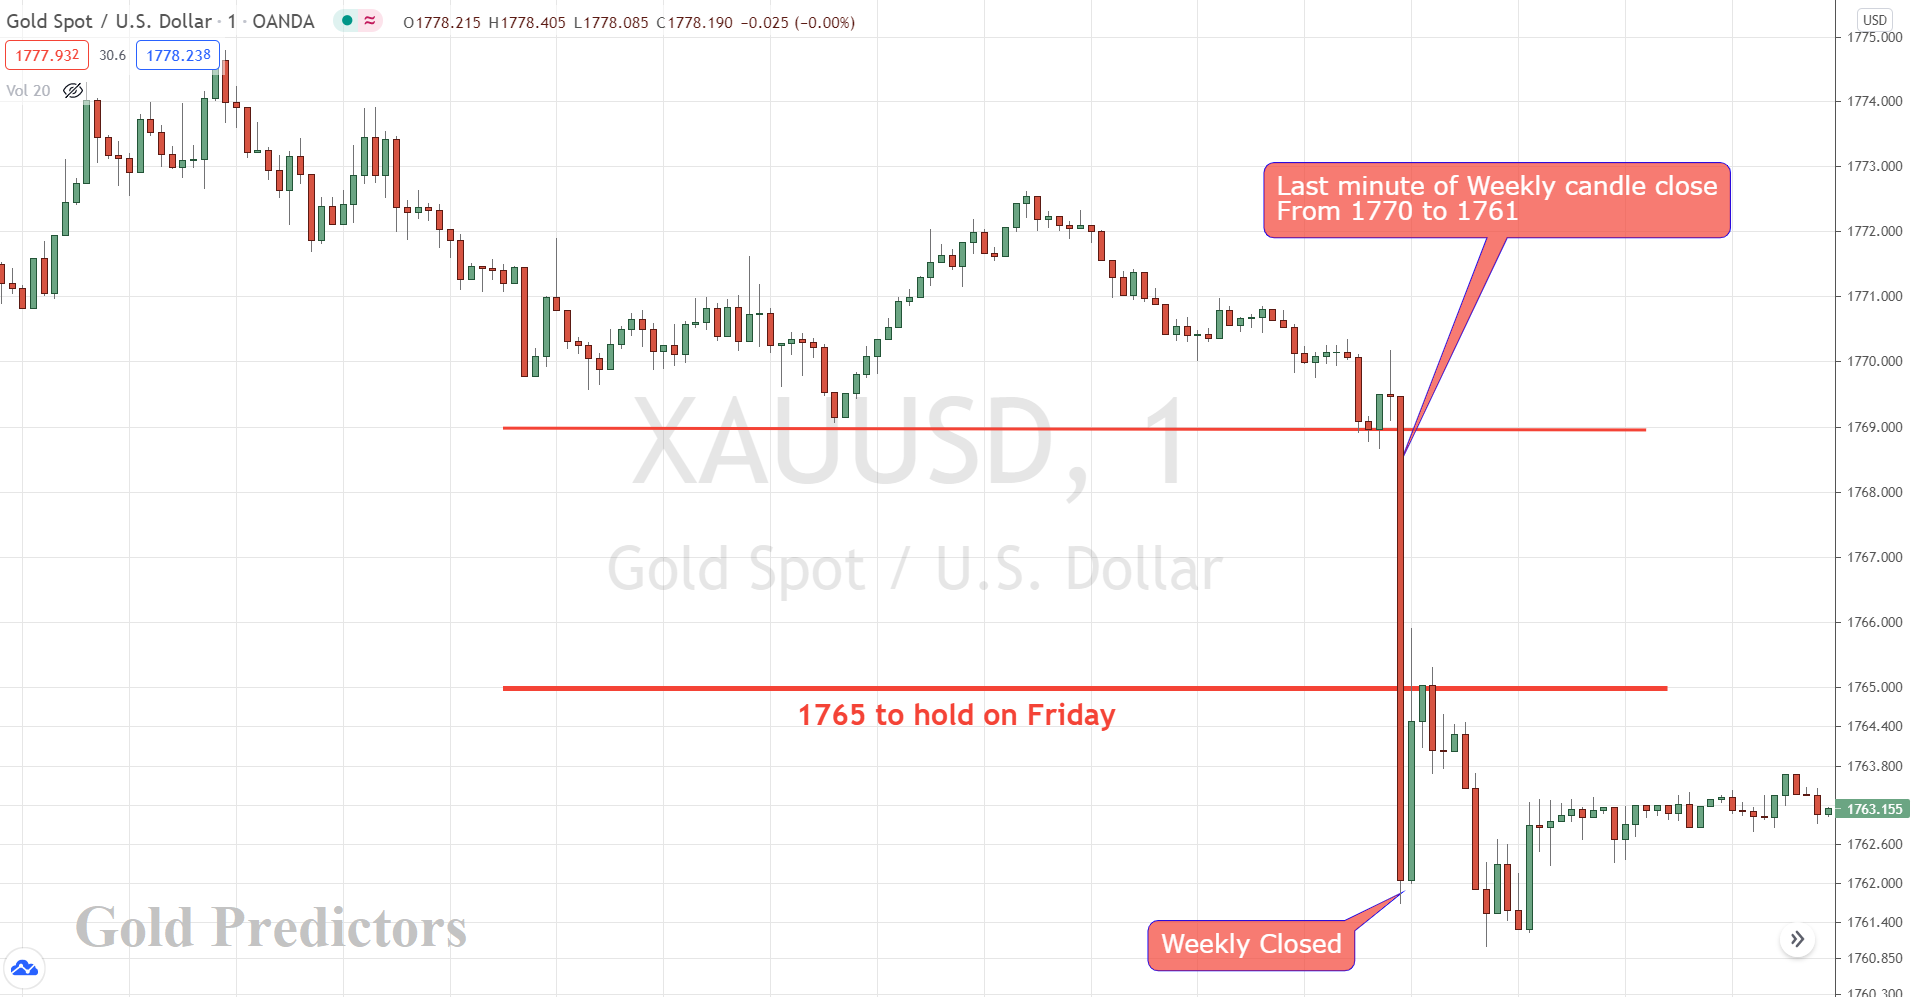
The recent $140 drop in gold, which happened last week, caused a panic in the market. After the break of 1800, the chart only shows two numbers: 1765 and 1725-1710. Once 1710 is gone, the long-term price structure will start to shift from Bull to Bear. Gold had been maintained at the levels of 1765 until the weekly close on Friday. However, gold prices fell below 1765 in the last minute of trading, as shown in the chart below. This resulted in possible cases on the gold market that could emerge during the month of June/July.
Case 1. If 1765 was broken last week
If the 1765 level is declared broken, prices may begin to fall lower from Tuesday. However, it is likely that prices will bounce from 1765 first, then face a downward movement towards 1725 region. If prices try to bottom here at 1765 or 1725, short-term charts must show some bottoming actions. The probability of this case to happen is 30%.
Case 2. If 1765 was a bear trap on Friday
If Friday’s close was a bear trap, prices are likely to bottom at 1765, and a bottom must form by the start of the week in order for higher prices to emerge. Because the text book’s weekly closing on Friday was less than 1765, the probability of this case to happen was reduced to 60%. However, because markets are so elastic these days, it’s highly possible that Friday’s close was a bear trap, and 1765 will be a magnet for a bounce to at least 1797.
1765-1725 region is massive support magnet
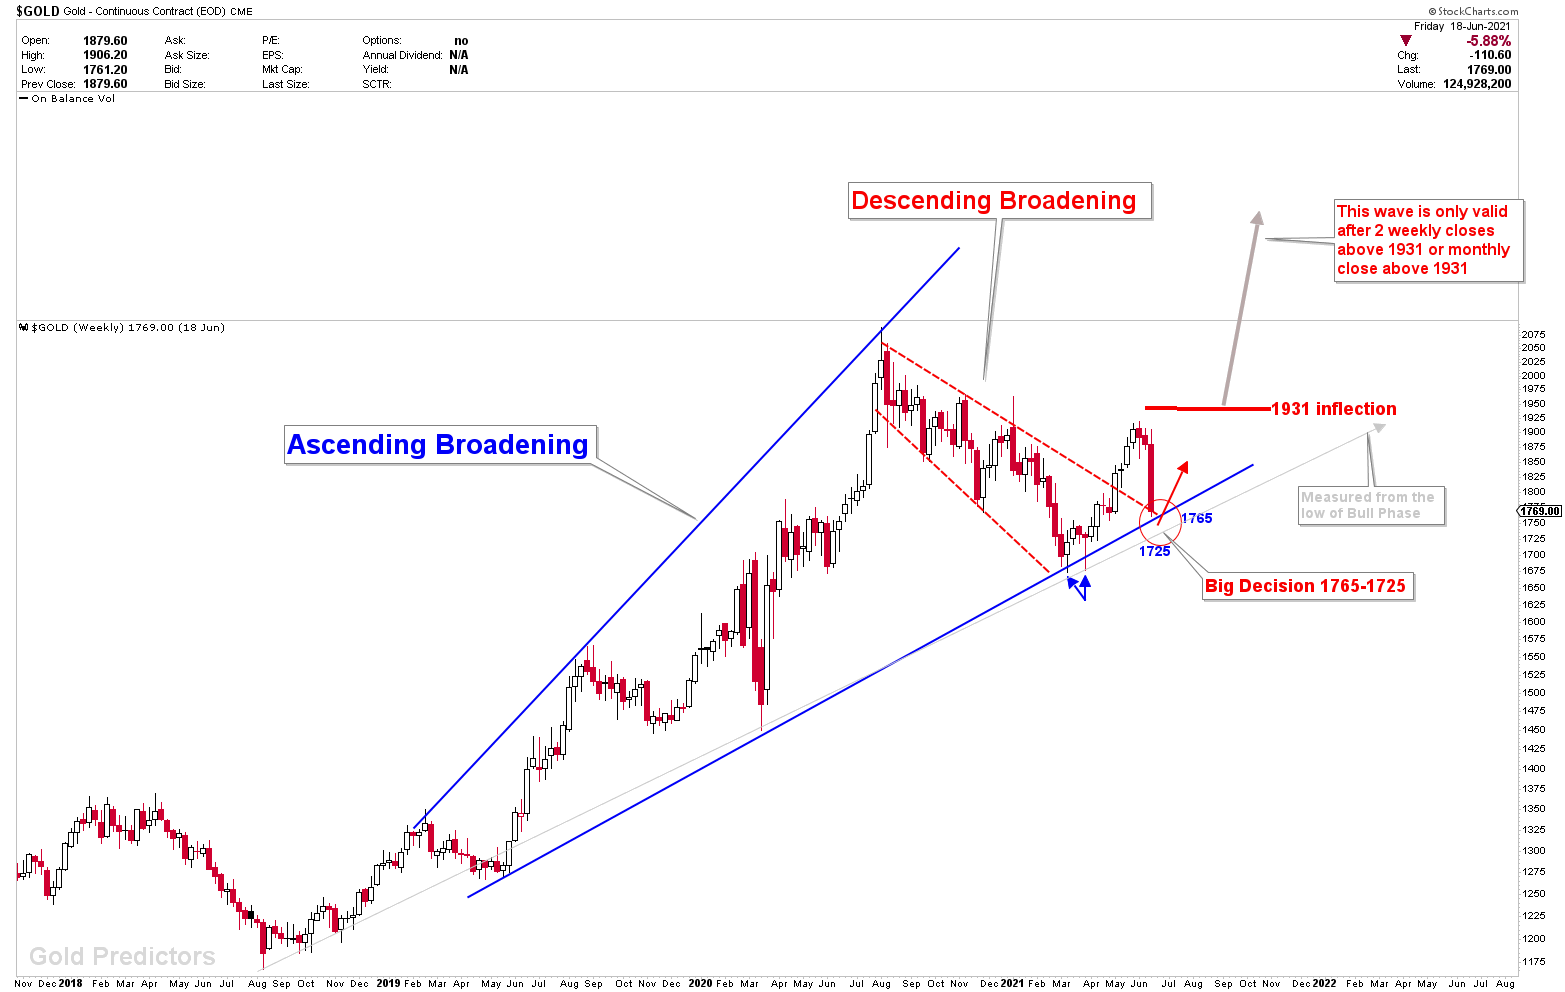
Case 3. If 1725-1675 Inflection is broken
Gold produced a bottom in the diverged cycle of March 10th with the yearly inflection of 1675, as seen in our March analysis. According to our forecast, the bottom has formed, and prices are unlikely to exceed the inflection area of 1675. However, if prices clearly break through the zone, it will represent a risk to the long-term gold bull phase, and gold may begin to trend downwards. We don’t expect this scenario to play out, but it does have a 10% chance of happening.
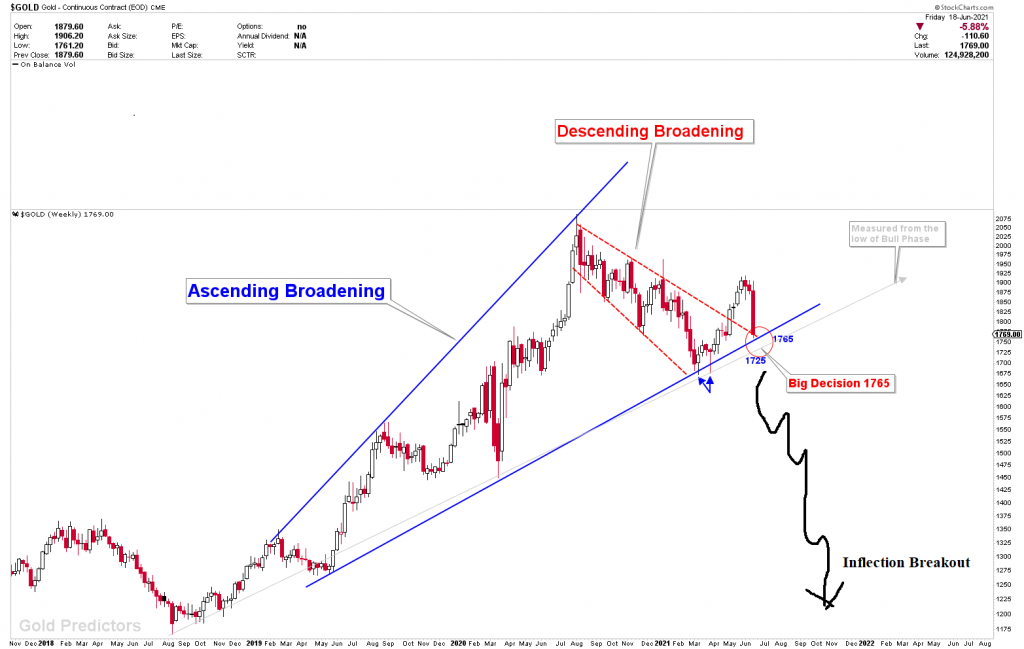
The patterns have been working perfectly for the past seven months. Prices dropped from 2000 to our designated 1700 zone before shooting back up to 1900. It’s important to remember that ascending broadening is a bearish pattern with 80% of bearish breakouts. However, we did not foresee a breakout of over 1680 in March due to too many other factors.
These inflection points are currently being tested again. If they are broken this time, the patterns will result in a strong bearish view. The bearish view may cause prices falling dramatically to much lower levels. Descending broadening, which is the inverse of ascending broadening, formed after the March/April 2021 rally. This indicates that prices are likely to move higher. However, the issue emerged last week, when the weekly closing fell below 1765, which was unexpected. However, because 1765 was broken in the last minutes of the weekly close, it is possible that this is only a bear trap to clear the stops, and prices will bounce from the 1765 region to go higher.
Where the Gold is Headed Next?
According to the gold technical charts shown above, gold is trading at long-term inflection points. If these inflections give way to downside, prices may challenge the long-term bull phase that began in 2019. On the other hand, if prices bottom at the inflection area, prices will explode higher towards the 1931 inflection again. If that happened then any two weekly closes above 1931 on long term charts will cause a panic above 2120 and eventually 2300. If this occurs, we will calculate the actual figures. It’s just a case of patience and observing for now.
Because of the panic state, even if gold reaches 1725 by Tuesday, it will still be dangerous. The short-term cycle days of June 23-24 are expected to establish a short-term bottom. Nothing has changed from the fundamental point of view. Monetary base continues to expand, debt continues to grow, inflation is moving higher and treasuries remain subdued. We predict prices to form a bottom around June/July, but the depth of the bottom cannot be estimated due to the panic in the gold market. Because prices clear stops on both sides before following the main path in such a move. We foresee a similar turnaround after the bottom has been hit, and our outlook has not changed as a result of the recent selloff. As per last few weeks, 1765 and 1725 remain the big support numbers.
Our View has not changed yet.
Members! Please be advised that we may send frequent trading signals via WhatsApp during the panic state.
Please be aware that the trading position to buy Spot Gold at 1772 for today is open. We can close it at any time or open a new one. We will send frequent WhatsApp messages until gold is in panic.
