Emergence of Next Gold Move in June | Gold Predictors - Forecasting Gold Prices

New York

London

Sydney

Tokyo

Log In

  • Register
  • Lost your password?
gold predictorsgold predictorsgold predictorsgold predictors
  • HOME
  • ABOUT US
    • About Us
    • Social Networks
    • Industry Links
    • Testimonials
  • RESEARCH
    • Scientific Trade Strategies
    • Gold Hub
    • Gold Importance
    • Silver Importance
  • GOLD HUB
  • GOLD ANALYSIS
    • Gold Analysis
    • Technical Analysis
      • Trend Identification
      • Phase Identification
      • Important Levels
      • Volatility Measurement
    • Gold Cycle
      • Short Term Cycles
      • Medium Term Cycles
      • Long Term Cycles
    • Price Action Analysis
      • Phase Identification
      • Historical Pattern Identification
      • Candlestick Pattern Identification
    • Fundamental Analysis of Gold
    • Gold Related Markets Analysis
    • Gold Seasonal
  • TRADING METHODOLOGY
    • Gold Analysis
      • Technical Analysis
      • Gold Cycle
      • Price Action Strategy
      • Fundamental Analysis
      • Gold Related Markets Analysis
      • Gold Seasonal
    • Measure Signal Strength
      • Weak Signal
      • Strong Signal
      • Confirmed Signal
    • Trading Decision
    • Trading Rules
      • Basic Trading Rules
      • Gold Predictors Trading Rules
    • Trade Examples
    • Performance
  • LIVE CHARTS
  • MEMBERSHIPS
    • Free Membership
    • Premium Membership
    • SignUp
  • MEMBERS AREA
    • Free Article
    • Premium Article
    • Trading Signals
    • Long Term Signals
    • Forex Reports
    • Crypto Reports
  • FOREX REPORTS
  • HELP
    • FAQ
    • Contact Us
Login / Register

Emergence of Next Gold Move in June

0
Published by admin at June 16, 2021
Categories
  • Premium Articles
Tags

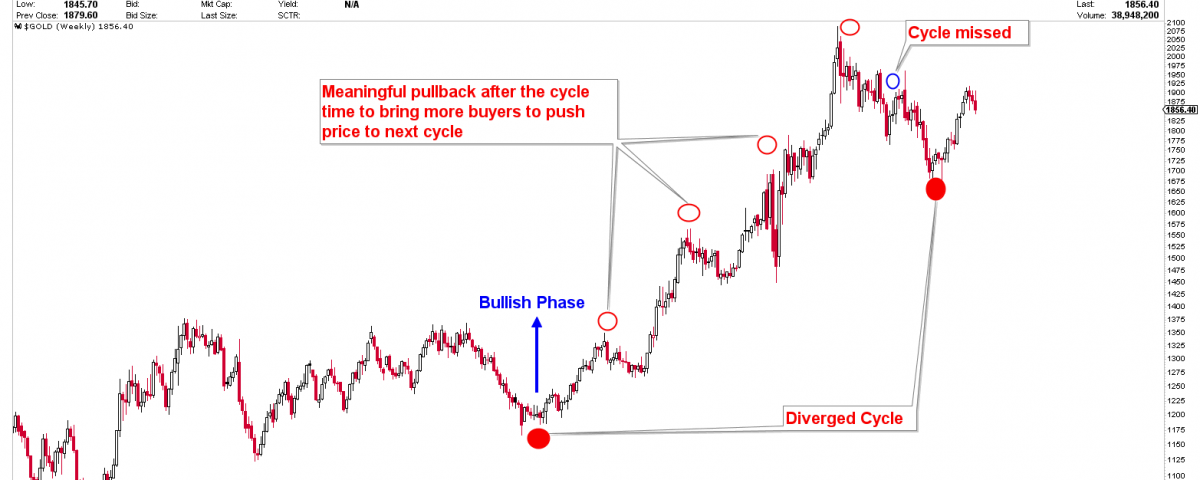
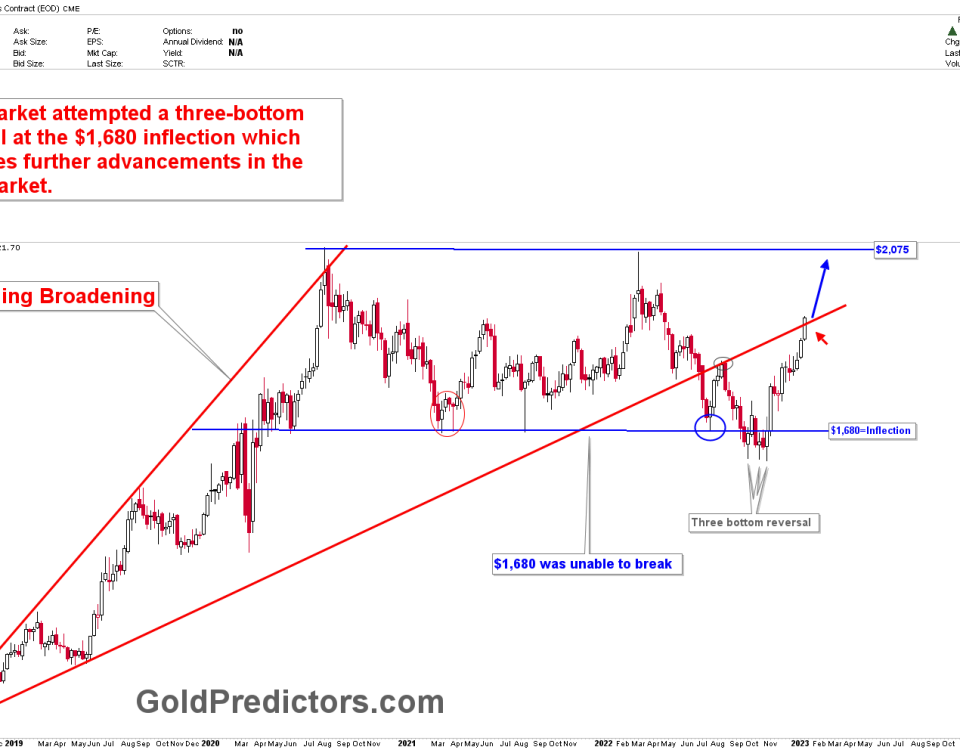
We’ve been discussing the possibility of a pullback from the 1925 region for the past 3-4 weeks. The concerns were demonstrated using monthly charts, in which gold prices failed to close the month of May above 1923. The monthly ascending broadening chart showed the same trend, with a pullback to an ideal number in the 1820 area. However, the markets are too elastic and, therefore, ideal numbers do not exist. Because of the high volatility, the support and resistance levels have large deviations on both sides of market. Since the new all-time highs were posted above the 2000 region, the gold markets have been extremely volatile. Our divergent cycle of 10th march on the yearly inflection of 1675-1780, completed the pullback from the highs. Gold prices emerged a cycle rotation and produced a short-term top on 26-27 May 2021. The expected pullback in gold has been emerged and the next gold move will be evaluated based on technical and cyclical analysis.

In today’s report, we’ll look at the technical reasons for potential bottoms or highs that could emerge at any time. We’ll discuss the short-term cycles that were rotated on May 27th and produced a high. Based on time measurement and number calculation techniques, we will discuss the possible time and numbers for the next gold turn.

This content is locked

Login To Unlock The Content!

Username:
Password:

Related posts

January 29, 2023

Premium Updates Are Mostly Delivered Using Emails


Read more
recession
January 28, 2023

Gold – A Recession Warning


Read more
gold ascending broadening
January 15, 2023

Gold: Bullish Short-Term Structure


Read more

Comments are closed.

ABOUT US

  • About Us
  • Social Networks
  • Industry Links
  • Testimonials
  • Terms & Conditions

TECHNICAL ANALYSIS

  • Technical Analysis
  • Trend Identification
  • Phase Identification
  • Important Levels
  • Volatility Measurement

CYCLE ANALYSIS

  • Gold Cycle
  • Short Term Cycles
  • Medium Term Cycles
  • Long Term Cycles

PRICE ACTION ANALYSIS

  • Price Action Analysis
  • Phase Identification
  • Historical Pattern Identification
  • Candlestick Pattern Identification
© 2017 Gold Predictors. All Rights Reserved.
  • Remember Me
    Lost your password?
    Dont have an account?Sign Up