


Chainlink Trading At Significant Area
Chainlink (LINK) is a decentralized network, based on the Ethereum ecosystem, designed to link smart contracts on the blockchain with data. In 2017, the network issued the token, raising $32 million at that time. Since then, LINK has become the ninth largest cryptocurrency on the market, with the price rising from $0.19 to $34 now. The total capitalization of LINK is $13,841,122,781. There is total 1,000,000,000 LINKS exists and 40.70% are already in circulation.
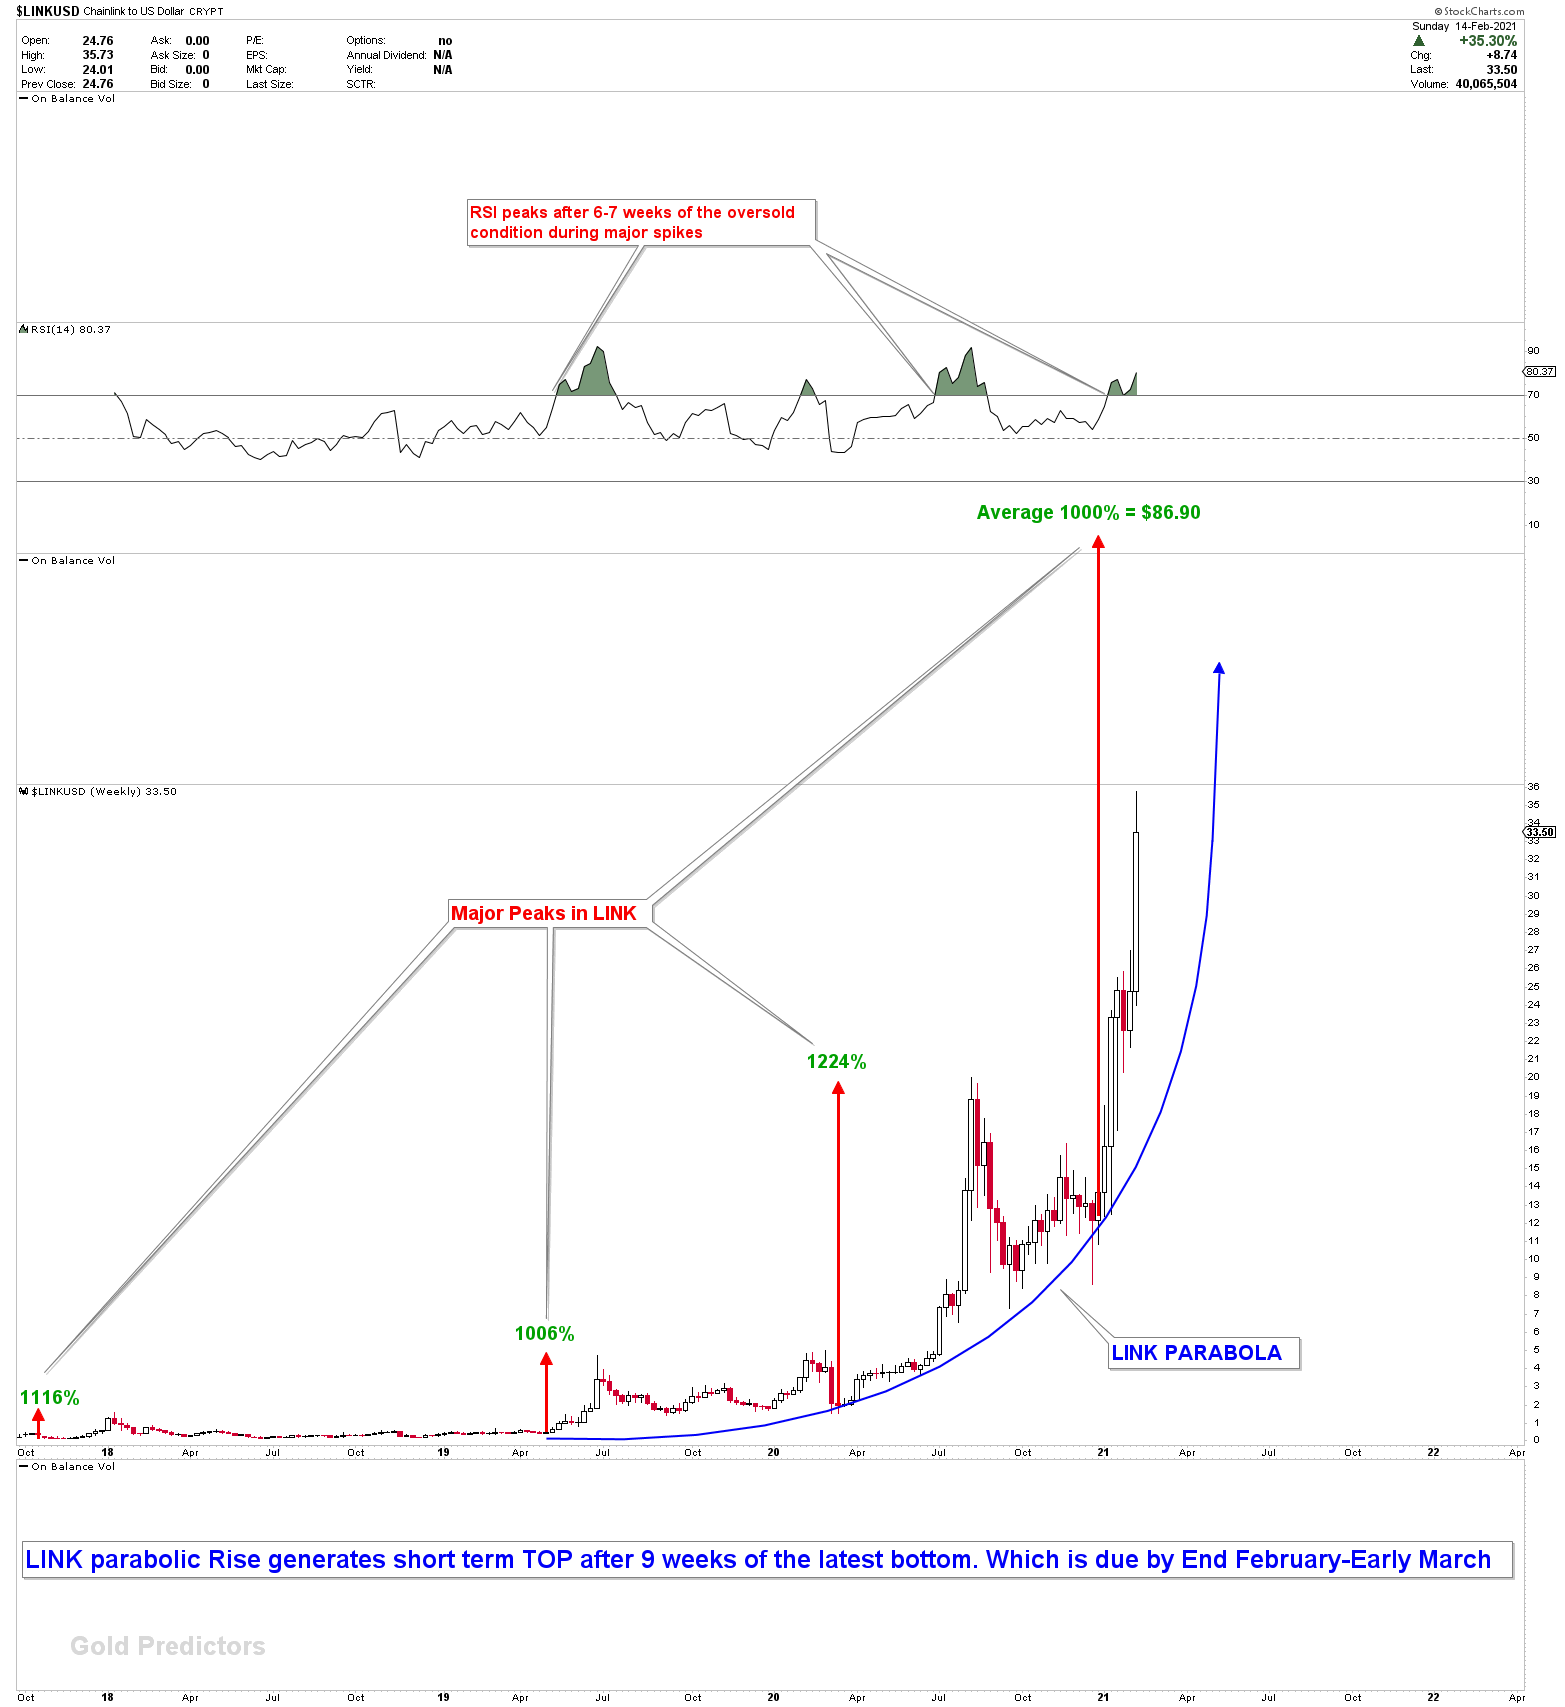
The LINK weekly chart below, illustrates that prices went up in four waves since now. And the fourth wave is underway. 1116% of the gains were made in the spike of the last quarter of 2017, while spikes received gains of 1006% and 1224% in the second quarter of 2019 and 3rd quarter of 2020, respectively. The top is not so easy to predict, as LINK grows in parabolic motion, therefore, it is highly possible that a maximum of 1500% gains from 2021 bottom could be obtained by 2021 spikes. In this kind of circumstance, Top is always established out of market expectations and short lived. It was also interesting to see that LINK has short cycle that peaks in 9 weeks from the latest bottom. In each spike, RSI remains overbought and peaks in the 6-7 weeks from the overbought levels.
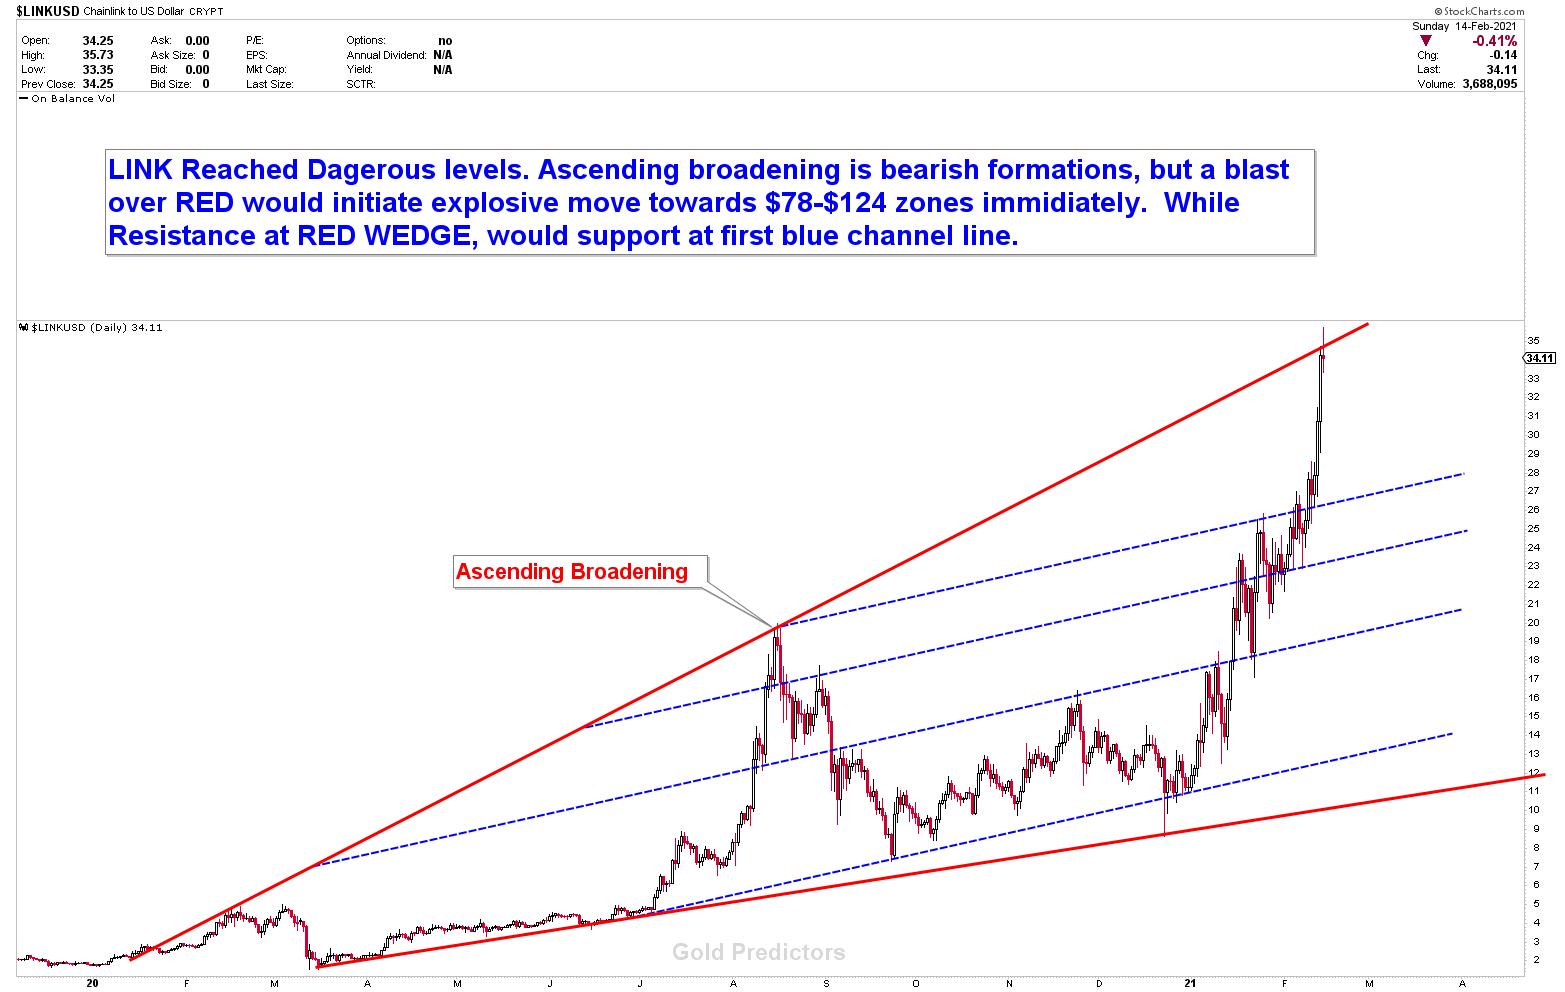
The channels in which LINK was broken out are outlined by another weekly chart. Prices have currently reached the short term targeted area, but the major $80-$100 target is still pending. The red lines indicate an ascending broadening wedge that is usually bearish in nature. If, interestingly, these wedges are broken upside, huge moves will come that break market expectations. NASDAQ is the most recent example. If LINK decides to pullback from here, then $28-$29 and 25.35 would be the good support. In the event of deeper pullback $ 22.11 and $18.90 are the strongest numbers. If LINK was to broke above the RED line, It would be much faster to achieve the goals within 2-4 weeks, because LINK will be flying into the air.
We don’t Recommend To Buy LINK At Current Levels. Buy Only If Price is Low
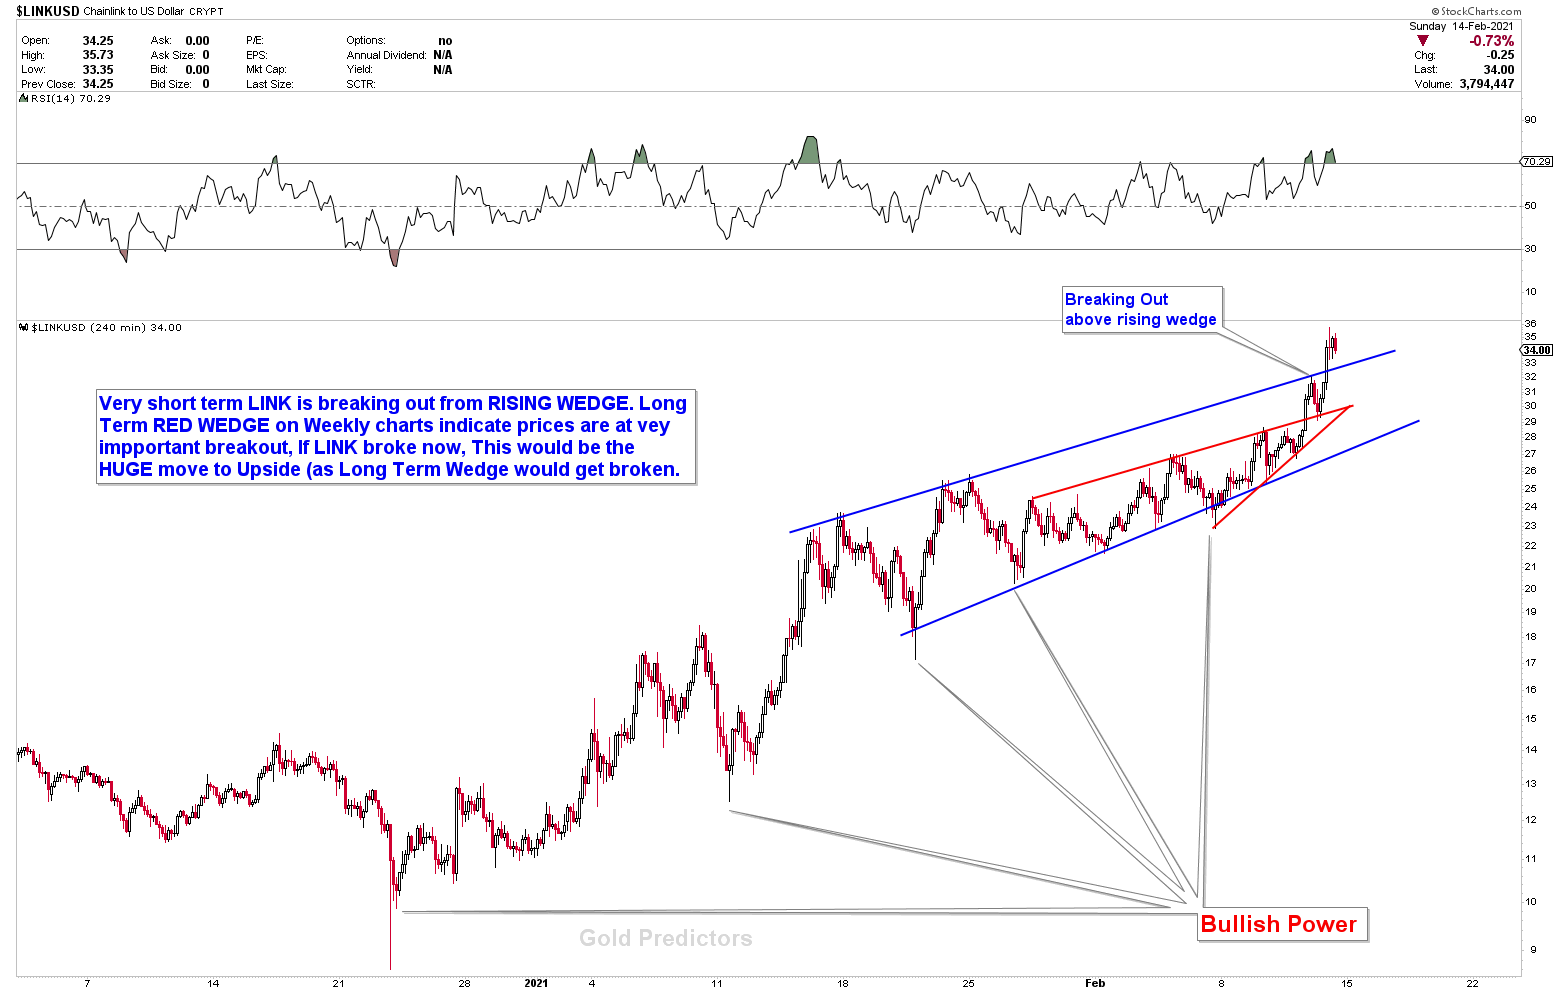
To see the expected outcome of these significant areas, let’s have a look at 4 hours charts. Prices just broke the rising wedge on the 4 Hours charts, and it looks like it wants to go higher. But the word CAUTION is still being considered by us. Short-term price action shows some bullish bias and suggests that prices want to broaden through long-term RED Ascending broadening patterns.
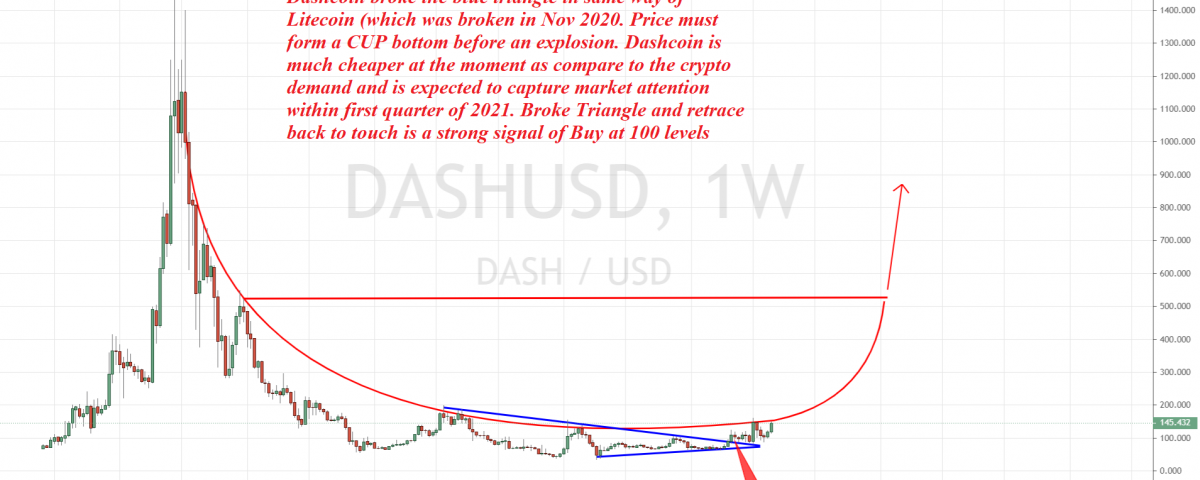
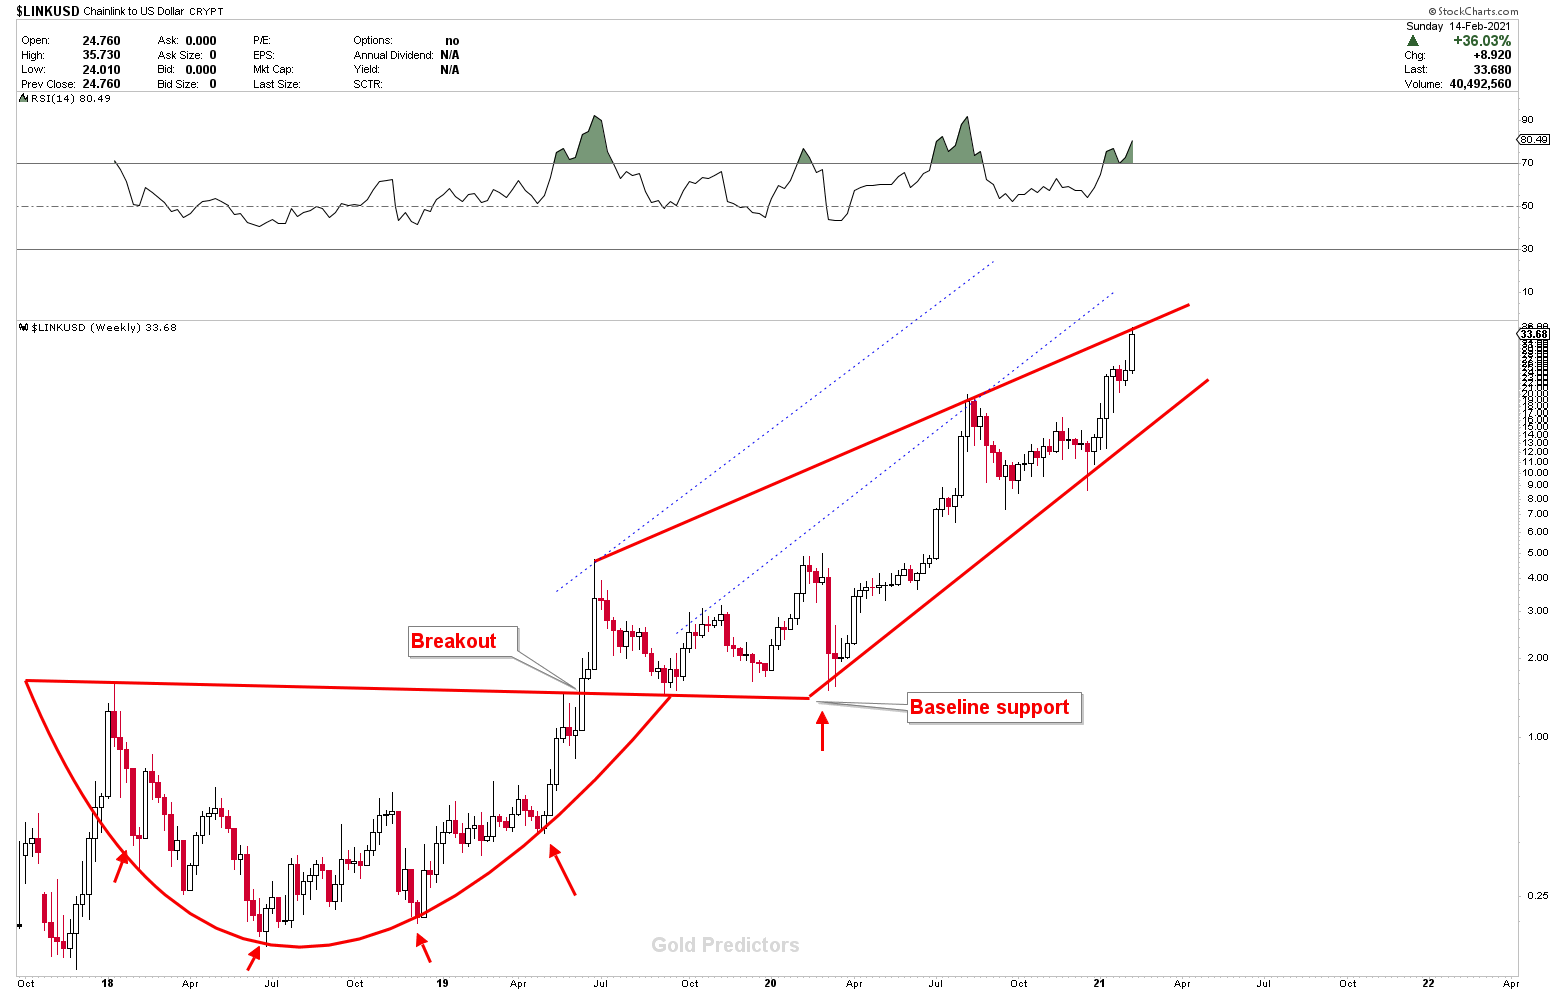
Let’s take a glance at Log scale. In LINK, the Cup bottom was confirmed in 2019 and prices are looking higher. The CUP bottom shows much higher levels to come in future, while the baseline support remains strong. The significance of current levels in LINK is also identified in this chart.
In short, Chainlink is trading at significant area where resistance is obtained by the Ascending Broadening Wedge. At the moment, bullish power is strong and there is no doubt that prices can break up from here. If prices got higher from this region, the acceleration would be much higher. The calculation of spikes suggests $80-$100 as a target, but current levels must be breached
To receive the free trading alerts, signals and articles please subscribe as a Free member to the link below.


